| Param | Original file | Final file |
|---|---|---|
| Filename | modeM0/AS1A12_104T01_9000005728_41981cztM0_level2.fits | modeM0/AS1A12_104T01_9000005728_41981cztM0_level2_quad_clean.evt |
| Size (bytes) | 283,276,800 | 85,861,440 |
| Size | 270.2 MB | 81.9 MB |
| Events in quadrant A | 2,674,886 | 579,555 |
| Events in quadrant B | 2,299,552 | 602,182 |
| Events in quadrant C | 2,391,099 | 568,461 |
| Events in quadrant D | 2,739,853 | 507,752 |
| Mode SS | |||
|---|---|---|---|
| Quadrant | BADHDUFLAG | Total packets | Discarded packets |
| A | 0 | 100 | 0 |
| B | 0 | 100 | 0 |
| C | 0 | 100 | 0 |
| D | 0 | 100 | 0 |
| Mode M0 | |||
|---|---|---|---|
| Quadrant | BADHDUFLAG | Total packets | Discarded packets |
| A | 0 | 10806 | 3 |
| B | 0 | 10031 | 2 |
| C | 0 | 10062 | 2 |
| D | 0 | 11749 | 2 |
| Mode M9 | |||
|---|---|---|---|
| Quadrant | BADHDUFLAG | Total packets | Discarded packets |
| A | 0 | 32 | 0 |
| B | 0 | 32 | 0 |
| C | 0 | 32 | 0 |
| D | 0 | 33 | 0 |
| Quadrant | Total seconds | Saturated seconds | Saturation percentage |
|---|---|---|---|
| A | 4875 | 8 | 0.164103% |
| B | 4875 | 11 | 0.225641% |
| C | 4875 | 20 | 0.410256% |
| D | 4875 | 158 | 3.241026% |
Noise dominated data is calculated using 1-second bins in cleaned event files. If a bin has >2000 counts, and if more than 50% of those come from <1% of pixels, then it is considered to be noise-dominated and hence unusable.
| Quadrant | # 1 sec bins | Bins with >0 counts | Bins with >2000 counts | High rate bins dominated by noise | Noise dominated (total time) | Noise dominated (detector-on time) | Marked lightcurve |
|---|---|---|---|---|---|---|---|
| A | 6938 | 4876 | 4 | 4 | 0.06% | 0.08% | 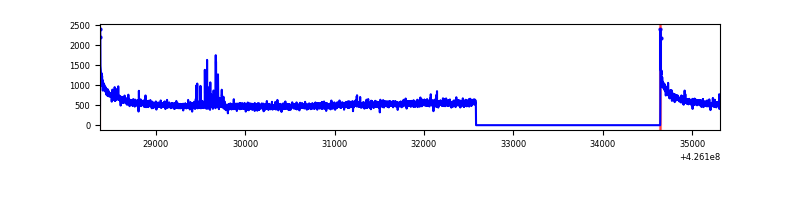 |
| B | 6938 | 4876 | 3 | 3 | 0.04% | 0.06% | 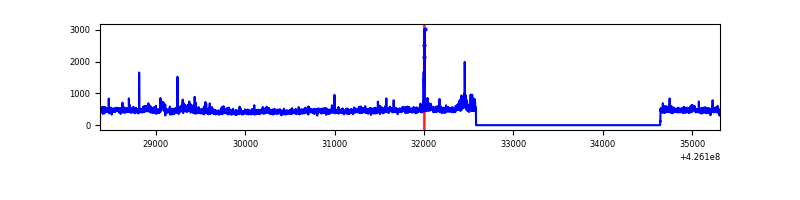 |
| C | 6938 | 4876 | 23 | 23 | 0.33% | 0.47% | 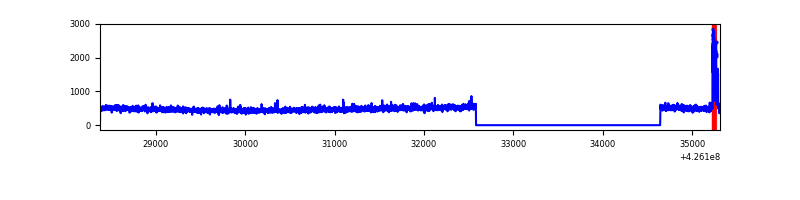 |
| D | 6938 | 4876 | 137 | 137 | 1.97% | 2.81% | 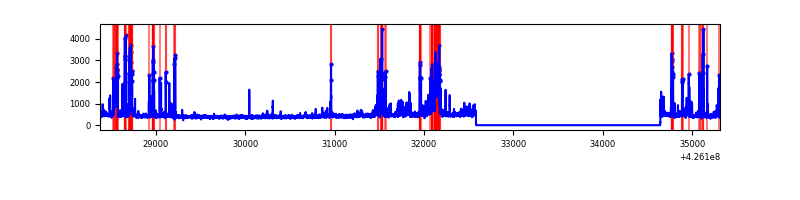 |
Top three noisy pixels from each quadrant. If the there are fewer than three noisy pixels in the level2.evt file, extra rows are filled as -1
| Pixel properties | Quadrant properties | ||||||
|---|---|---|---|---|---|---|---|
| Quadrant | DetID | PixID | Counts | Sigma | Mean | Median | Sigma |
| A | 10 | 83 | 490941 | 4333.21 | 552 | 542 | 113.2 |
| A | 2 | 79 | 46500 | 406.09 | 552 | 542 | 113.2 |
| A | 3 | 137 | 5841 | 46.82 | 552 | 542 | 113.2 |
| B | 0 | 190 | 51941 | 486.46 | 551 | 536 | 105.7 |
| B | 0 | 156 | 28697 | 266.5 | 551 | 536 | 105.7 |
| B | 4 | 81 | 27958 | 259.5 | 551 | 536 | 105.7 |
| C | 15 | 214 | 200650 | 1600.46 | 536 | 539 | 125.0 |
| C | 15 | 111 | 80984 | 643.39 | 536 | 539 | 125.0 |
| C | 8 | 79 | 16376 | 126.66 | 536 | 539 | 125.0 |
| D | 13 | 249 | 350505 | 2706.27 | 524 | 508 | 129.3 |
| D | 12 | 6 | 174651 | 1346.52 | 524 | 508 | 129.3 |
| D | 2 | 249 | 152204 | 1172.95 | 524 | 508 | 129.3 |
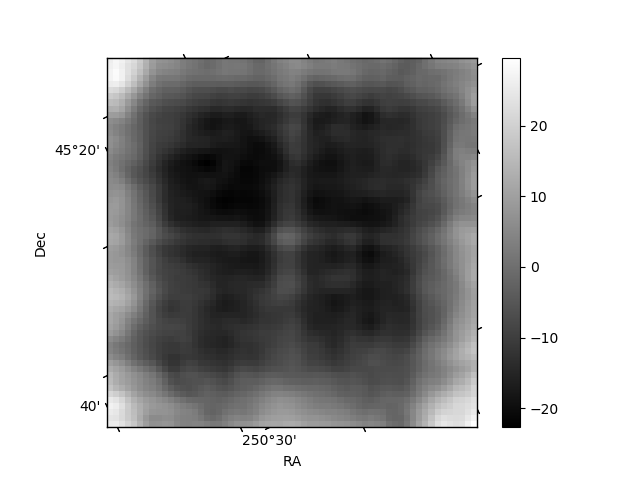
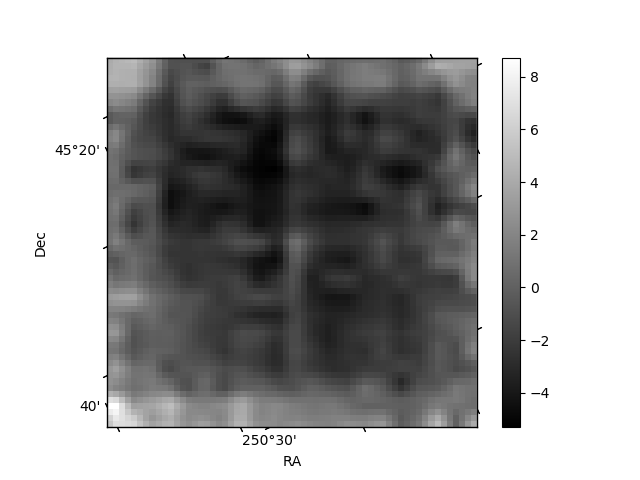
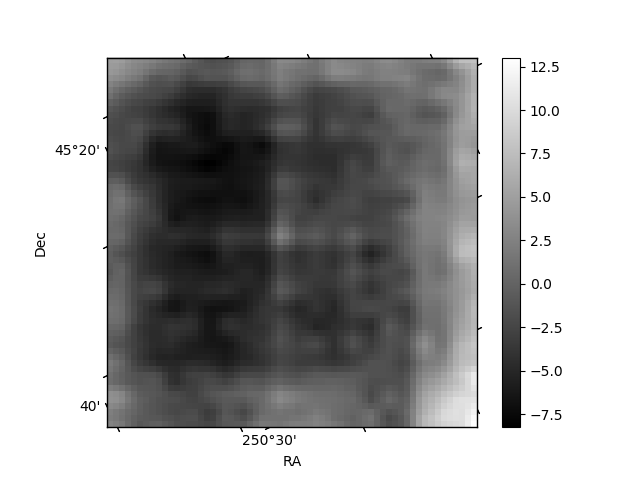
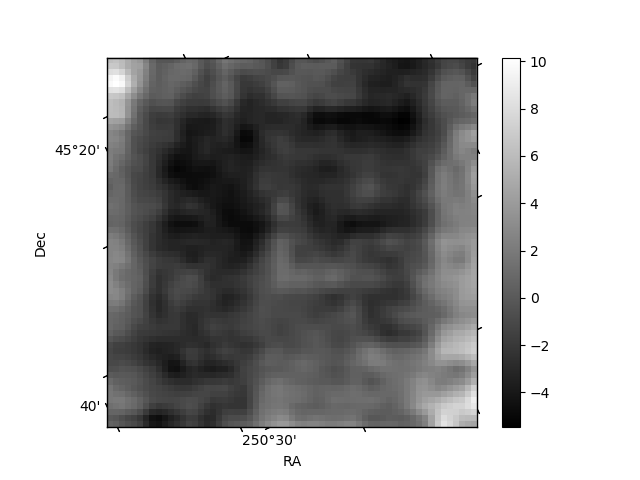
Histogram calculated using DETX and DETY for each event in the final _common_clean file
| Quadrant A | 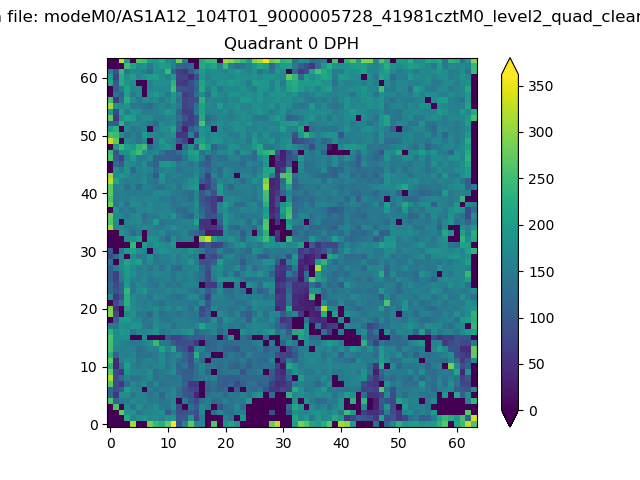 |
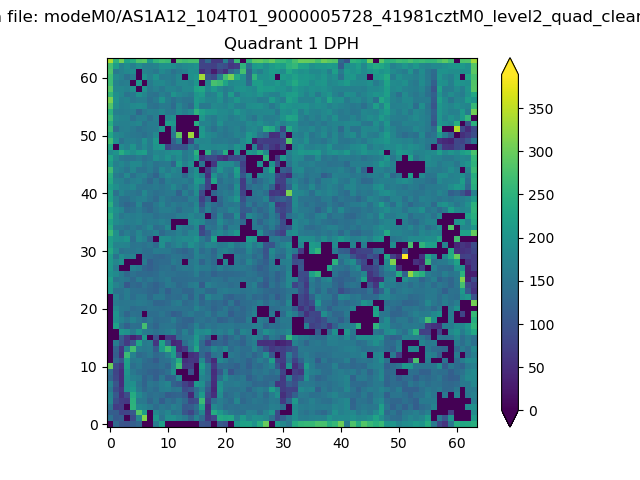 |
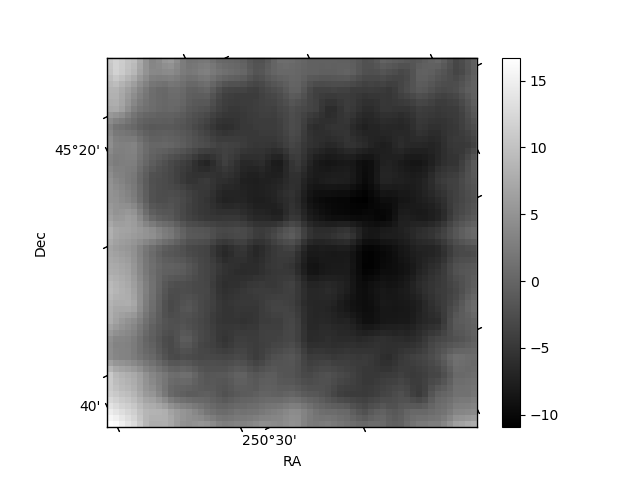
Quadrant B |
|---|---|---|---|
| Quadrant D | 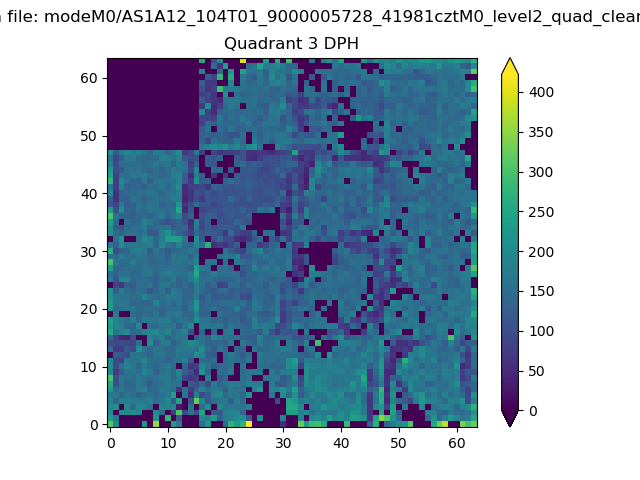 |
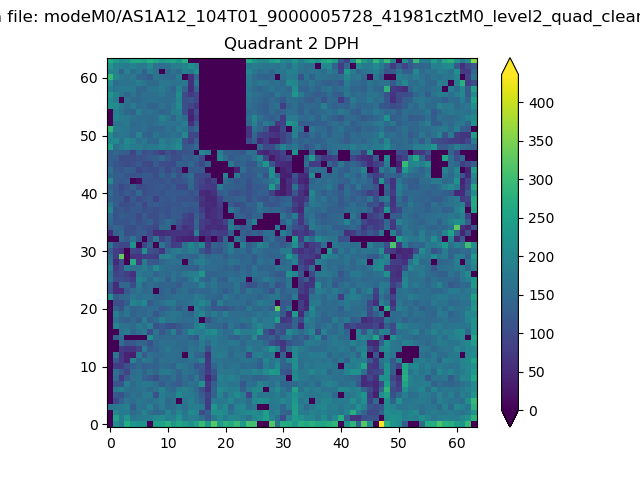 |
Quadrant C |
| Plot type | Count rate plots | Images |
|---|---|---|
| Comparison with Poisson distribution Blue bars denote a histogram of data divided into 1 sec bins. Red curve is a Poisson curve with rate = median count rate of data. |
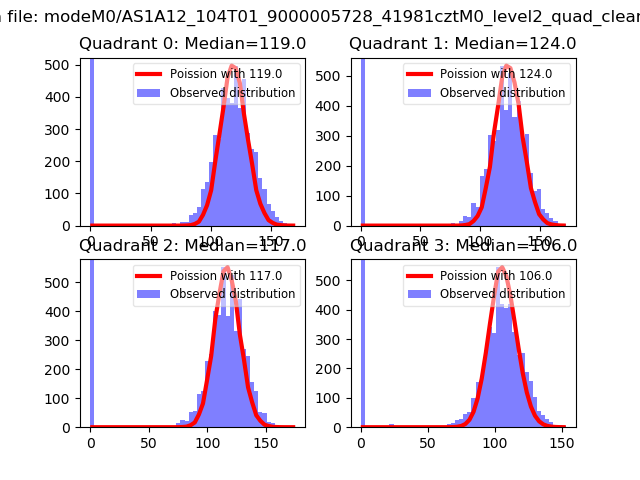 |
 |
| Quadrant-wise count rates Data is divided into 100 sec bins |
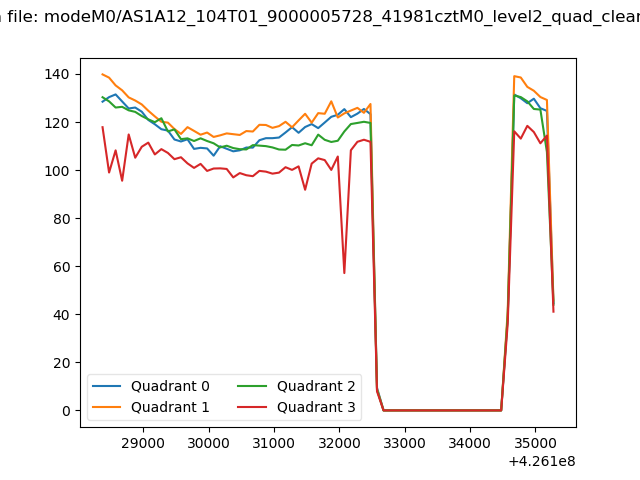 |
|
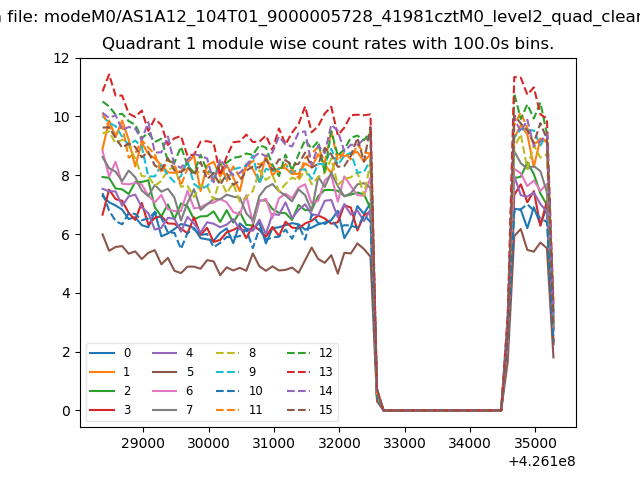
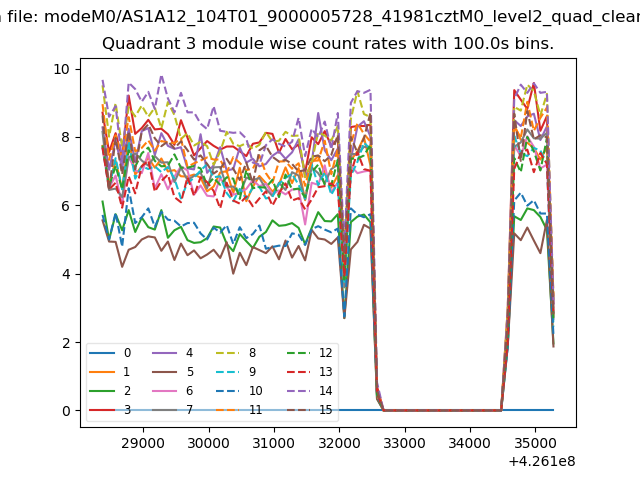
| Module-wise count rates for Quadrant A Data is divided into 100 sec bins |
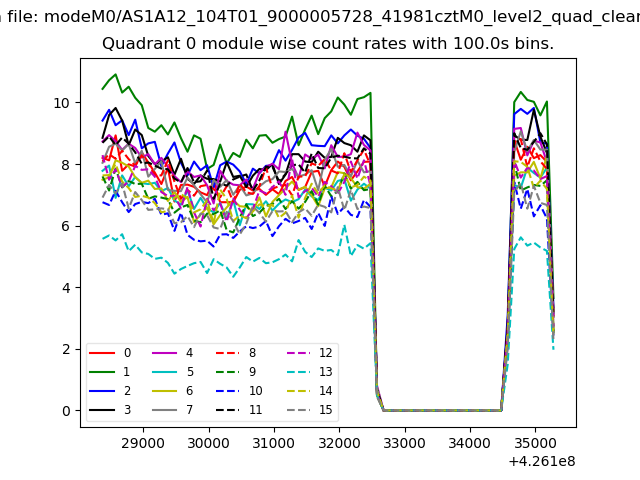 |
 |
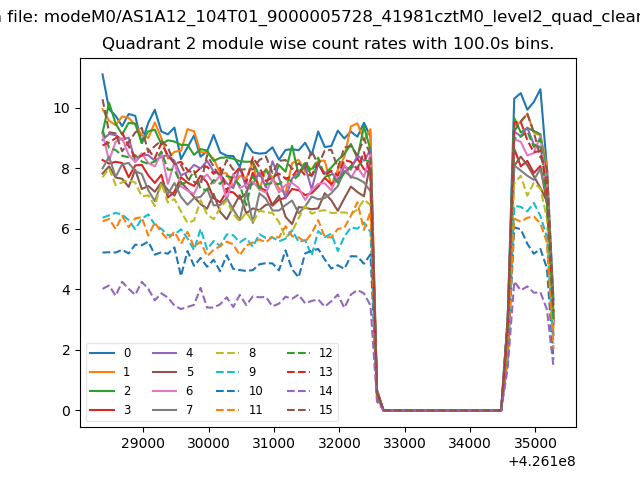
| Module-wise count rates for Quadrant B Data is divided into 100 sec bins |
 |
 |
| Module-wise count rates for Quadrant C Data is divided into 100 sec bins |
 |
 |
| Module-wise count rates for Quadrant D Data is divided into 100 sec bins |
 |
 |
| Parameter | Plot |
|---|---|
| CZT HV Monitor | 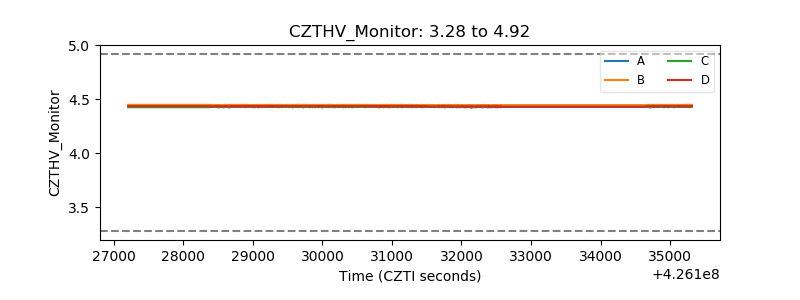 |
| D_VDD |  |
| Temperature 1 | 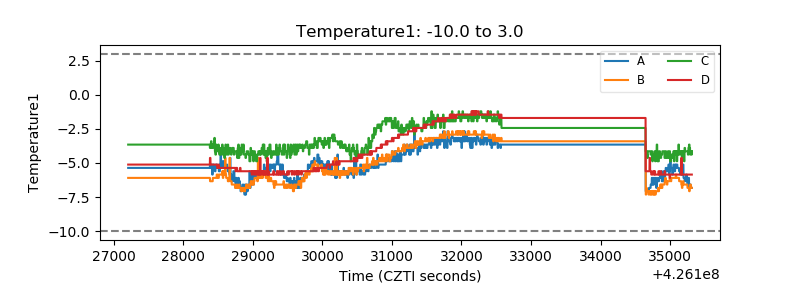 |
| Veto HV Monitor |  |
| Veto LLD | 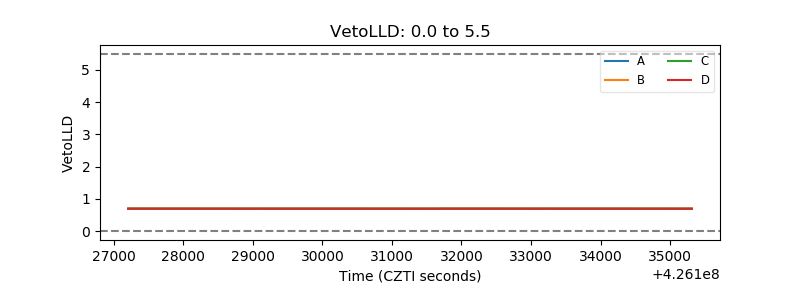 |
| Alpha Counter | 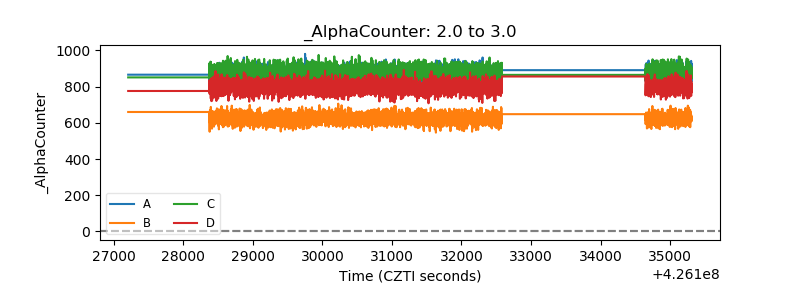 |
| _CPM_Rate | 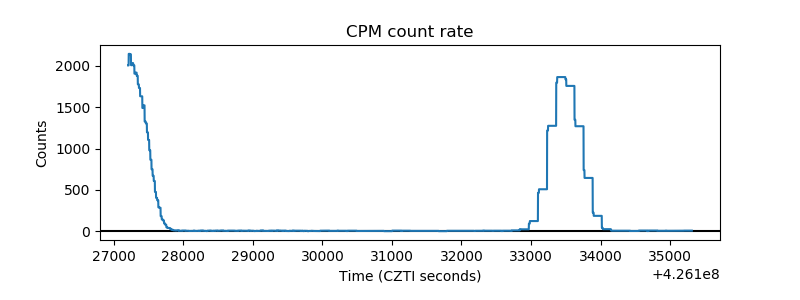 |
| CZT Counter | 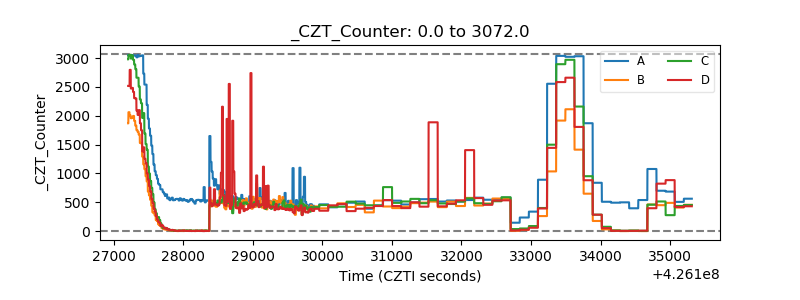 |
| +2.5 Volts monitor | 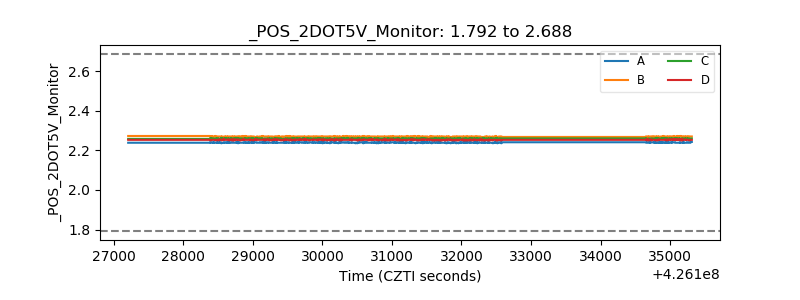 |
| +5 Volts monitor | 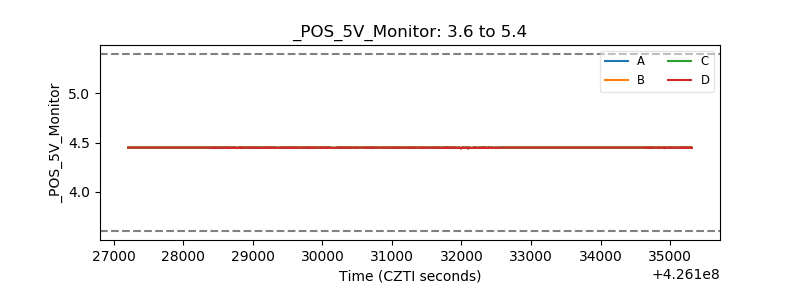 |
| _ROLL_ROT | 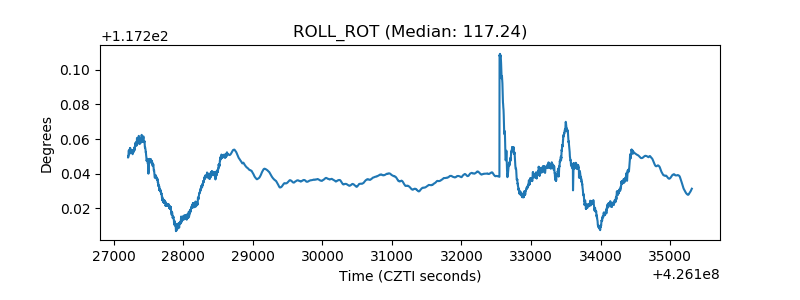 |
| _Roll_DEC | 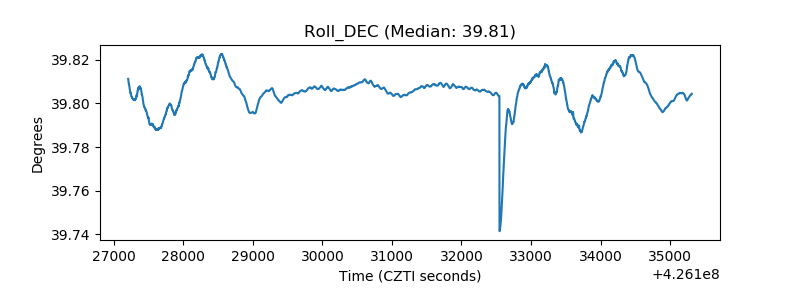 |
| _Roll_RA | 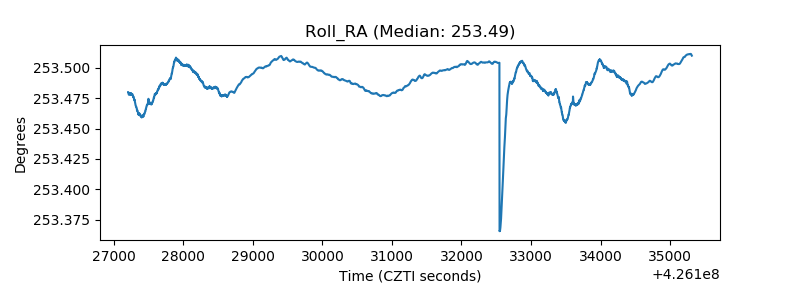 |
| Veto Counter | 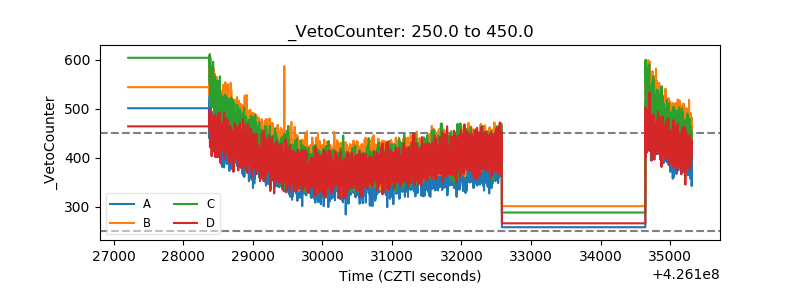 |