| Param | Original file | Final file |
|---|---|---|
| Filename | modeM0/AS1A12_104T01_9000005728_41983cztM0_level2.fits | modeM0/AS1A12_104T01_9000005728_41983cztM0_level2_quad_clean.evt |
| Size (bytes) | 311,120,640 | 85,118,400 |
| Size | 296.7 MB | 81.2 MB |
| Events in quadrant A | 3,026,582 | 576,319 |
| Events in quadrant B | 2,324,458 | 598,593 |
| Events in quadrant C | 2,360,325 | 564,034 |
| Events in quadrant D | 3,419,579 | 491,564 |
| Mode SS | |||
|---|---|---|---|
| Quadrant | BADHDUFLAG | Total packets | Discarded packets |
| A | 0 | 102 | 0 |
| B | 0 | 102 | 0 |
| C | 0 | 102 | 0 |
| D | 0 | 102 | 0 |
| Mode M0 | |||
|---|---|---|---|
| Quadrant | BADHDUFLAG | Total packets | Discarded packets |
| A | 0 | 12047 | 3 |
| B | 0 | 10181 | 2 |
| C | 0 | 10003 | 2 |
| D | 0 | 13754 | 2 |
| Mode M9 | |||
|---|---|---|---|
| Quadrant | BADHDUFLAG | Total packets | Discarded packets |
| A | 0 | 36 | 0 |
| B | 0 | 36 | 0 |
| C | 0 | 36 | 0 |
| D | 0 | 37 | 0 |
| Quadrant | Total seconds | Saturated seconds | Saturation percentage |
|---|---|---|---|
| A | 4945 | 12 | 0.242669% |
| B | 4945 | 10 | 0.202224% |
| C | 4945 | 3 | 0.060667% |
| D | 4945 | 338 | 6.835187% |
Noise dominated data is calculated using 1-second bins in cleaned event files. If a bin has >2000 counts, and if more than 50% of those come from <1% of pixels, then it is considered to be noise-dominated and hence unusable.
| Quadrant | # 1 sec bins | Bins with >0 counts | Bins with >2000 counts | High rate bins dominated by noise | Noise dominated (total time) | Noise dominated (detector-on time) | Marked lightcurve |
|---|---|---|---|---|---|---|---|
| A | 7068 | 4946 | 9 | 9 | 0.13% | 0.18% | 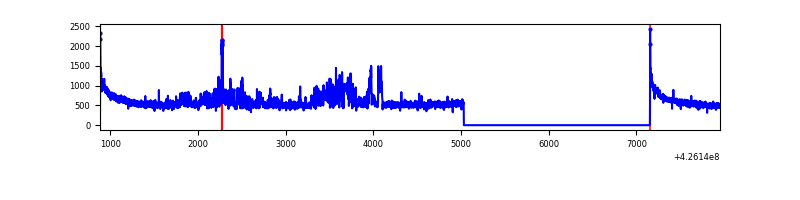 |
| B | 7068 | 4946 | 2 | 2 | 0.03% | 0.04% | 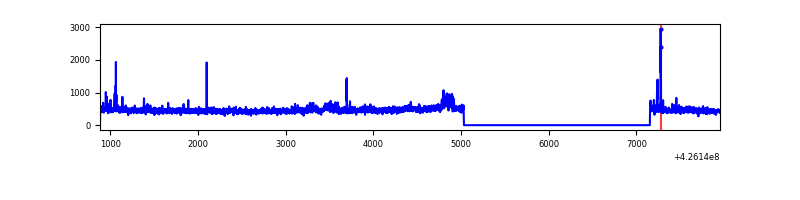 |
| C | 7068 | 4946 | 0 | 0 | 0.00% | 0.00% | 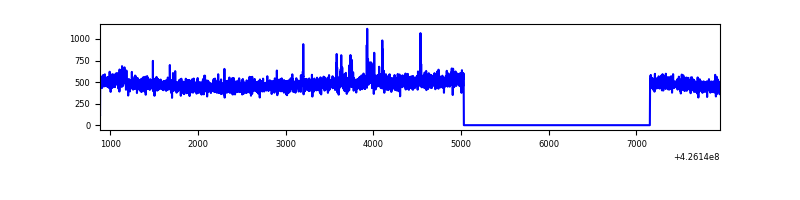 |
| D | 7068 | 4946 | 260 | 260 | 3.68% | 5.26% | 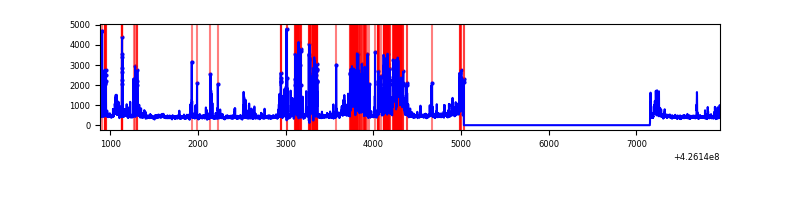 |
Top three noisy pixels from each quadrant. If the there are fewer than three noisy pixels in the level2.evt file, extra rows are filled as -1
| Pixel properties | Quadrant properties | ||||||
|---|---|---|---|---|---|---|---|
| Quadrant | DetID | PixID | Counts | Sigma | Mean | Median | Sigma |
| A | 10 | 83 | 501419 | 4403.6 | 558 | 547 | 113.7 |
| A | 2 | 79 | 362933 | 3186.05 | 558 | 547 | 113.7 |
| A | 3 | 137 | 6031 | 48.21 | 558 | 547 | 113.7 |
| B | 0 | 156 | 46545 | 429.03 | 553 | 536 | 107.2 |
| B | 0 | 190 | 32896 | 301.75 | 553 | 536 | 107.2 |
| B | 4 | 81 | 30085 | 275.54 | 553 | 536 | 107.2 |
| C | 15 | 214 | 206238 | 1634.87 | 541 | 546 | 125.8 |
| C | 8 | 79 | 38409 | 300.94 | 541 | 546 | 125.8 |
| C | 15 | 111 | 5934 | 42.82 | 541 | 546 | 125.8 |
| D | 2 | 249 | 768251 | 6081.74 | 522 | 510 | 126.2 |
| D | 13 | 249 | 460719 | 3645.6 | 522 | 510 | 126.2 |
| D | 12 | 6 | 117346 | 925.53 | 522 | 510 | 126.2 |
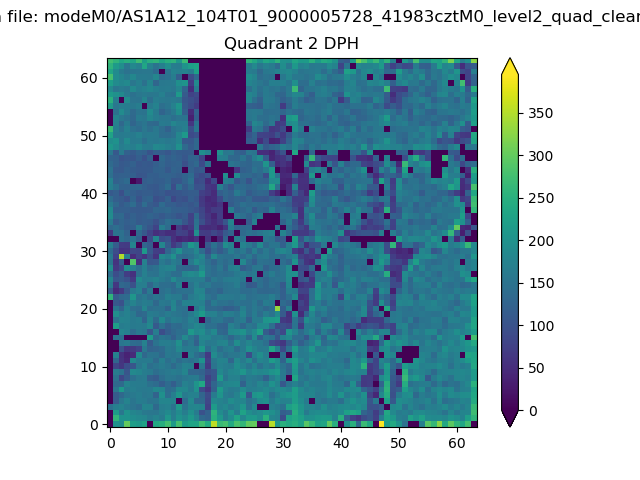
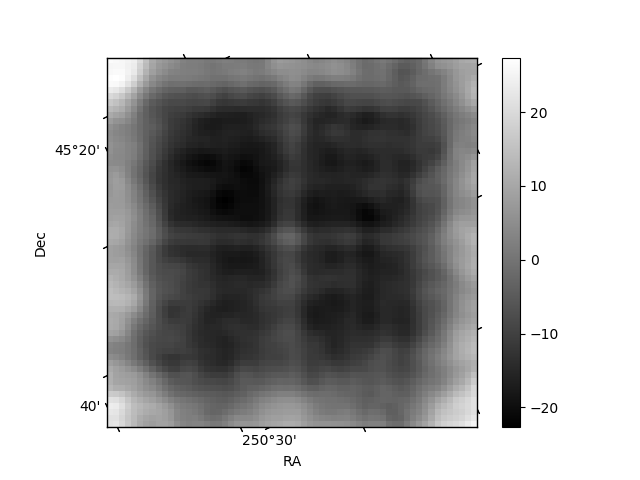
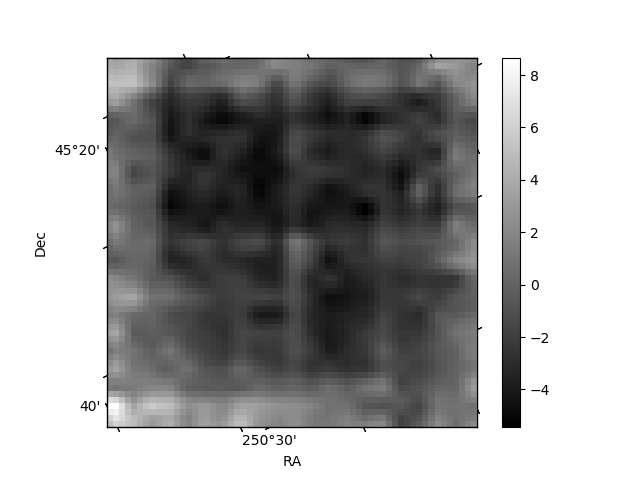
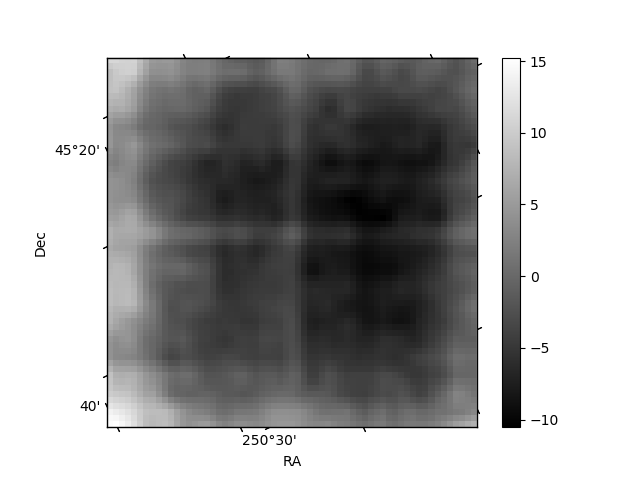
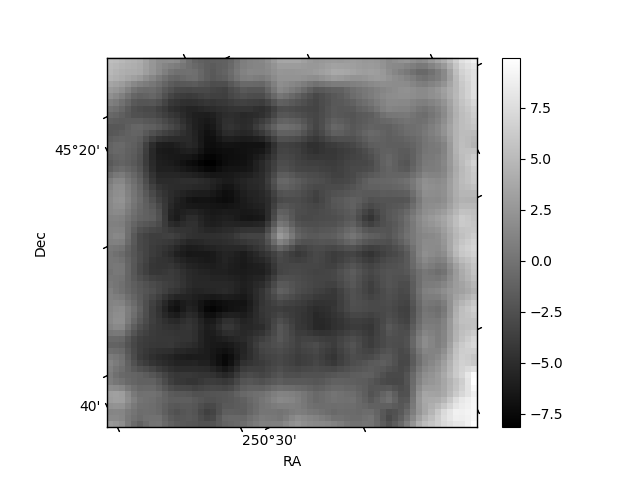
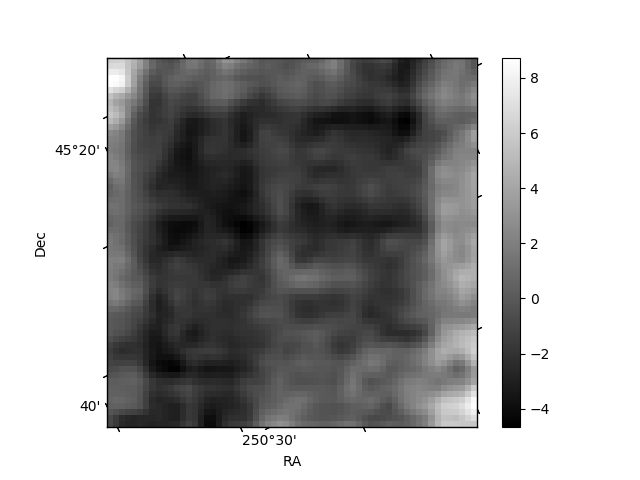
Histogram calculated using DETX and DETY for each event in the final _common_clean file
| Quadrant A |  |
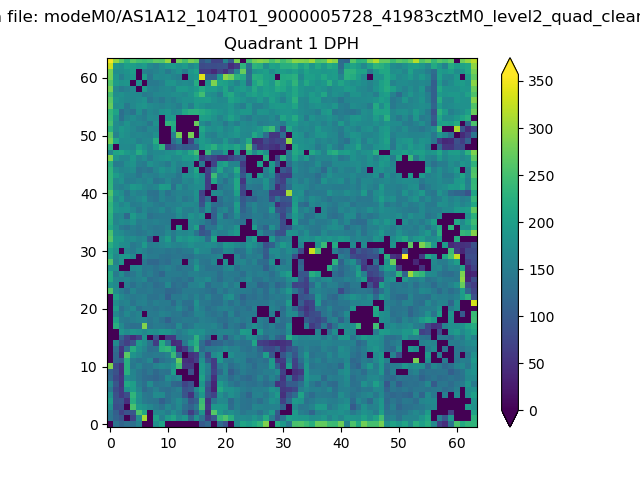 |
Quadrant B |
|---|---|---|---|
| Quadrant D | 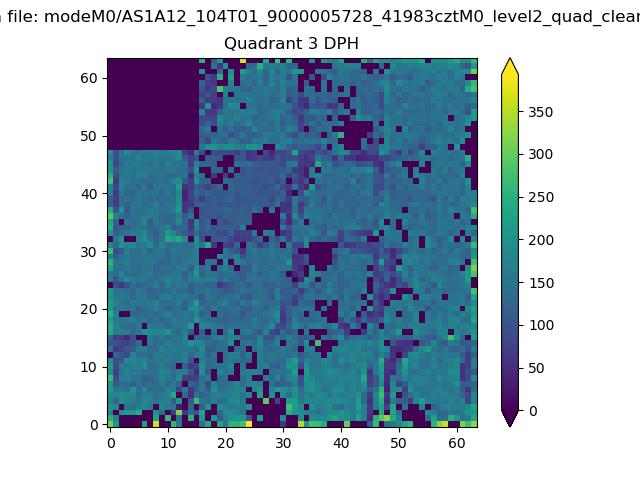 |
 |
Quadrant C |
| Plot type | Count rate plots | Images |
|---|---|---|
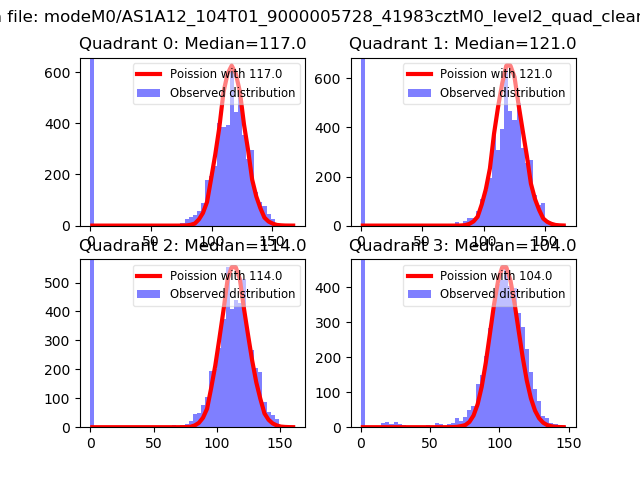
| Comparison with Poisson distribution Blue bars denote a histogram of data divided into 1 sec bins. Red curve is a Poisson curve with rate = median count rate of data. |
 |
 |
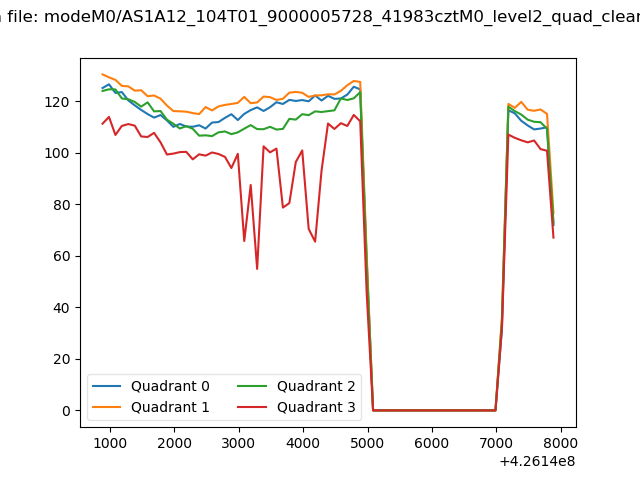
| Quadrant-wise count rates Data is divided into 100 sec bins |
 |
|
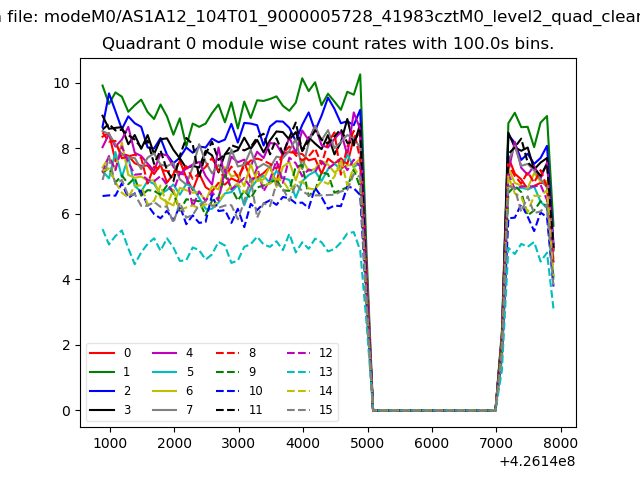
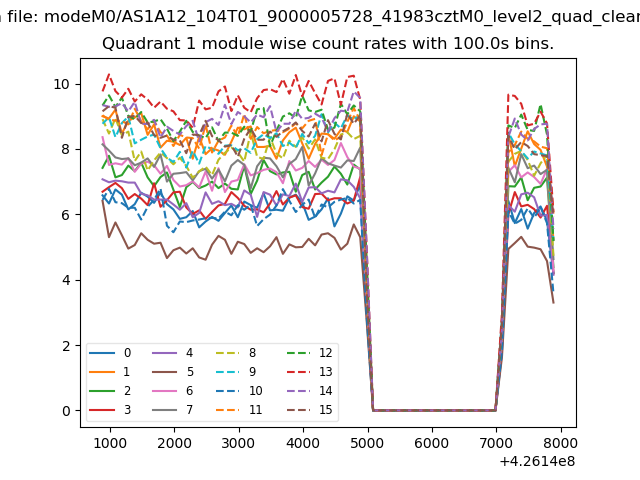
| Module-wise count rates for Quadrant A Data is divided into 100 sec bins |
 |
 |
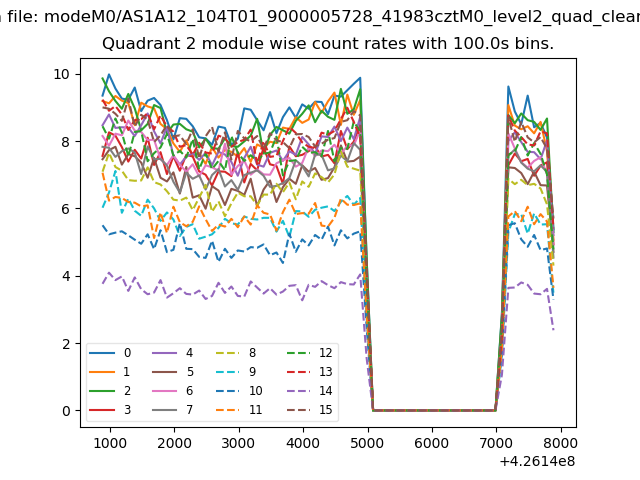
| Module-wise count rates for Quadrant B Data is divided into 100 sec bins |
 |
 |
| Module-wise count rates for Quadrant C Data is divided into 100 sec bins |
 |
 |
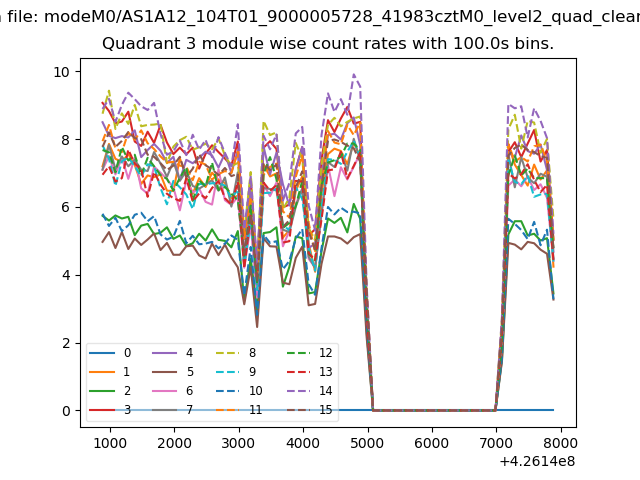
| Module-wise count rates for Quadrant D Data is divided into 100 sec bins |
 |
 |
| Parameter | Plot |
|---|---|
| CZT HV Monitor | 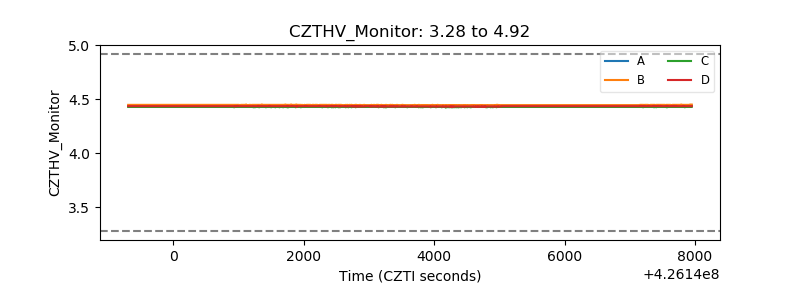 |
| D_VDD | 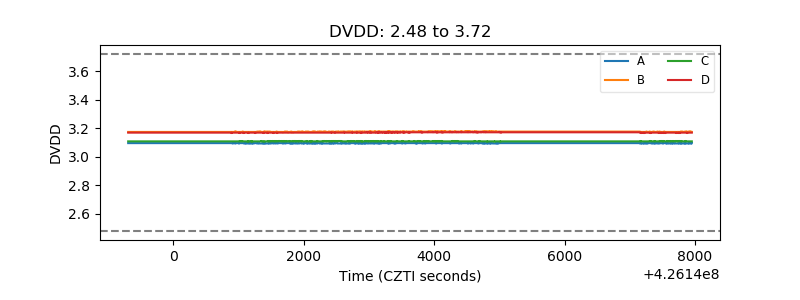 |
| Temperature 1 | 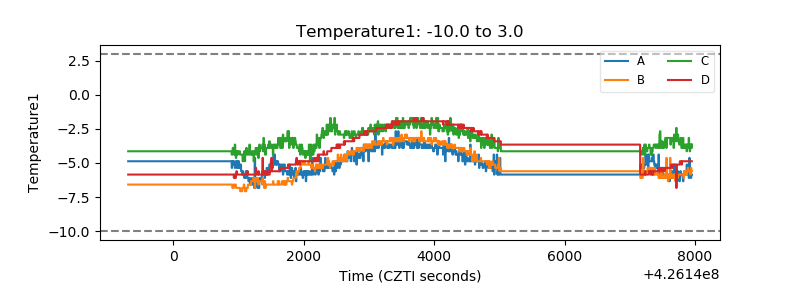 |
| Veto HV Monitor | 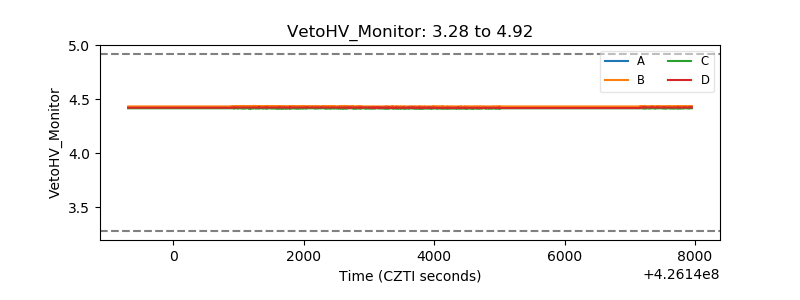 |
| Veto LLD | 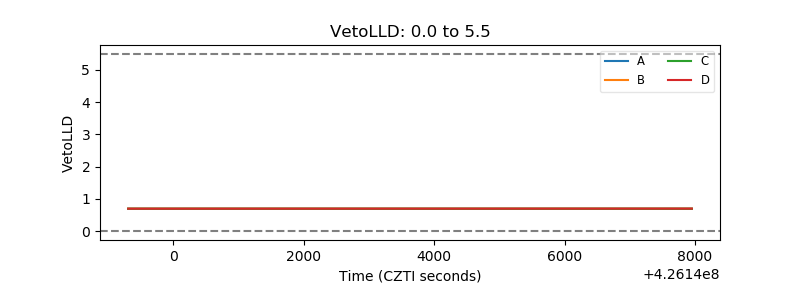 |
| Alpha Counter | 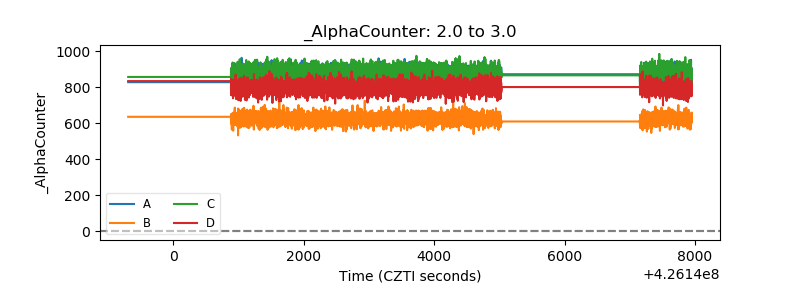 |
| _CPM_Rate | 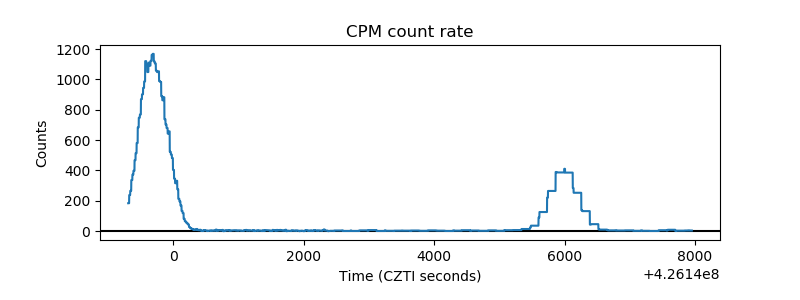 |
| CZT Counter | 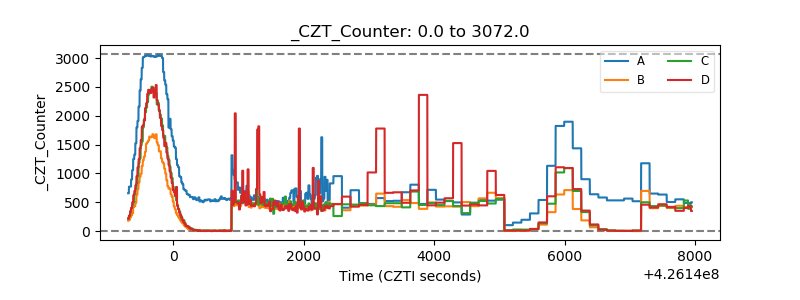 |
| +2.5 Volts monitor | 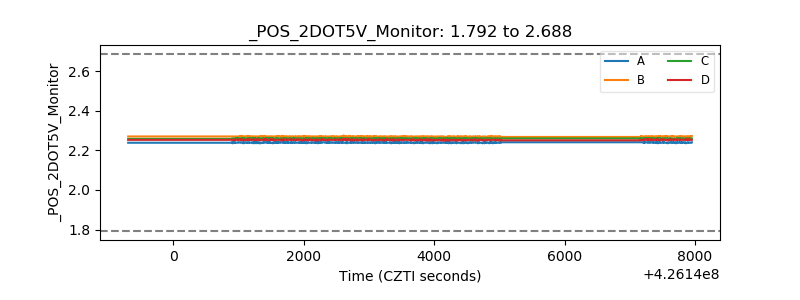 |
| +5 Volts monitor | 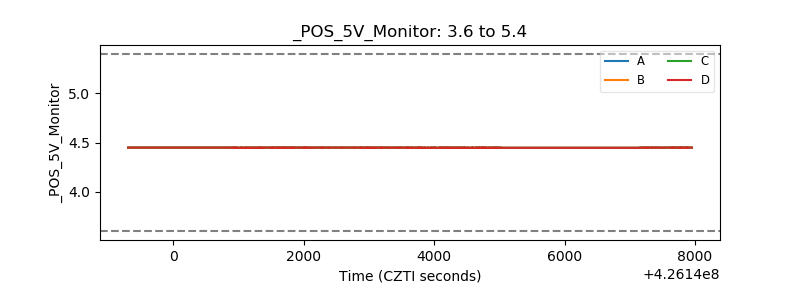 |
| _ROLL_ROT | 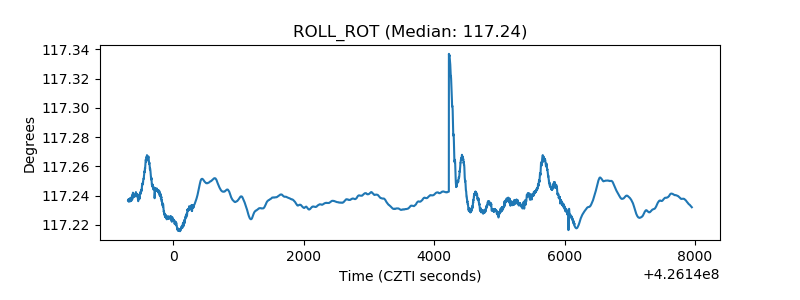 |
| _Roll_DEC | 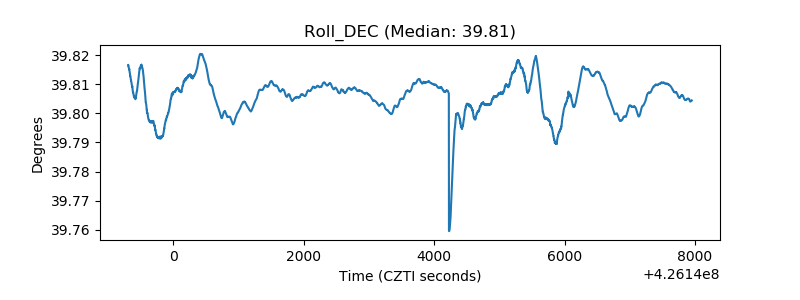 |
| _Roll_RA | 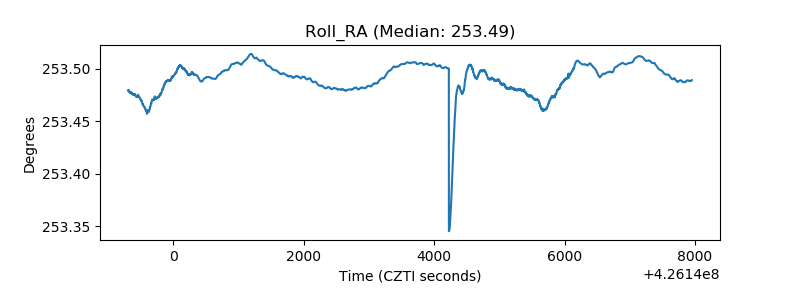 |
| Veto Counter | 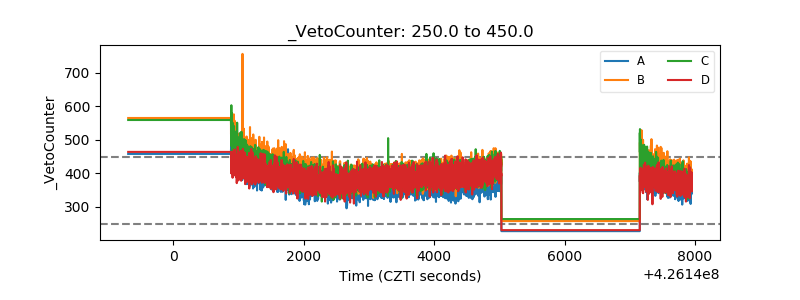 |