| Param | Original file | Final file |
|---|---|---|
| Filename | modeM0/AS1A12_104T01_9000005728_41985cztM0_level2.fits | modeM0/AS1A12_104T01_9000005728_41985cztM0_level2_quad_clean.evt |
| Size (bytes) | 310,754,880 | 89,588,160 |
| Size | 296.4 MB | 85.4 MB |
| Events in quadrant A | 2,864,303 | 601,392 |
| Events in quadrant B | 2,501,454 | 619,277 |
| Events in quadrant C | 2,510,067 | 584,386 |
| Events in quadrant D | 3,200,659 | 525,158 |
| Mode SS | |||
|---|---|---|---|
| Quadrant | BADHDUFLAG | Total packets | Discarded packets |
| A | 0 | 110 | 0 |
| B | 0 | 110 | 0 |
| C | 0 | 110 | 0 |
| D | 0 | 110 | 0 |
| Mode M0 | |||
|---|---|---|---|
| Quadrant | BADHDUFLAG | Total packets | Discarded packets |
| A | 0 | 11744 | 3 |
| B | 0 | 11186 | 2 |
| C | 0 | 10987 | 2 |
| D | 0 | 13428 | 2 |
| Mode M9 | |||
|---|---|---|---|
| Quadrant | BADHDUFLAG | Total packets | Discarded packets |
| A | 0 | 32 | 0 |
| B | 0 | 32 | 0 |
| C | 0 | 32 | 0 |
| D | 0 | 33 | 0 |
| Quadrant | Total seconds | Saturated seconds | Saturation percentage |
|---|---|---|---|
| A | 5471 | 13 | 0.237617% |
| B | 5471 | 14 | 0.255895% |
| C | 5471 | 2 | 0.036556% |
| D | 5471 | 199 | 3.637361% |
Noise dominated data is calculated using 1-second bins in cleaned event files. If a bin has >2000 counts, and if more than 50% of those come from <1% of pixels, then it is considered to be noise-dominated and hence unusable.
| Quadrant | # 1 sec bins | Bins with >0 counts | Bins with >2000 counts | High rate bins dominated by noise | Noise dominated (total time) | Noise dominated (detector-on time) | Marked lightcurve |
|---|---|---|---|---|---|---|---|
| A | 7174 | 5472 | 5 | 5 | 0.07% | 0.09% | 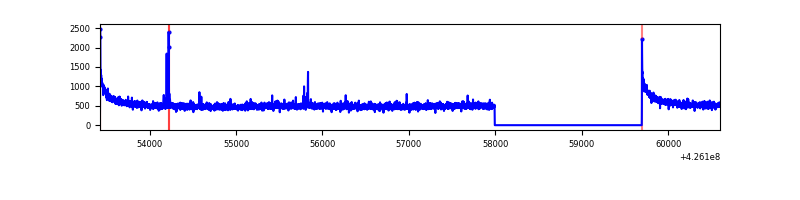 |
| B | 7174 | 5472 | 3 | 3 | 0.04% | 0.05% | 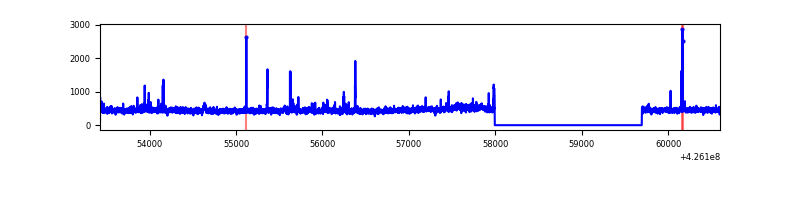 |
| C | 7174 | 5472 | 0 | 0 | 0.00% | 0.00% | 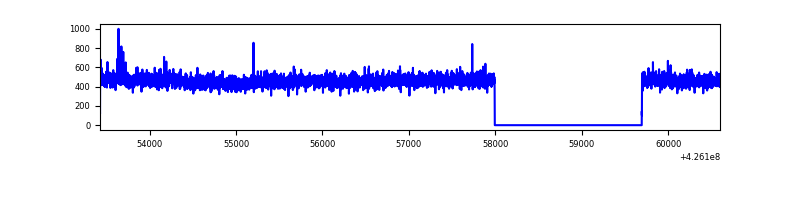 |
| D | 7174 | 5472 | 158 | 158 | 2.20% | 2.89% | 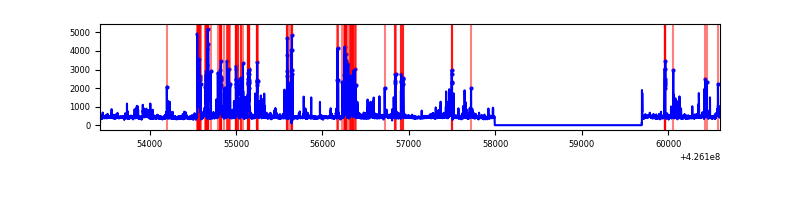 |
Top three noisy pixels from each quadrant. If the there are fewer than three noisy pixels in the level2.evt file, extra rows are filled as -1
| Pixel properties | Quadrant properties | ||||||
|---|---|---|---|---|---|---|---|
| Quadrant | DetID | PixID | Counts | Sigma | Mean | Median | Sigma |
| A | 10 | 83 | 525050 | 4280.54 | 598 | 587 | 122.5 |
| A | 2 | 79 | 21606 | 171.55 | 598 | 587 | 122.5 |
| A | 15 | 223 | 9115 | 69.6 | 598 | 587 | 122.5 |
| B | 0 | 190 | 86764 | 749.18 | 590 | 573 | 115.0 |
| B | 0 | 156 | 50950 | 437.88 | 590 | 573 | 115.0 |
| B | 3 | 112 | 24443 | 207.48 | 590 | 573 | 115.0 |
| C | 15 | 214 | 226350 | 1668.7 | 580 | 583 | 135.3 |
| C | 9 | 54 | 21076 | 151.47 | 580 | 583 | 135.3 |
| C | 13 | 61 | 3792 | 23.72 | 580 | 583 | 135.3 |
| D | 13 | 249 | 423456 | 2987.8 | 572 | 555 | 141.5 |
| D | 12 | 250 | 160207 | 1127.94 | 572 | 555 | 141.5 |
| D | 1 | 52 | 145505 | 1024.07 | 572 | 555 | 141.5 |
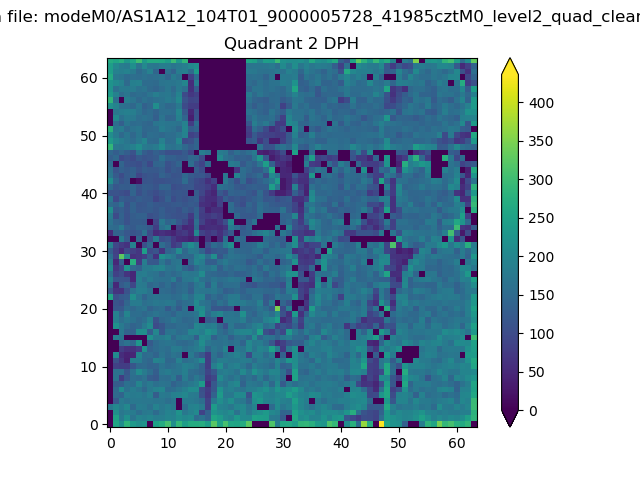
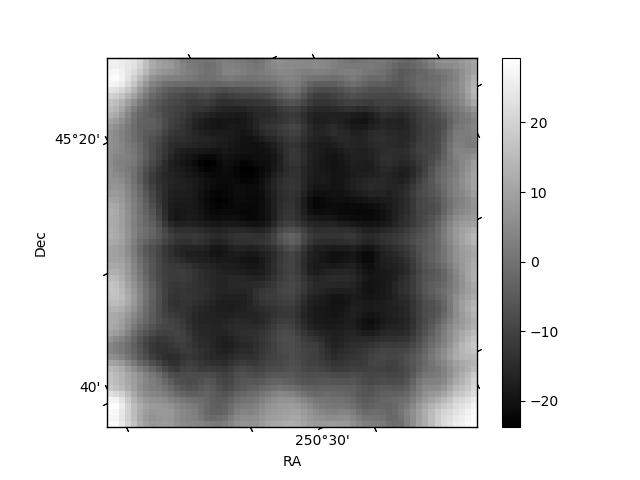
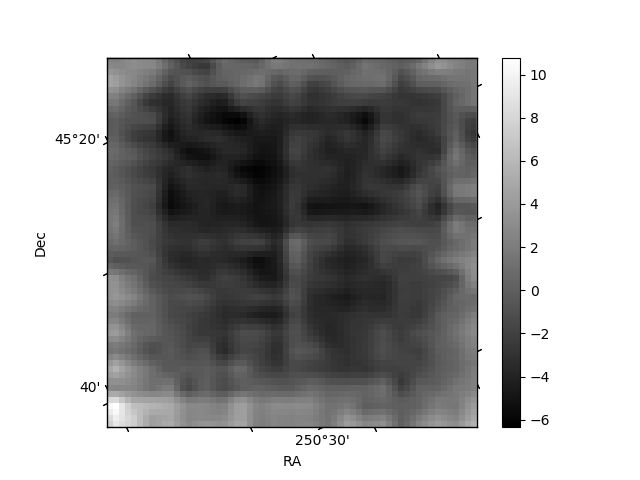
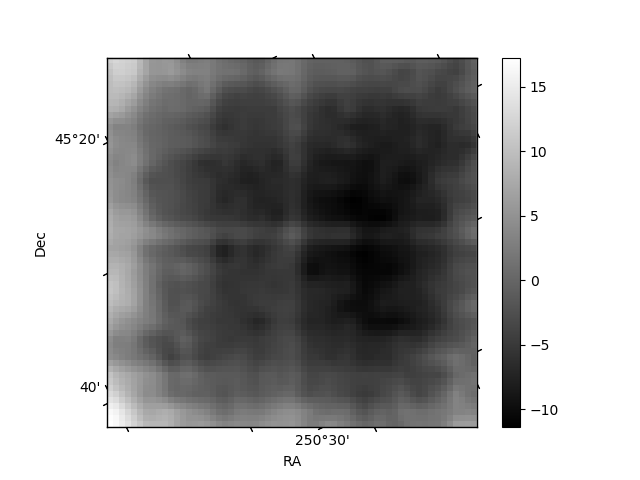
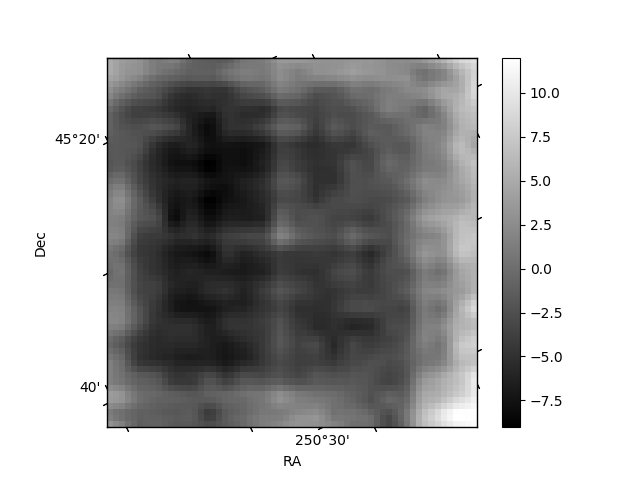
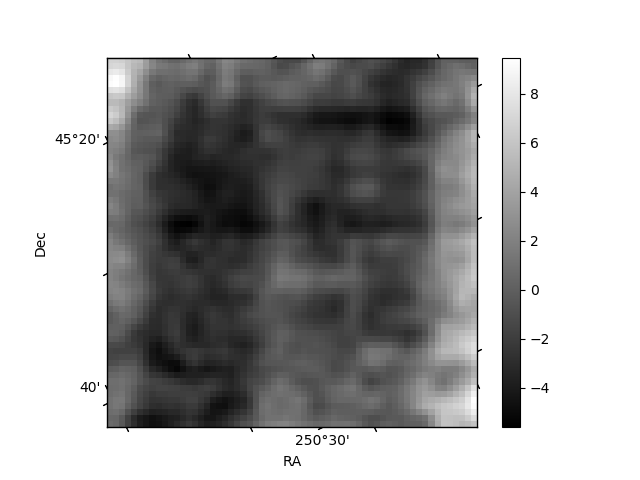
Histogram calculated using DETX and DETY for each event in the final _common_clean file
| Quadrant A | 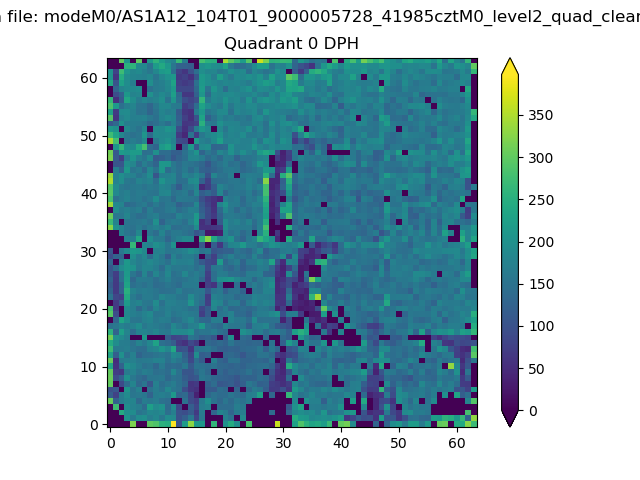 |
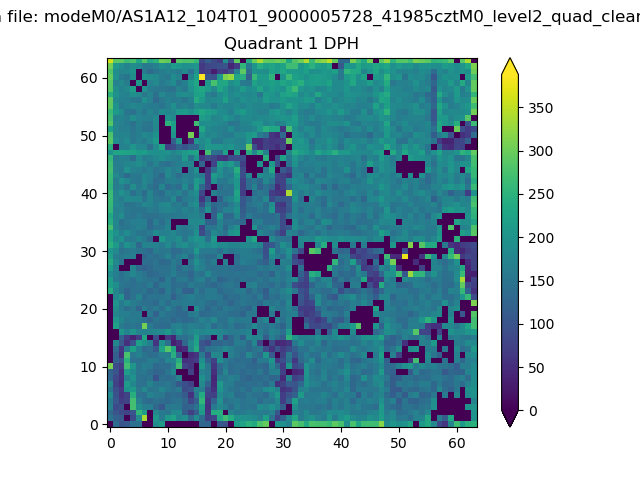 |
Quadrant B |
|---|---|---|---|
| Quadrant D | 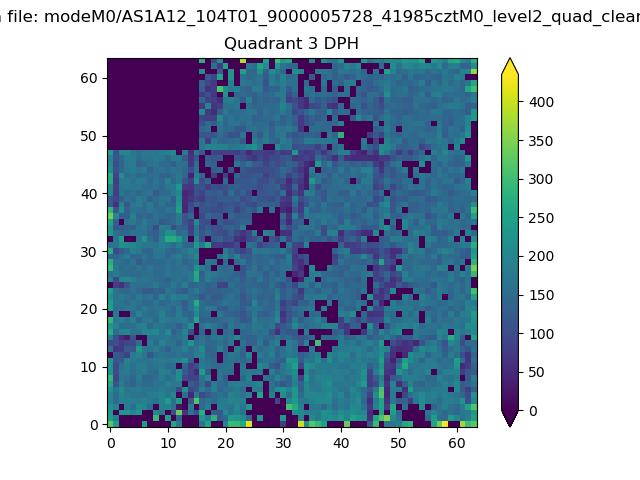 |
 |
Quadrant C |
| Plot type | Count rate plots | Images |
|---|---|---|
| Comparison with Poisson distribution Blue bars denote a histogram of data divided into 1 sec bins. Red curve is a Poisson curve with rate = median count rate of data. |
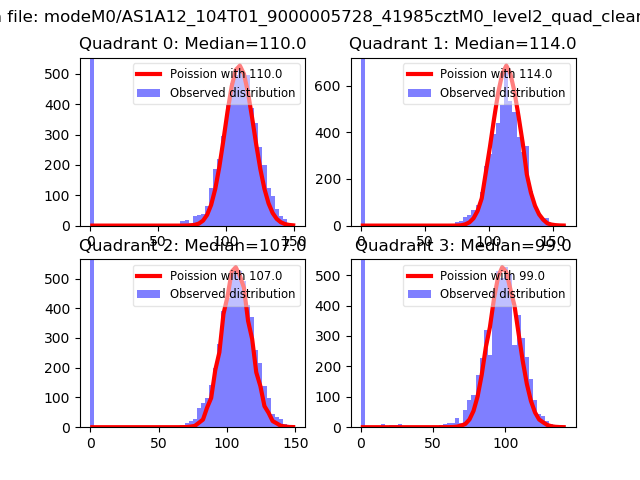 |
 |
| Quadrant-wise count rates Data is divided into 100 sec bins |
 |
|
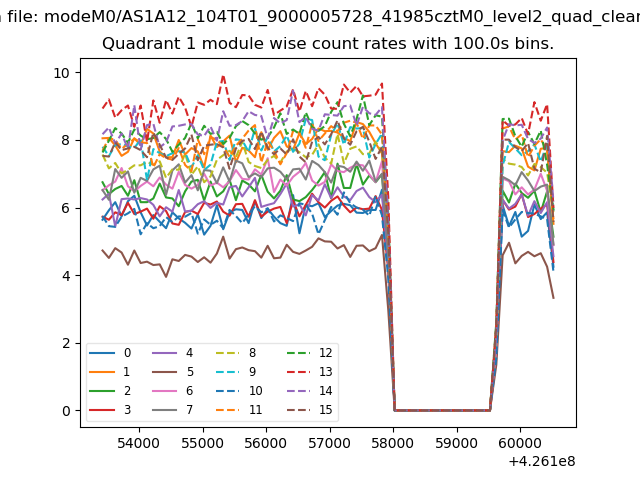
| Module-wise count rates for Quadrant A Data is divided into 100 sec bins |
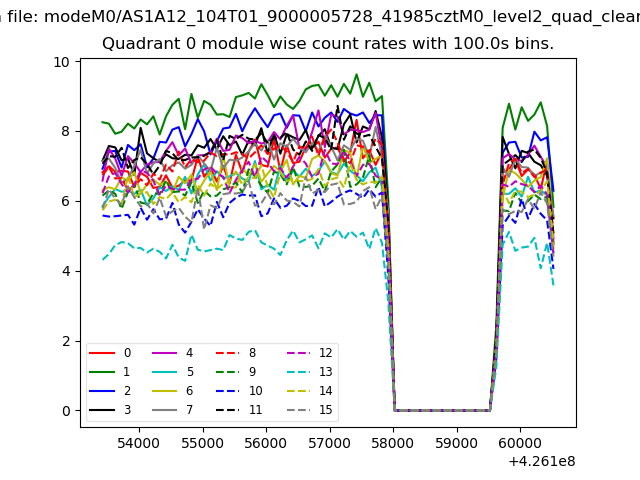 |
 |
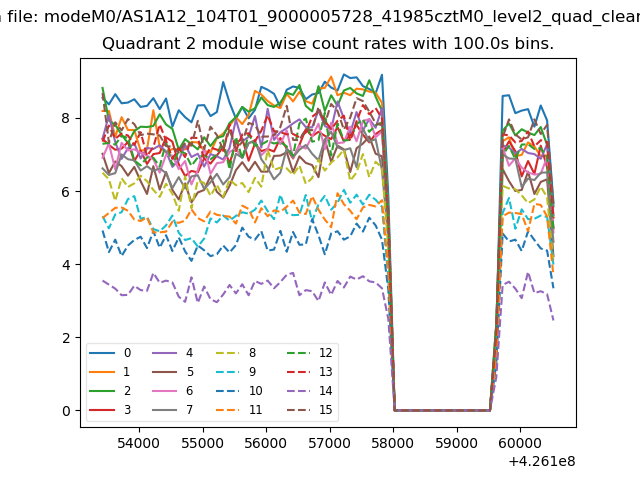
| Module-wise count rates for Quadrant B Data is divided into 100 sec bins |
 |
 |
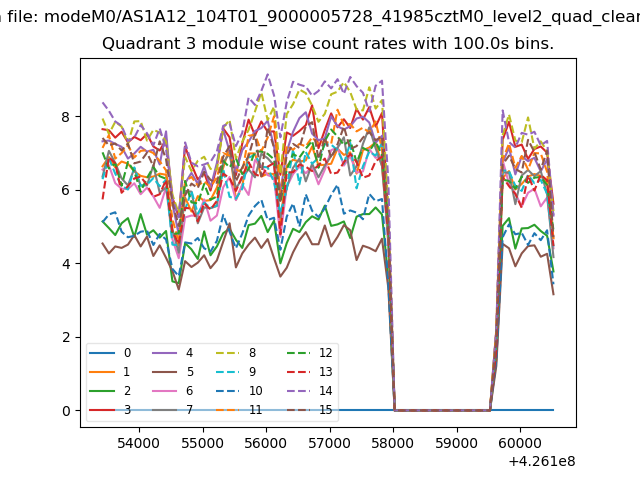
| Module-wise count rates for Quadrant C Data is divided into 100 sec bins |
 |
 |
| Module-wise count rates for Quadrant D Data is divided into 100 sec bins |
 |
 |
| Parameter | Plot |
|---|---|
| CZT HV Monitor |  |
| D_VDD |  |
| Temperature 1 | 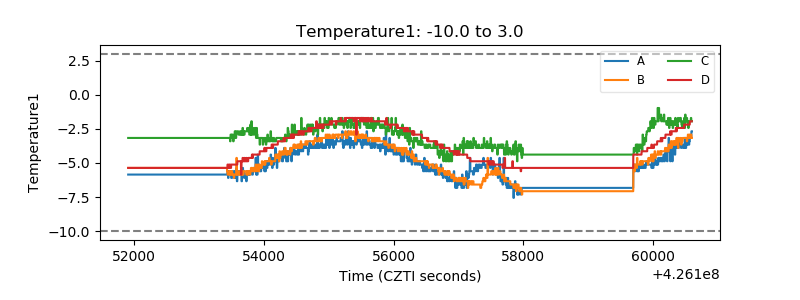 |
| Veto HV Monitor | 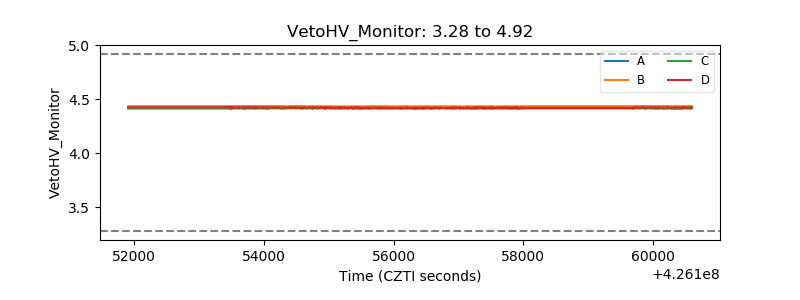 |
| Veto LLD | 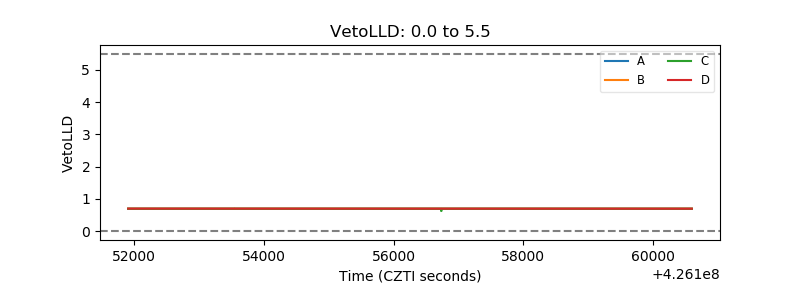 |
| Alpha Counter | 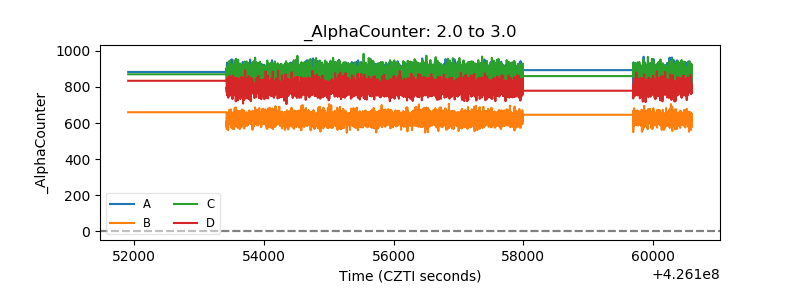 |
| _CPM_Rate | 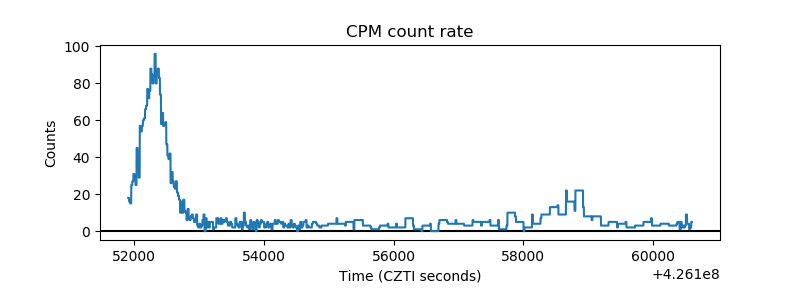 |
| CZT Counter | 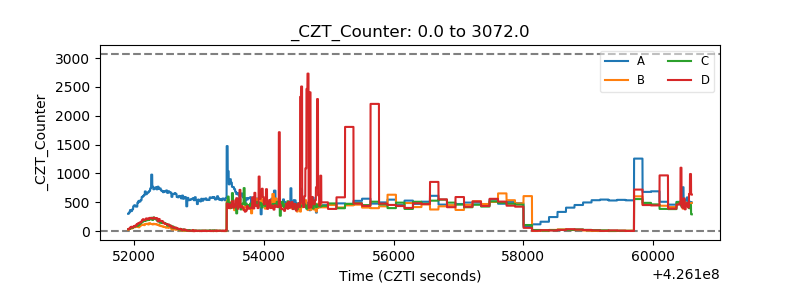 |
| +2.5 Volts monitor | 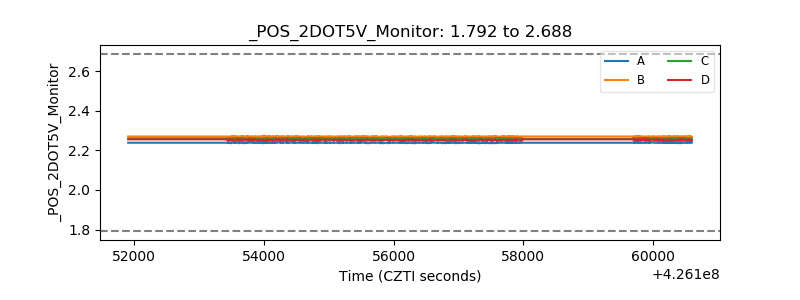 |
| +5 Volts monitor | 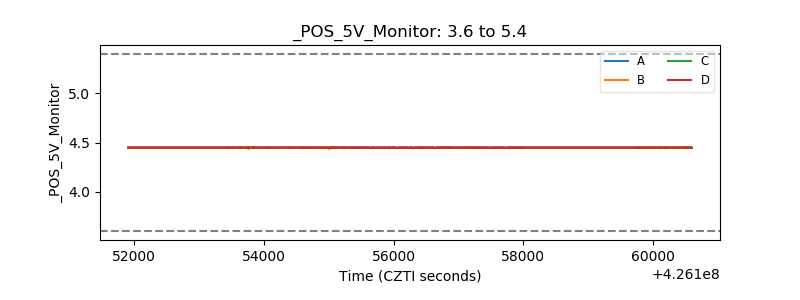 |
| _ROLL_ROT | 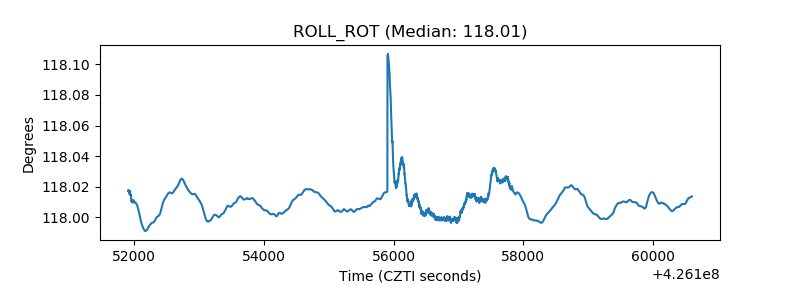 |
| _Roll_DEC | 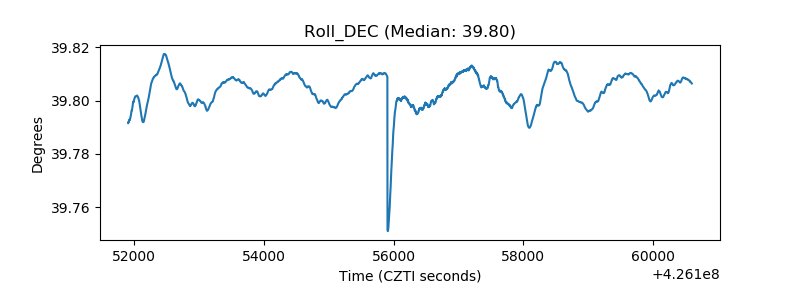 |
| _Roll_RA | 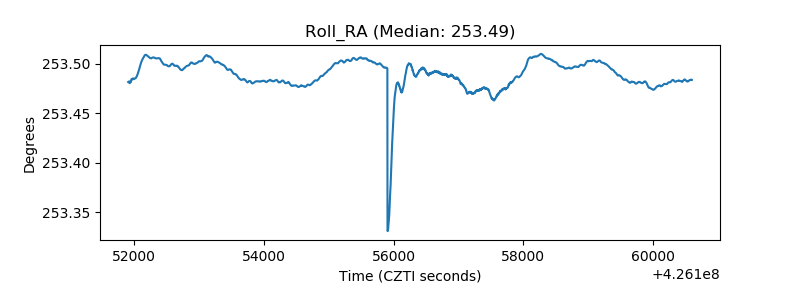 |
| Veto Counter | 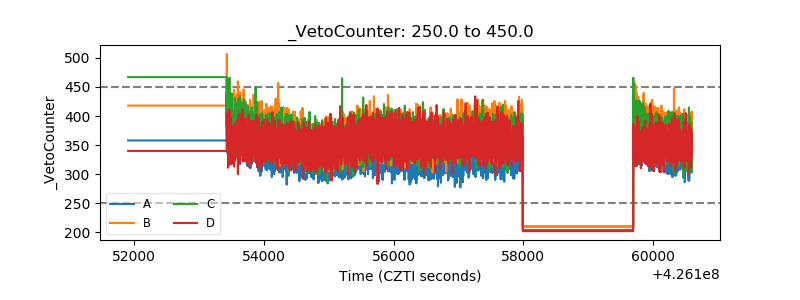 |