| Param | Original file | Final file |
|---|---|---|
| Filename | modeM0/AS1A12_104T01_9000005728_41986cztM0_level2.fits | modeM0/AS1A12_104T01_9000005728_41986cztM0_level2_quad_clean.evt |
| Size (bytes) | 367,332,480 | 100,687,680 |
| Size | 350.3 MB | 96.0 MB |
| Events in quadrant A | 3,208,732 | 677,789 |
| Events in quadrant B | 3,038,888 | 687,612 |
| Events in quadrant C | 2,820,580 | 658,066 |
| Events in quadrant D | 4,048,447 | 593,845 |
| Mode SS | |||
|---|---|---|---|
| Quadrant | BADHDUFLAG | Total packets | Discarded packets |
| A | 0 | 128 | 0 |
| B | 0 | 128 | 0 |
| C | 0 | 128 | 0 |
| D | 0 | 128 | 0 |
| Mode M0 | |||
|---|---|---|---|
| Quadrant | BADHDUFLAG | Total packets | Discarded packets |
| A | 0 | 13185 | 3 |
| B | 0 | 13244 | 2 |
| C | 0 | 12383 | 2 |
| D | 0 | 16343 | 2 |
| Mode M9 | |||
|---|---|---|---|
| Quadrant | BADHDUFLAG | Total packets | Discarded packets |
| A | 0 | 31 | 0 |
| B | 0 | 31 | 0 |
| C | 0 | 31 | 0 |
| D | 0 | 31 | 0 |
| Quadrant | Total seconds | Saturated seconds | Saturation percentage |
|---|---|---|---|
| A | 6177 | 13 | 0.210458% |
| B | 6177 | 61 | 0.987534% |
| C | 6177 | 4 | 0.064756% |
| D | 6177 | 221 | 3.577789% |
Noise dominated data is calculated using 1-second bins in cleaned event files. If a bin has >2000 counts, and if more than 50% of those come from <1% of pixels, then it is considered to be noise-dominated and hence unusable.
| Quadrant | # 1 sec bins | Bins with >0 counts | Bins with >2000 counts | High rate bins dominated by noise | Noise dominated (total time) | Noise dominated (detector-on time) | Marked lightcurve |
|---|---|---|---|---|---|---|---|
| A | 9313 | 6179 | 3 | 3 | 0.03% | 0.05% | 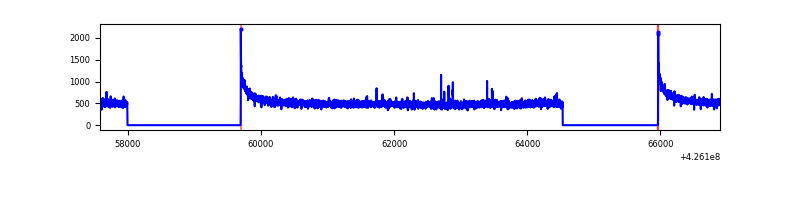 |
| B | 9313 | 6179 | 53 | 53 | 0.57% | 0.86% | 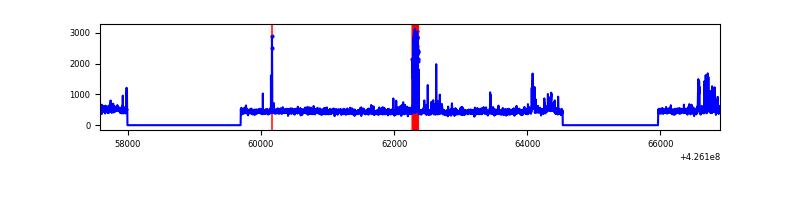 |
| C | 9313 | 6179 | 0 | 0 | 0.00% | 0.00% | 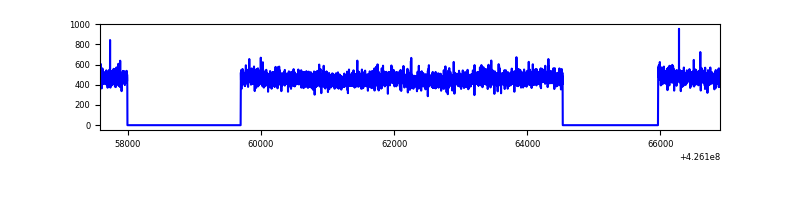 |
| D | 9313 | 6179 | 198 | 198 | 2.13% | 3.20% | 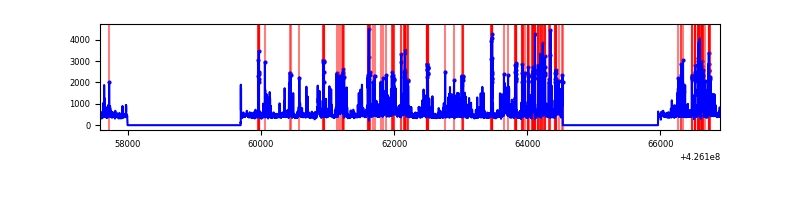 |
Top three noisy pixels from each quadrant. If the there are fewer than three noisy pixels in the level2.evt file, extra rows are filled as -1
| Pixel properties | Quadrant properties | ||||||
|---|---|---|---|---|---|---|---|
| Quadrant | DetID | PixID | Counts | Sigma | Mean | Median | Sigma |
| A | 10 | 83 | 584654 | 4214.15 | 673 | 658 | 138.6 |
| A | 15 | 223 | 13707 | 94.16 | 673 | 658 | 138.6 |
| A | 2 | 79 | 8718 | 58.16 | 673 | 658 | 138.6 |
| B | 3 | 112 | 161328 | 1243.05 | 665 | 646 | 129.3 |
| B | 4 | 81 | 96623 | 742.48 | 665 | 646 | 129.3 |
| B | 0 | 190 | 53493 | 408.83 | 665 | 646 | 129.3 |
| C | 15 | 214 | 256531 | 1663.25 | 657 | 660 | 153.8 |
| C | 3 | 233 | 4851 | 27.24 | 657 | 660 | 153.8 |
| C | 13 | 61 | 4342 | 23.93 | 657 | 660 | 153.8 |
| D | 2 | 249 | 563694 | 3527.66 | 648 | 631 | 159.6 |
| D | 13 | 249 | 460581 | 2881.64 | 648 | 631 | 159.6 |
| D | 12 | 6 | 130900 | 816.15 | 648 | 631 | 159.6 |
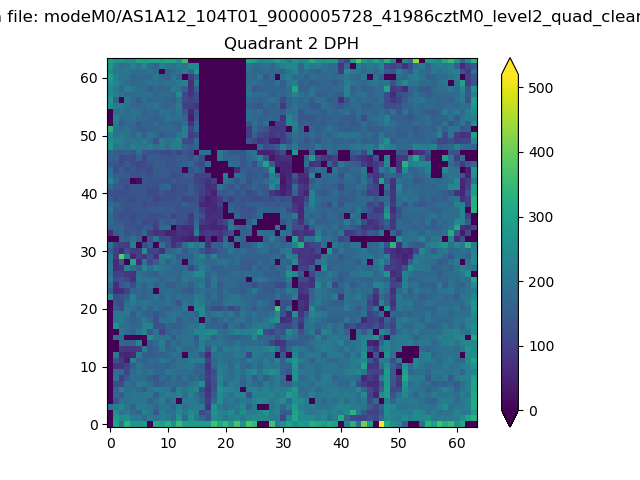
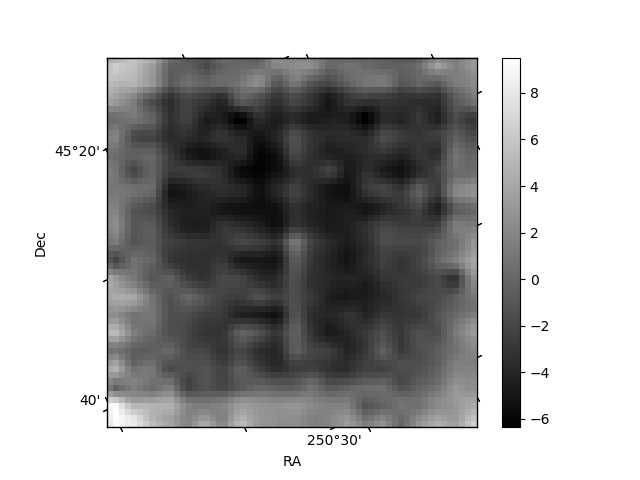
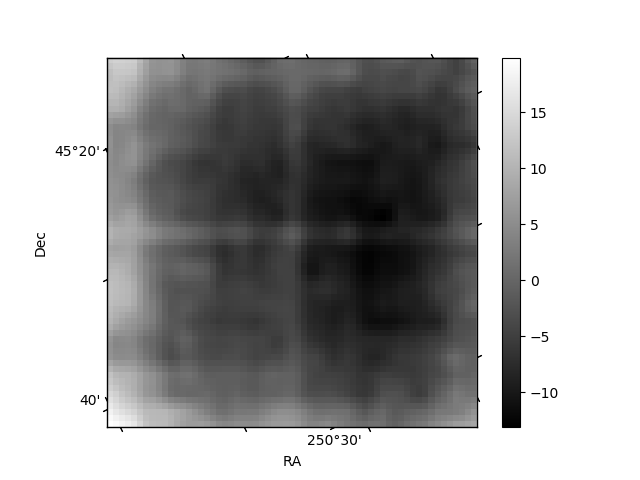
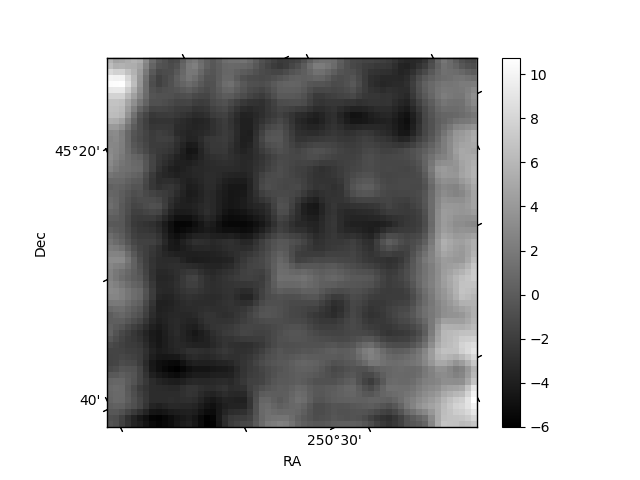
Histogram calculated using DETX and DETY for each event in the final _common_clean file
| Quadrant A |  |
 |
Quadrant B |
|---|---|---|---|
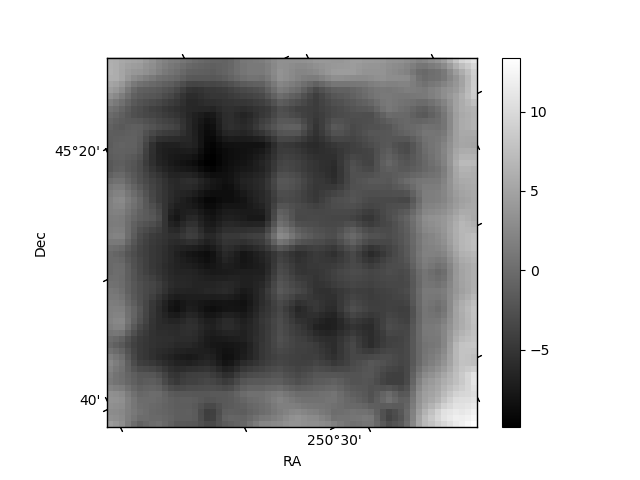
| Quadrant D | 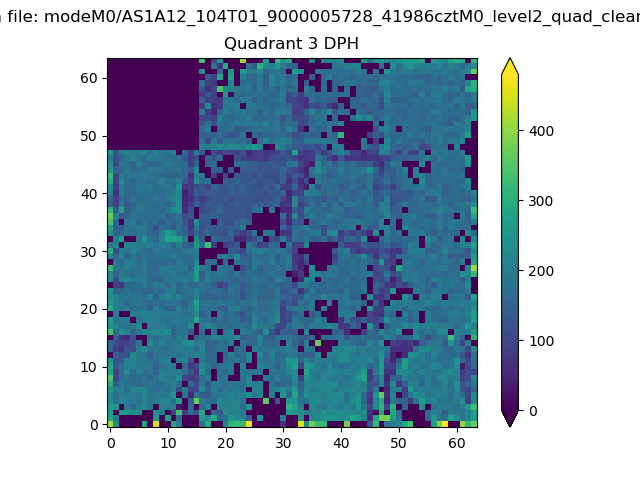 |
 |
Quadrant C |
| Plot type | Count rate plots | Images |
|---|---|---|
| Comparison with Poisson distribution Blue bars denote a histogram of data divided into 1 sec bins. Red curve is a Poisson curve with rate = median count rate of data. |
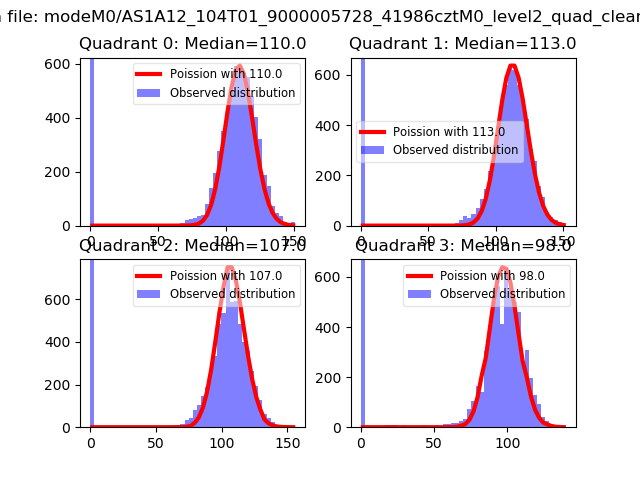 |
 |
| Quadrant-wise count rates Data is divided into 100 sec bins |
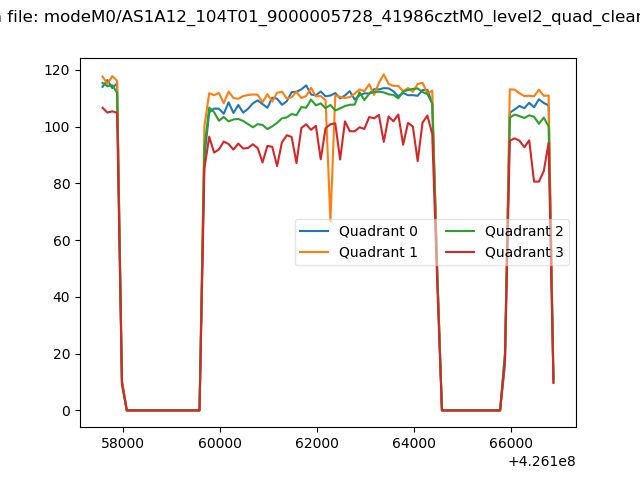 |
|
| Module-wise count rates for Quadrant A Data is divided into 100 sec bins |
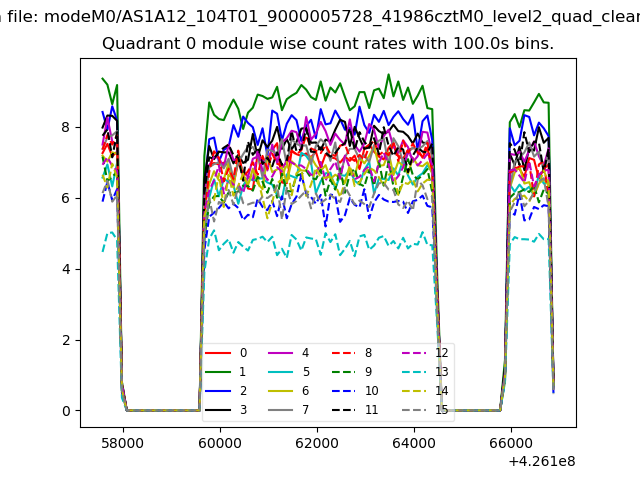 |
 |
| Module-wise count rates for Quadrant B Data is divided into 100 sec bins |
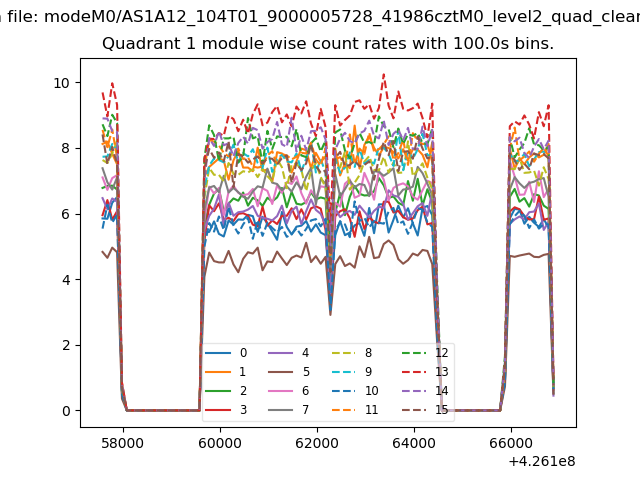 |
 |
| Module-wise count rates for Quadrant C Data is divided into 100 sec bins |
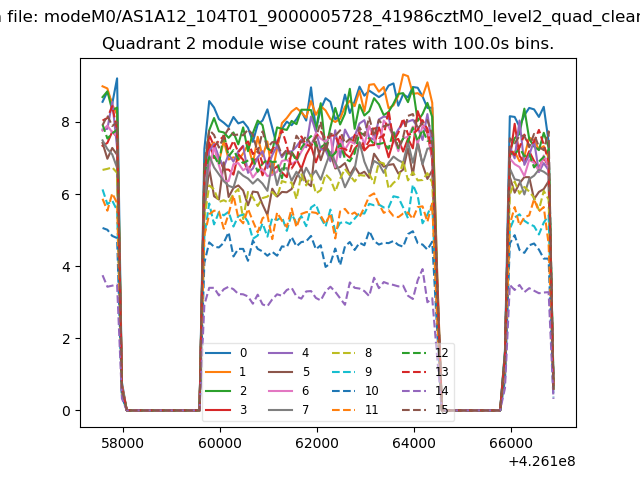 |
 |
| Module-wise count rates for Quadrant D Data is divided into 100 sec bins |
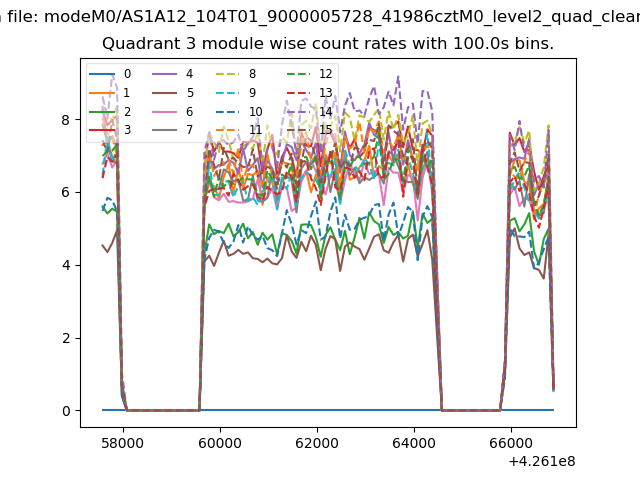 |
 |
| Parameter | Plot |
|---|---|
| CZT HV Monitor | 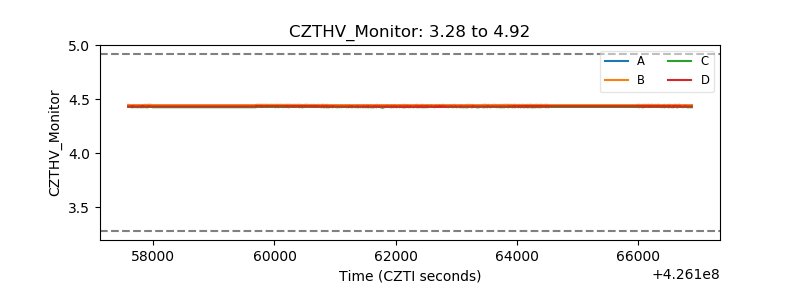 |
| D_VDD | 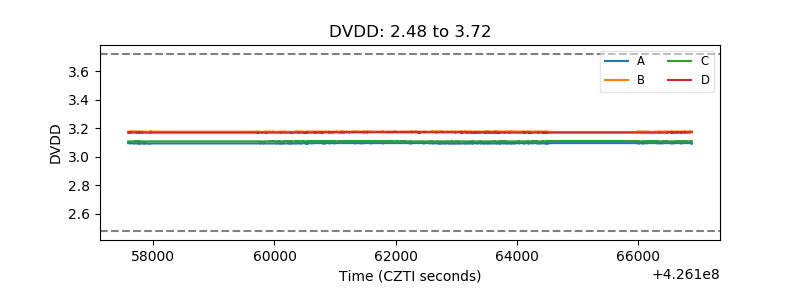 |
| Temperature 1 | 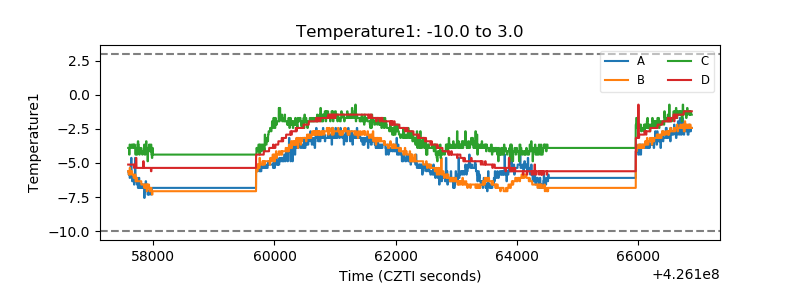 |
| Veto HV Monitor | 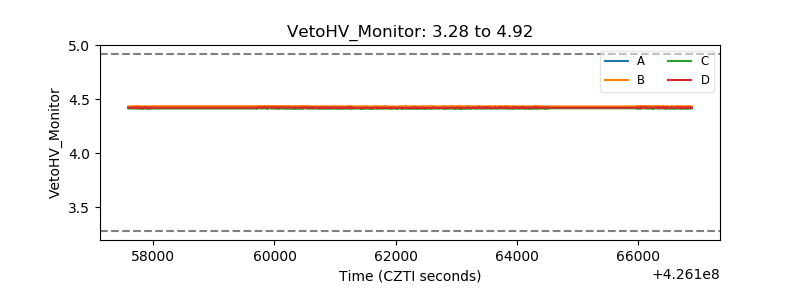 |
| Veto LLD | 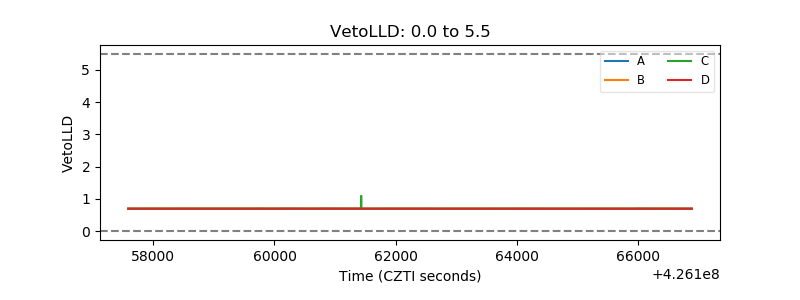 |
| Alpha Counter | 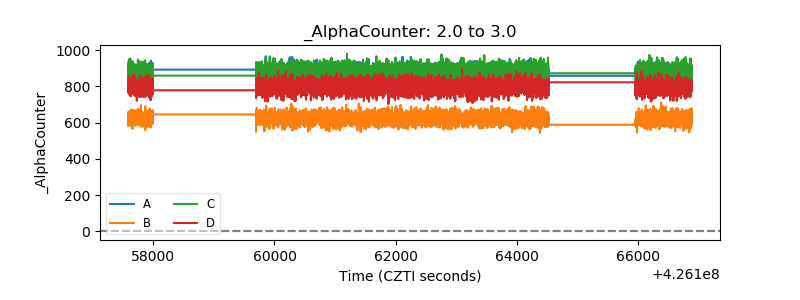 |
| _CPM_Rate |  |
| CZT Counter | 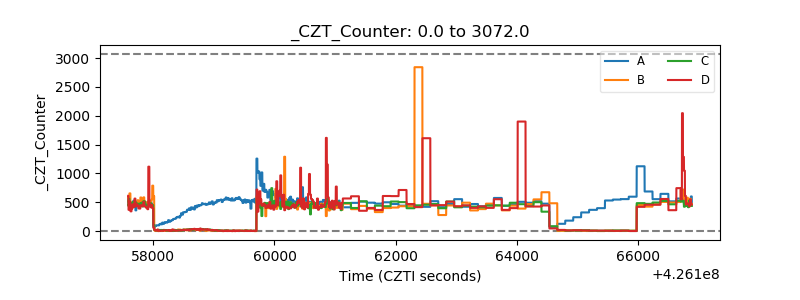 |
| +2.5 Volts monitor |  |
| +5 Volts monitor | 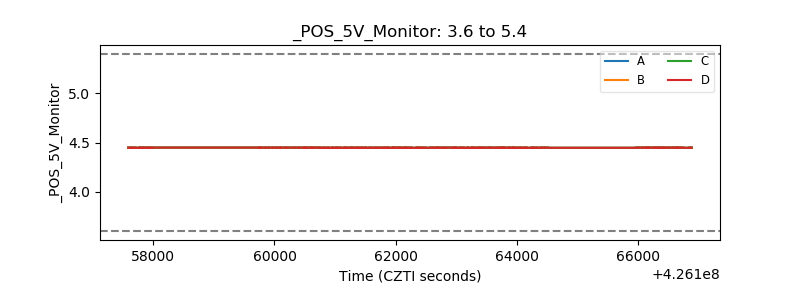 |
| _ROLL_ROT | 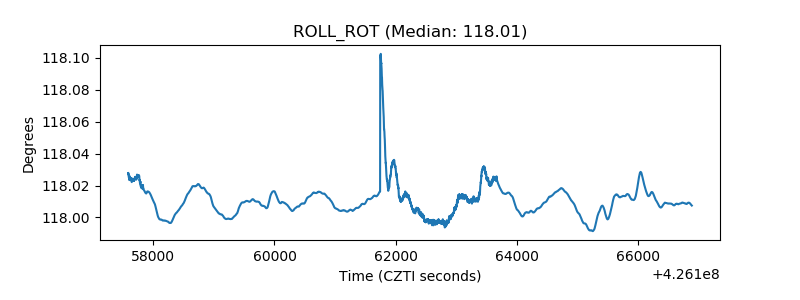 |
| _Roll_DEC | 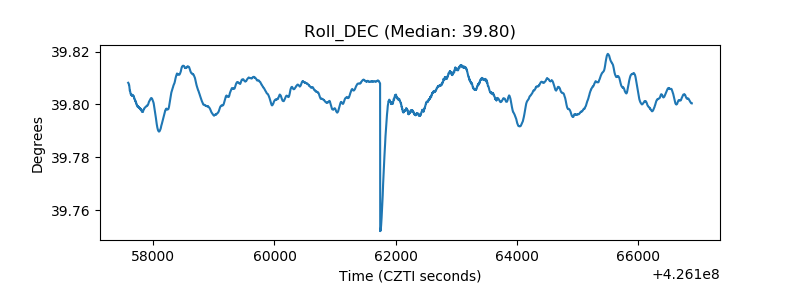 |
| _Roll_RA | 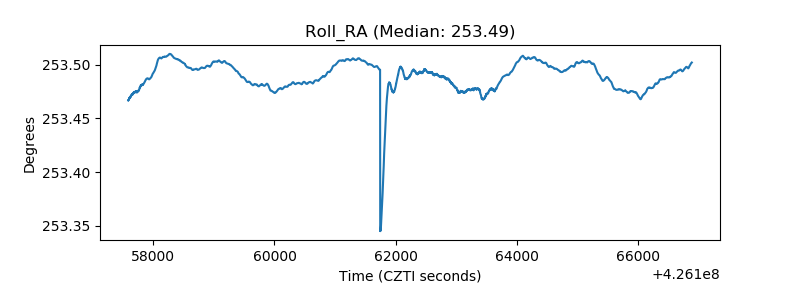 |
| Veto Counter | 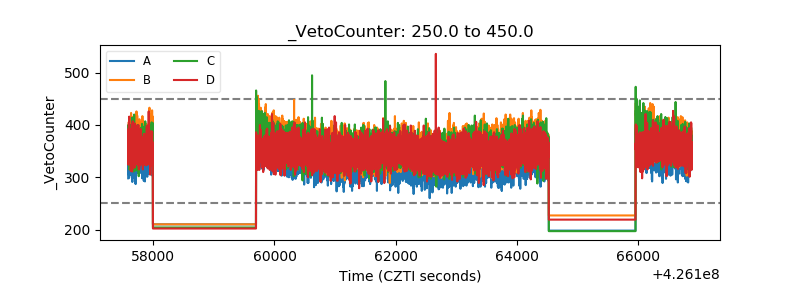 |