| Param | Original file | Final file |
|---|---|---|
| Filename | modeM0/AS1A12_104T01_9000005728_41987cztM0_level2.fits | modeM0/AS1A12_104T01_9000005728_41987cztM0_level2_quad_clean.evt |
| Size (bytes) | 356,886,720 | 96,073,920 |
| Size | 340.4 MB | 91.6 MB |
| Events in quadrant A | 3,206,841 | 644,341 |
| Events in quadrant B | 2,761,120 | 657,390 |
| Events in quadrant C | 2,698,817 | 627,248 |
| Events in quadrant D | 4,083,583 | 566,519 |
| Mode SS | |||
|---|---|---|---|
| Quadrant | BADHDUFLAG | Total packets | Discarded packets |
| A | 0 | 122 | 0 |
| B | 0 | 122 | 0 |
| C | 0 | 122 | 0 |
| D | 0 | 122 | 0 |
| Mode M0 | |||
|---|---|---|---|
| Quadrant | BADHDUFLAG | Total packets | Discarded packets |
| A | 0 | 13091 | 3 |
| B | 0 | 12351 | 2 |
| C | 0 | 11848 | 2 |
| D | 0 | 16308 | 2 |
| Mode M9 | |||
|---|---|---|---|
| Quadrant | BADHDUFLAG | Total packets | Discarded packets |
| A | 0 | 23 | 0 |
| B | 0 | 23 | 0 |
| C | 0 | 23 | 0 |
| D | 0 | 24 | 0 |
| Quadrant | Total seconds | Saturated seconds | Saturation percentage |
|---|---|---|---|
| A | 5913 | 16 | 0.270590% |
| B | 5913 | 26 | 0.439709% |
| C | 5913 | 5 | 0.084559% |
| D | 5913 | 239 | 4.041941% |
Noise dominated data is calculated using 1-second bins in cleaned event files. If a bin has >2000 counts, and if more than 50% of those come from <1% of pixels, then it is considered to be noise-dominated and hence unusable.
| Quadrant | # 1 sec bins | Bins with >0 counts | Bins with >2000 counts | High rate bins dominated by noise | Noise dominated (total time) | Noise dominated (detector-on time) | Marked lightcurve |
|---|---|---|---|---|---|---|---|
| A | 7196 | 5914 | 7 | 7 | 0.10% | 0.12% | 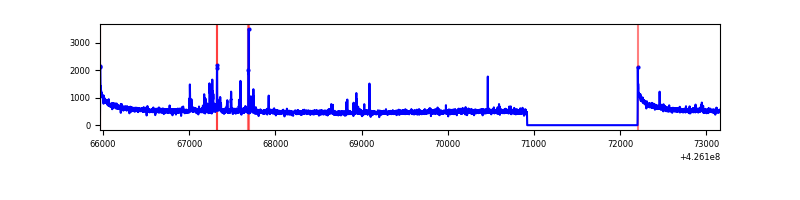 |
| B | 7196 | 5914 | 13 | 13 | 0.18% | 0.22% | 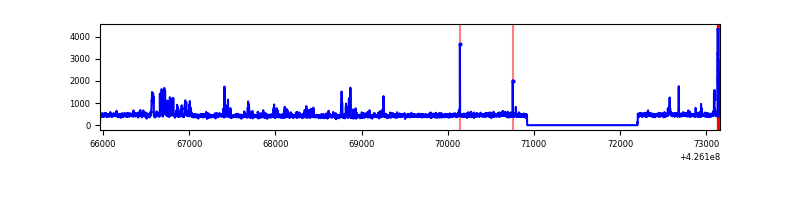 |
| C | 7196 | 5914 | 0 | 0 | 0.00% | 0.00% |  |
| D | 7196 | 5914 | 197 | 197 | 2.74% | 3.33% | 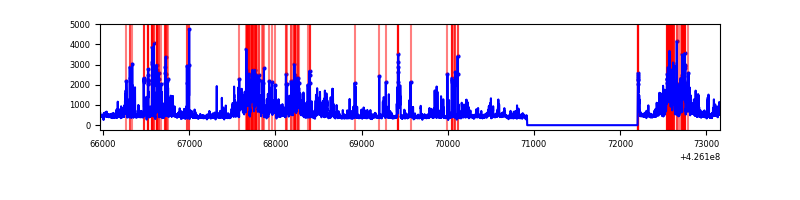 |
Top three noisy pixels from each quadrant. If the there are fewer than three noisy pixels in the level2.evt file, extra rows are filled as -1
| Pixel properties | Quadrant properties | ||||||
|---|---|---|---|---|---|---|---|
| Quadrant | DetID | PixID | Counts | Sigma | Mean | Median | Sigma |
| A | 10 | 83 | 582305 | 4375.23 | 643 | 630 | 132.9 |
| A | 2 | 79 | 104239 | 779.32 | 643 | 630 | 132.9 |
| A | 13 | 248 | 20173 | 147.0 | 643 | 630 | 132.9 |
| B | 5 | 255 | 84879 | 674.39 | 637 | 617 | 124.9 |
| B | 0 | 190 | 81815 | 649.86 | 637 | 617 | 124.9 |
| B | 4 | 81 | 64356 | 510.13 | 637 | 617 | 124.9 |
| C | 15 | 214 | 246106 | 1671.43 | 628 | 632 | 146.9 |
| C | 13 | 61 | 4113 | 23.7 | 628 | 632 | 146.9 |
| C | 3 | 233 | 3199 | 17.48 | 628 | 632 | 146.9 |
| D | 2 | 249 | 516671 | 3407.36 | 620 | 602 | 151.5 |
| D | 13 | 249 | 369634 | 2436.54 | 620 | 602 | 151.5 |
| D | 12 | 233 | 345729 | 2278.71 | 620 | 602 | 151.5 |
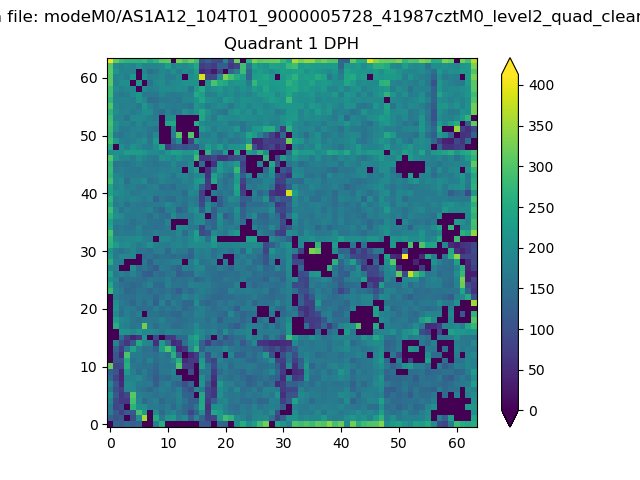
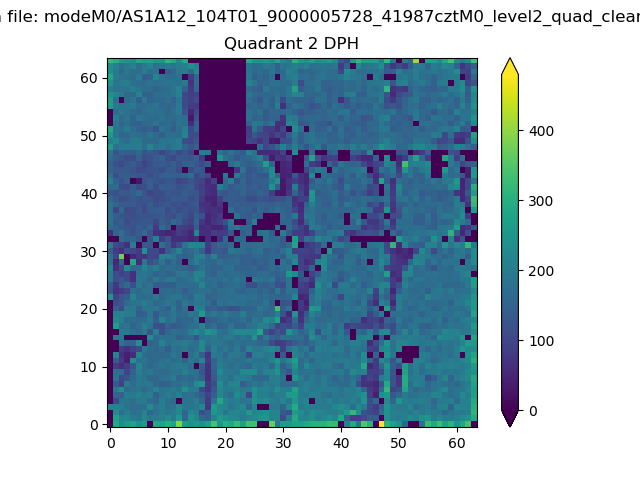
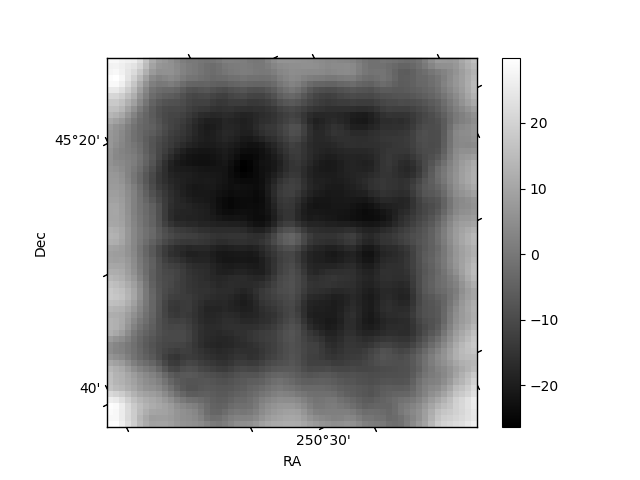
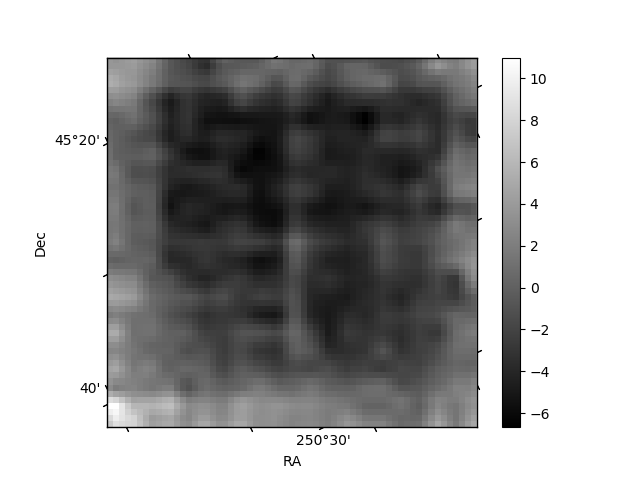
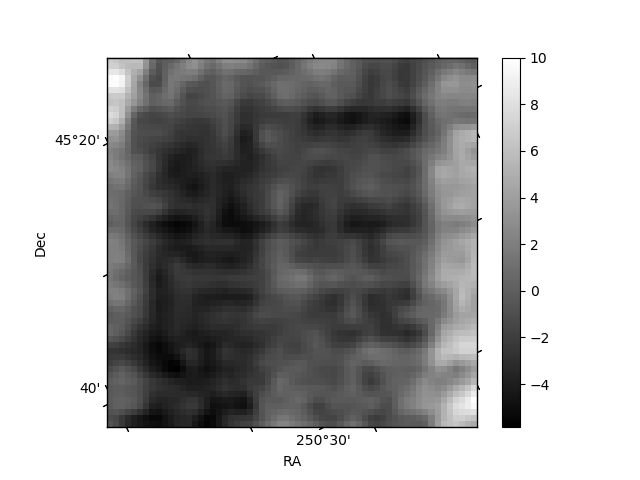
Histogram calculated using DETX and DETY for each event in the final _common_clean file
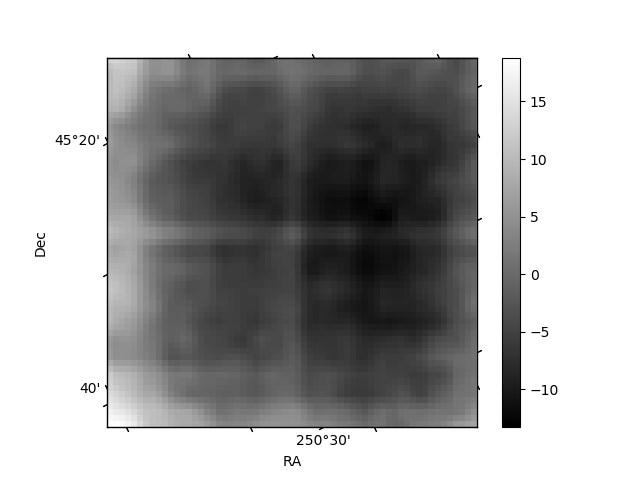
| Quadrant A | 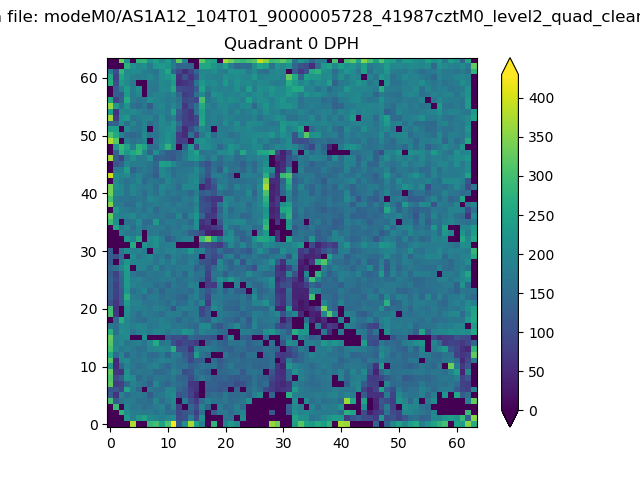 |
 |
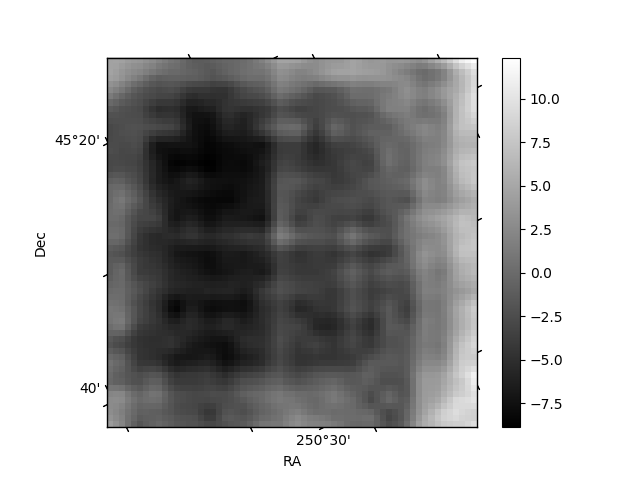
Quadrant B |
|---|---|---|---|
| Quadrant D | 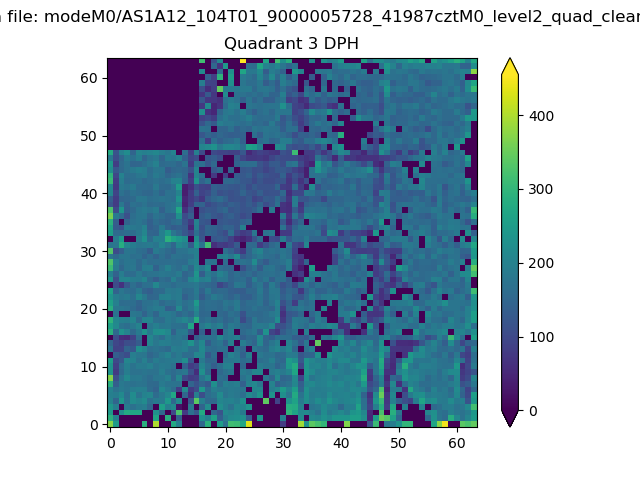 |
 |
Quadrant C |
| Plot type | Count rate plots | Images |
|---|---|---|
| Comparison with Poisson distribution Blue bars denote a histogram of data divided into 1 sec bins. Red curve is a Poisson curve with rate = median count rate of data. |
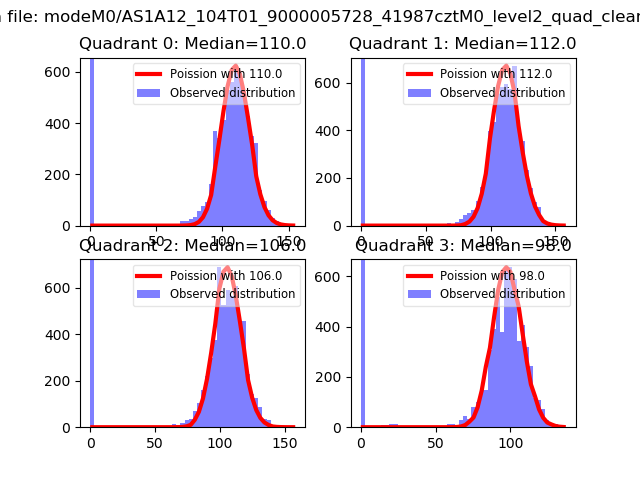 |
 |
| Quadrant-wise count rates Data is divided into 100 sec bins |
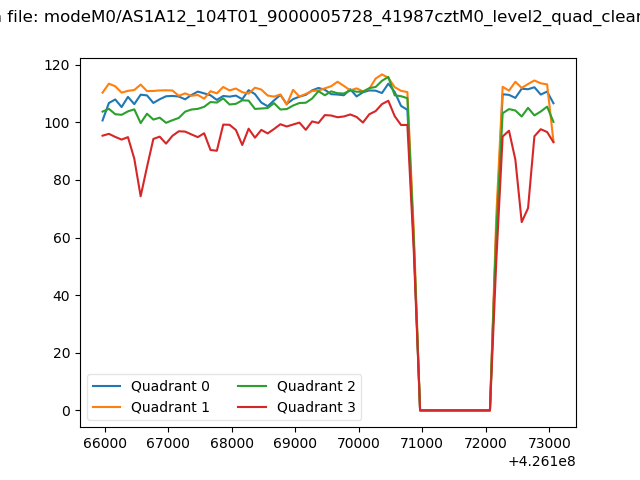 |
|
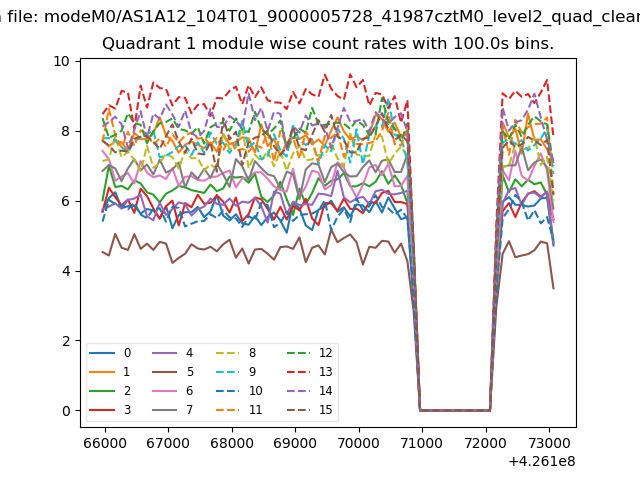
| Module-wise count rates for Quadrant A Data is divided into 100 sec bins |
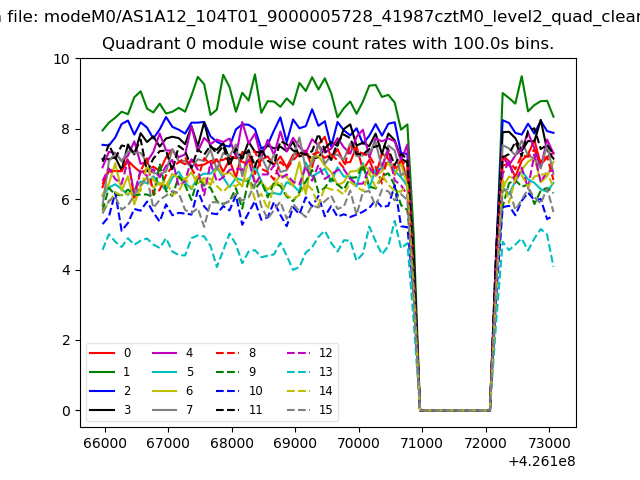 |
 |
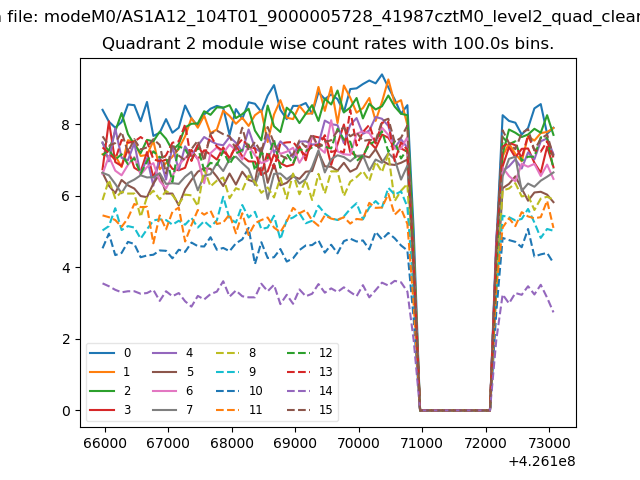
| Module-wise count rates for Quadrant B Data is divided into 100 sec bins |
 |
 |
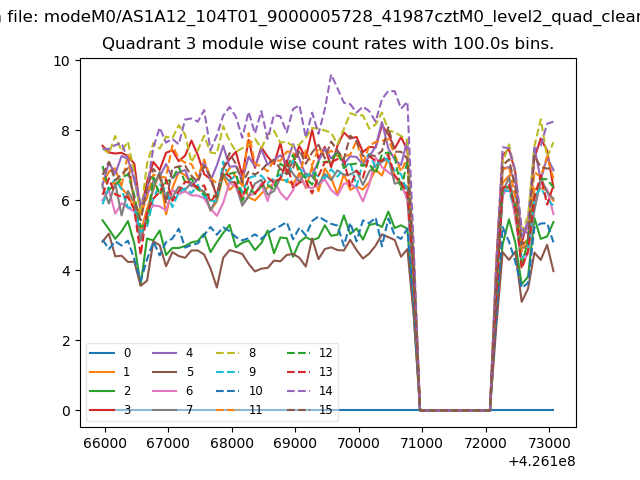
| Module-wise count rates for Quadrant C Data is divided into 100 sec bins |
 |
 |
| Module-wise count rates for Quadrant D Data is divided into 100 sec bins |
 |
 |
| Parameter | Plot |
|---|---|
| CZT HV Monitor | 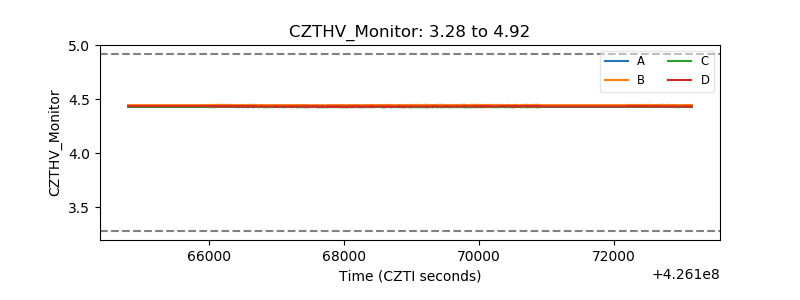 |
| D_VDD | 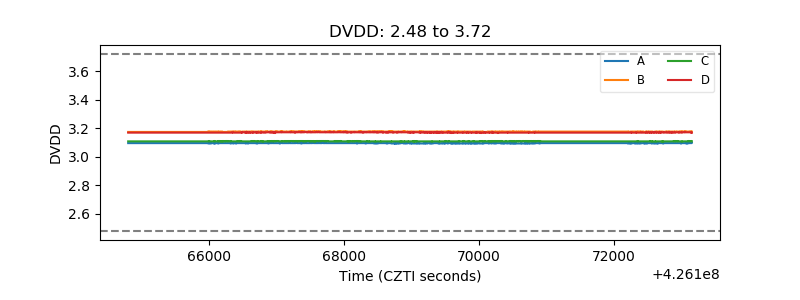 |
| Temperature 1 | 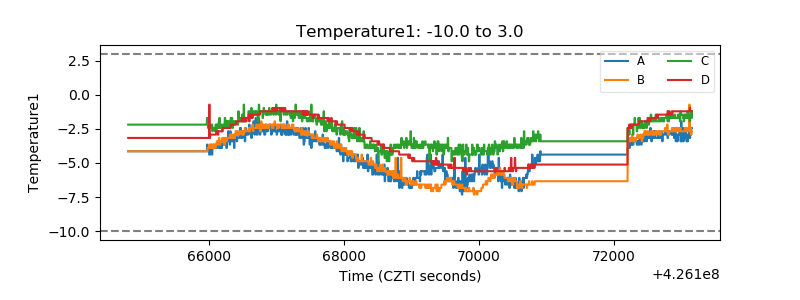 |
| Veto HV Monitor |  |
| Veto LLD | 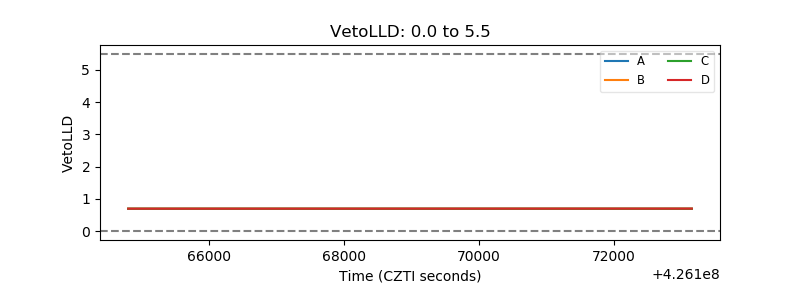 |
| Alpha Counter |  |
| _CPM_Rate |  |
| CZT Counter | 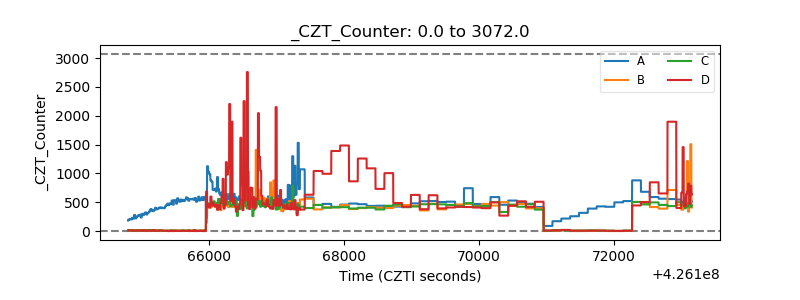 |
| +2.5 Volts monitor | 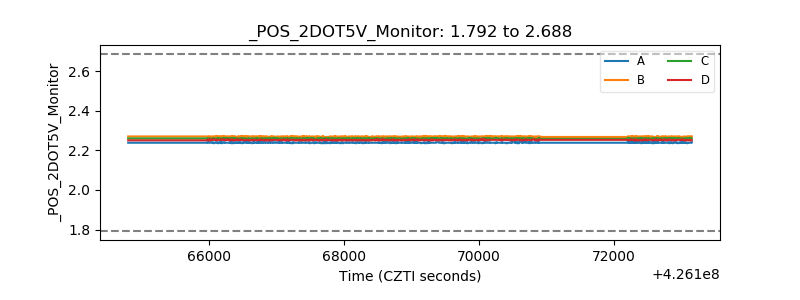 |
| +5 Volts monitor |  |
| _ROLL_ROT | 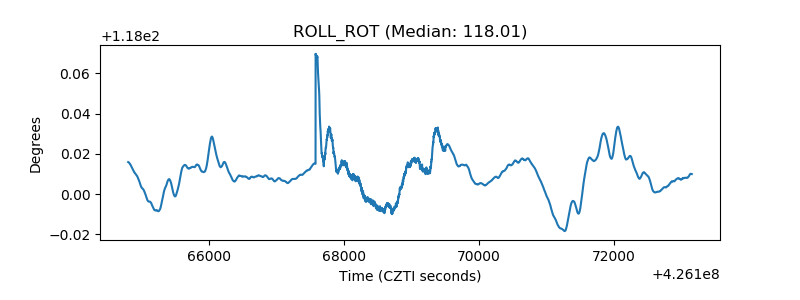 |
| _Roll_DEC | 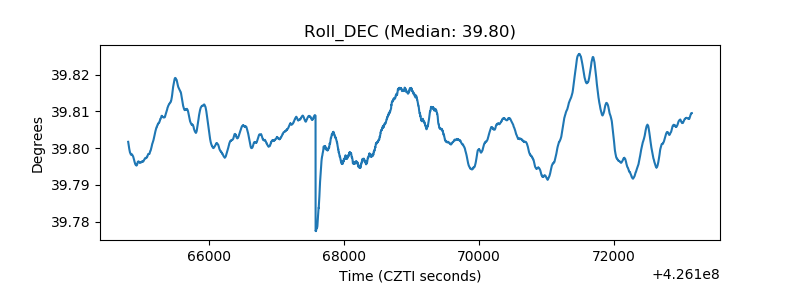 |
| _Roll_RA | 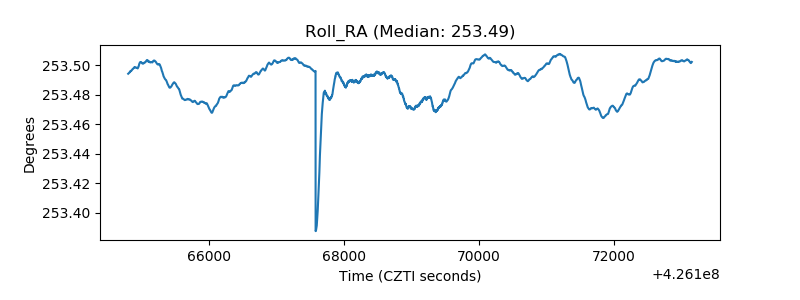 |
| Veto Counter |  |