| Param | Original file | Final file |
|---|---|---|
| Filename | modeM0/AS1A12_104T01_9000005728_41990cztM0_level2.fits | modeM0/AS1A12_104T01_9000005728_41990cztM0_level2_quad_clean.evt |
| Size (bytes) | 858,646,080 | 246,401,280 |
| Size | 818.9 MB | 235.0 MB |
| Events in quadrant A | 7,760,837 | 1,637,503 |
| Events in quadrant B | 6,891,336 | 1,674,745 |
| Events in quadrant C | 6,944,885 | 1,625,910 |
| Events in quadrant D | 8,998,289 | 1,464,459 |
| Mode SS | |||
|---|---|---|---|
| Quadrant | BADHDUFLAG | Total packets | Discarded packets |
| A | 0 | 312 | 0 |
| B | 0 | 312 | 0 |
| C | 0 | 312 | 0 |
| D | 0 | 312 | 0 |
| Mode M0 | |||
|---|---|---|---|
| Quadrant | BADHDUFLAG | Total packets | Discarded packets |
| A | 0 | 32572 | 4 |
| B | 0 | 31576 | 3 |
| C | 0 | 30816 | 3 |
| D | 0 | 38182 | 6 |
| Mode M9 | |||
|---|---|---|---|
| Quadrant | BADHDUFLAG | Total packets | Discarded packets |
| A | 0 | 42 | 0 |
| B | 0 | 42 | 0 |
| C | 0 | 42 | 0 |
| D | 0 | 42 | 0 |
| Quadrant | Total seconds | Saturated seconds | Saturation percentage |
|---|---|---|---|
| A | 15331 | 28 | 0.182636% |
| B | 15331 | 48 | 0.313091% |
| C | 15331 | 14 | 0.091318% |
| D | 15330 | 505 | 3.294194% |
Noise dominated data is calculated using 1-second bins in cleaned event files. If a bin has >2000 counts, and if more than 50% of those come from <1% of pixels, then it is considered to be noise-dominated and hence unusable.
| Quadrant | # 1 sec bins | Bins with >0 counts | Bins with >2000 counts | High rate bins dominated by noise | Noise dominated (total time) | Noise dominated (detector-on time) | Marked lightcurve |
|---|---|---|---|---|---|---|---|
| A | 19507 | 15334 | 5 | 5 | 0.03% | 0.03% | 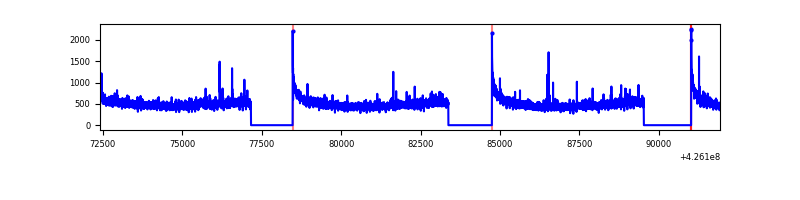 |
| B | 19507 | 15334 | 17 | 17 | 0.09% | 0.11% | 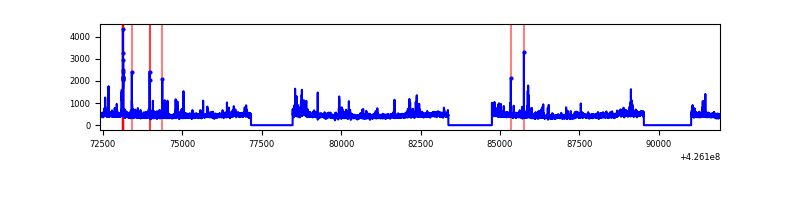 |
| C | 19507 | 15334 | 1 | 1 | 0.01% | 0.01% | 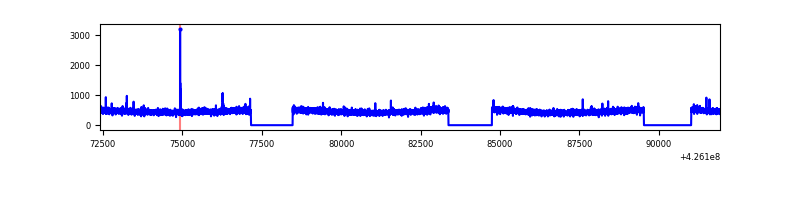 |
| D | 19507 | 15334 | 505 | 505 | 2.59% | 3.29% | 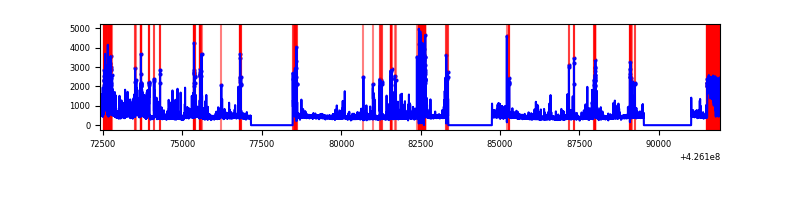 |
Top three noisy pixels from each quadrant. If the there are fewer than three noisy pixels in the level2.evt file, extra rows are filled as -1
| Pixel properties | Quadrant properties | ||||||
|---|---|---|---|---|---|---|---|
| Quadrant | DetID | PixID | Counts | Sigma | Mean | Median | Sigma |
| A | 10 | 83 | 1301565 | 3891.3 | 1635 | 1601 | 334.1 |
| A | 2 | 79 | 55689 | 161.91 | 1635 | 1601 | 334.1 |
| A | 7 | 3 | 39644 | 113.88 | 1635 | 1601 | 334.1 |
| B | 5 | 255 | 182252 | 574.81 | 1626 | 1579 | 314.3 |
| B | 0 | 190 | 155270 | 488.97 | 1626 | 1579 | 314.3 |
| B | 4 | 81 | 87451 | 273.2 | 1626 | 1579 | 314.3 |
| C | 15 | 214 | 618615 | 1655.01 | 1610 | 1618 | 372.8 |
| C | 8 | 229 | 14354 | 34.16 | 1610 | 1618 | 372.8 |
| C | 3 | 233 | 13077 | 30.74 | 1610 | 1618 | 372.8 |
| D | 1 | 52 | 784039 | 2026.98 | 1587 | 1544 | 386.0 |
| D | 13 | 249 | 719775 | 1860.51 | 1587 | 1544 | 386.0 |
| D | 12 | 233 | 451781 | 1166.3 | 1587 | 1544 | 386.0 |
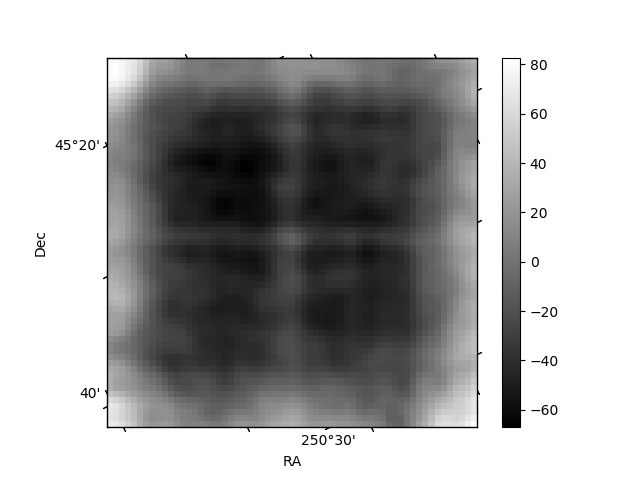
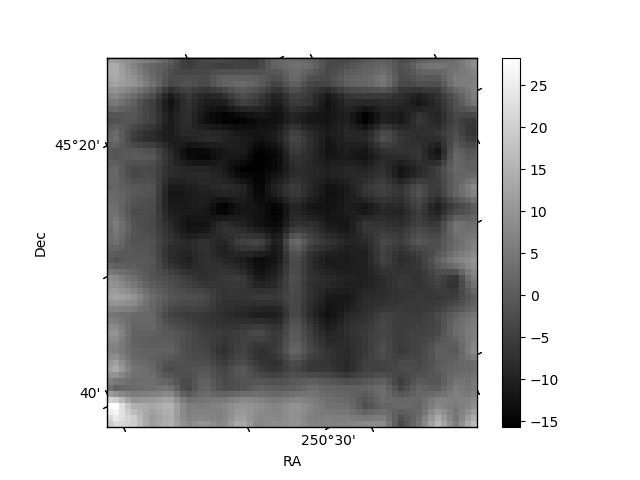
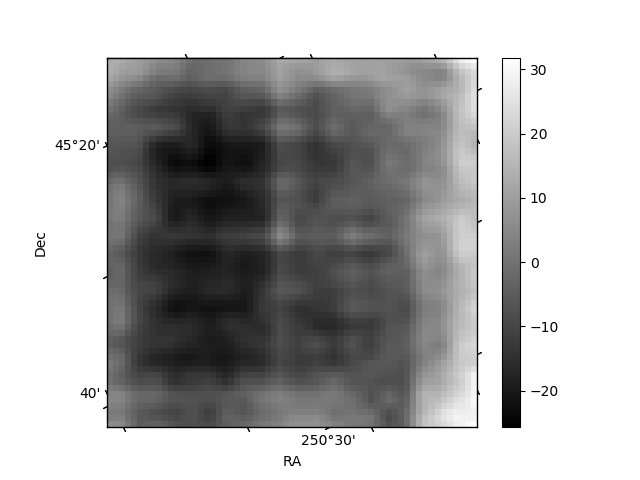
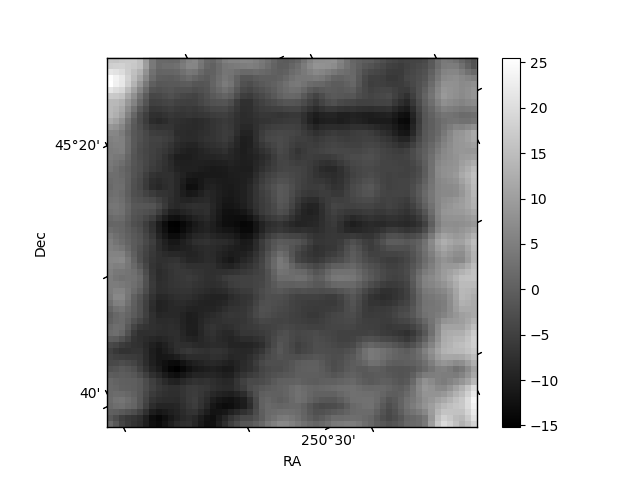
Histogram calculated using DETX and DETY for each event in the final _common_clean file
| Quadrant A | 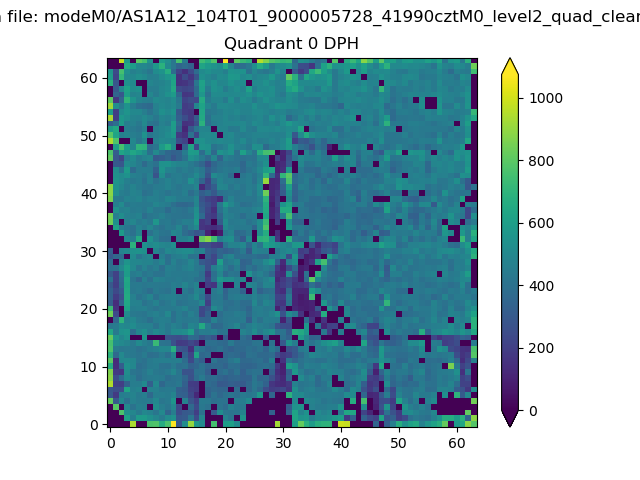 |
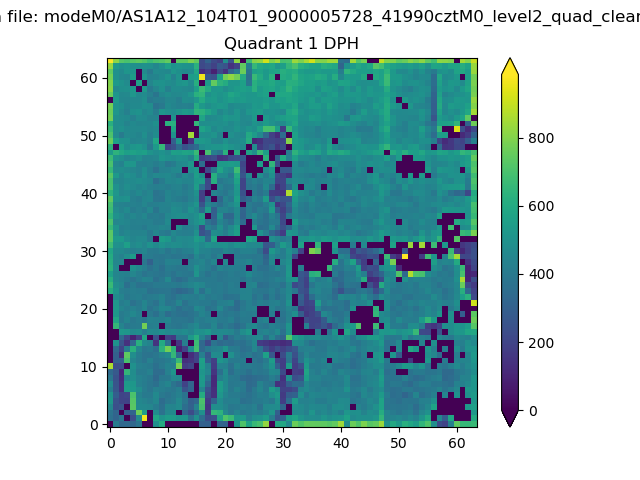 |
Quadrant B |
|---|---|---|---|
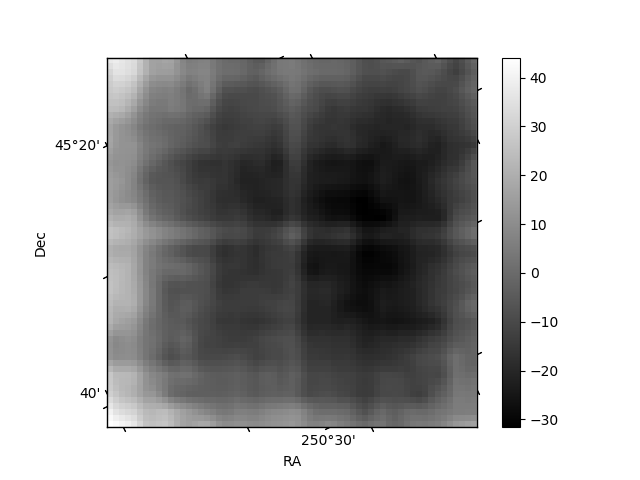
| Quadrant D | 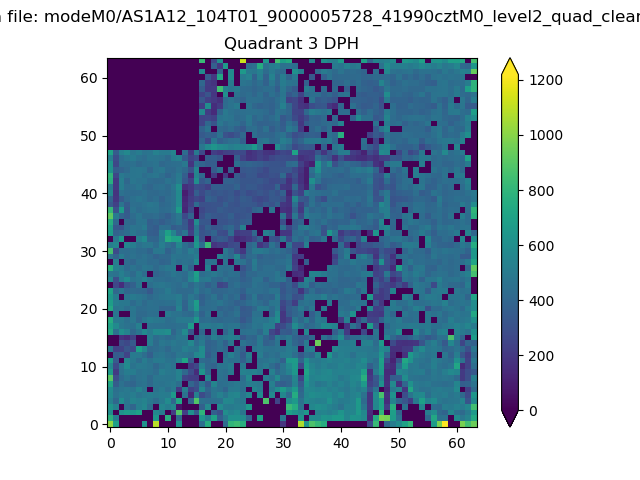 |
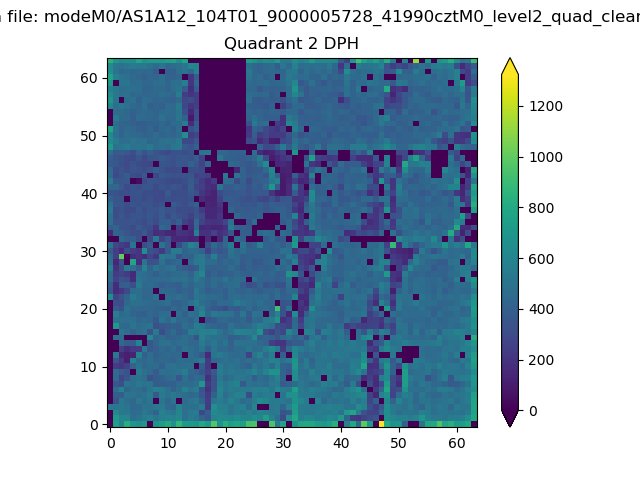 |
Quadrant C |
| Plot type | Count rate plots | Images |
|---|---|---|
| Comparison with Poisson distribution Blue bars denote a histogram of data divided into 1 sec bins. Red curve is a Poisson curve with rate = median count rate of data. |
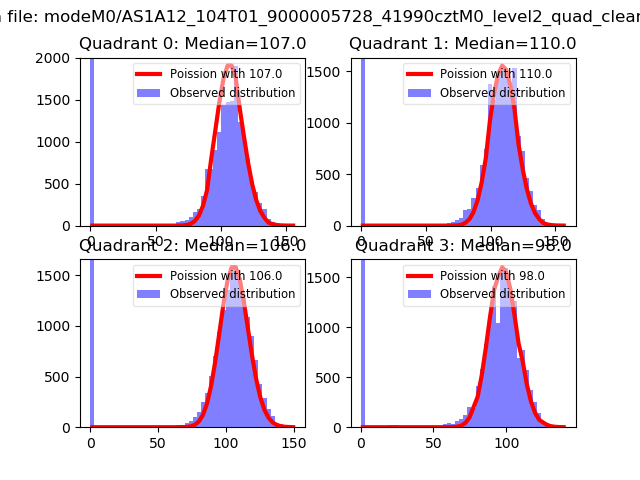 |
 |
| Quadrant-wise count rates Data is divided into 100 sec bins |
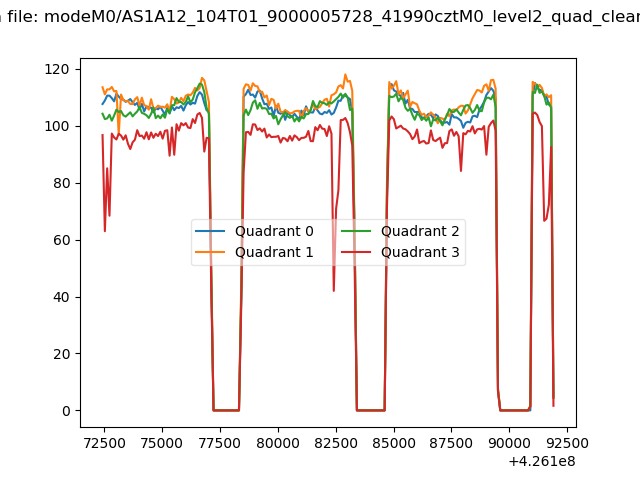 |
|
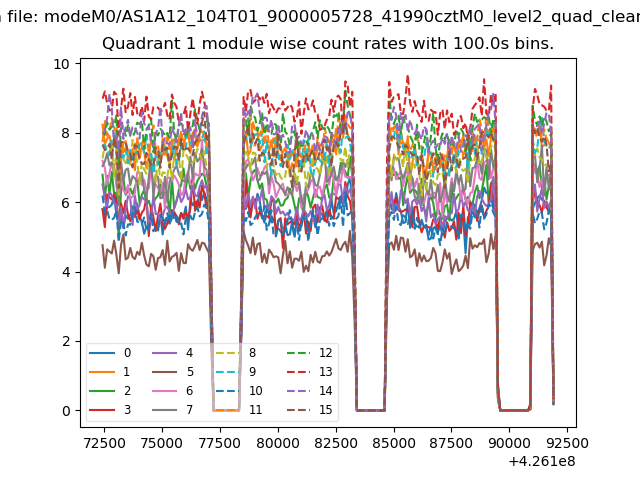
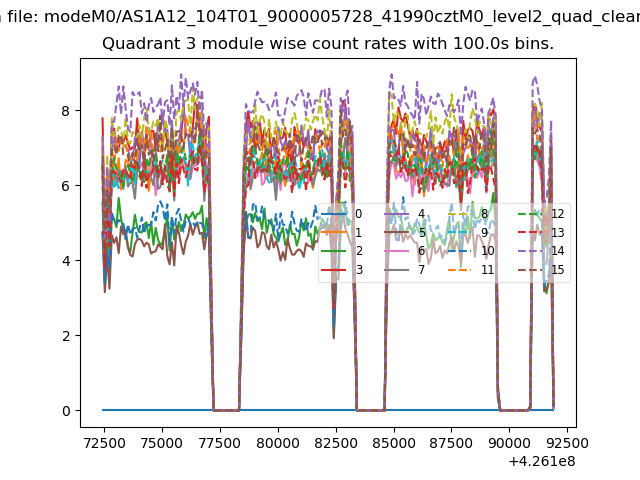
| Module-wise count rates for Quadrant A Data is divided into 100 sec bins |
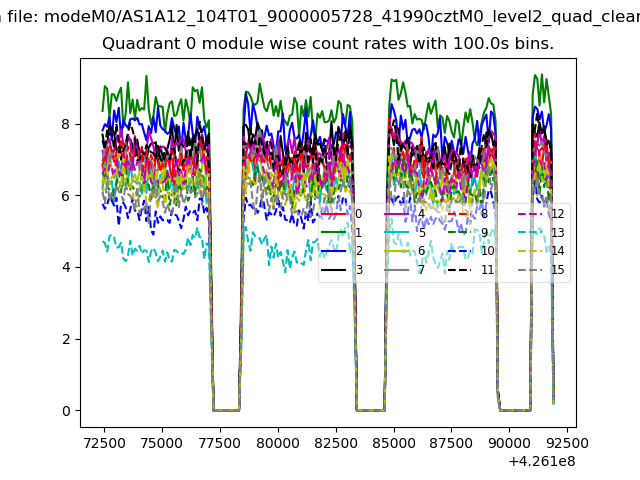 |
 |
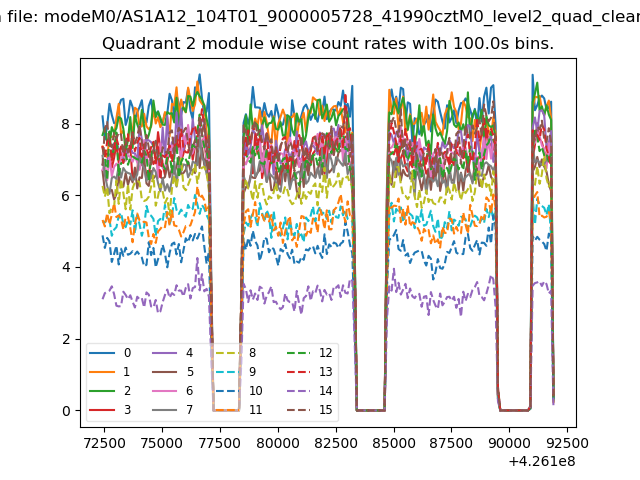
| Module-wise count rates for Quadrant B Data is divided into 100 sec bins |
 |
 |
| Module-wise count rates for Quadrant C Data is divided into 100 sec bins |
 |
 |
| Module-wise count rates for Quadrant D Data is divided into 100 sec bins |
 |
 |
| Parameter | Plot |
|---|---|
| CZT HV Monitor | 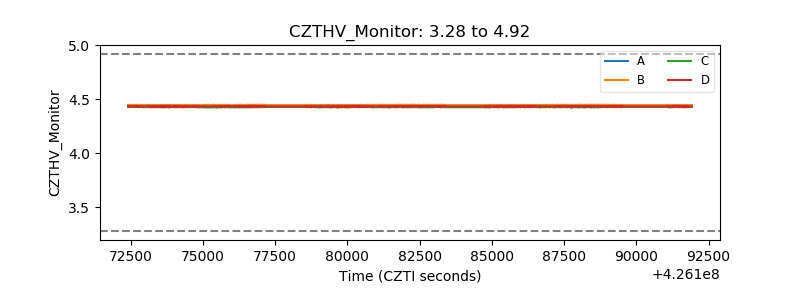 |
| D_VDD | 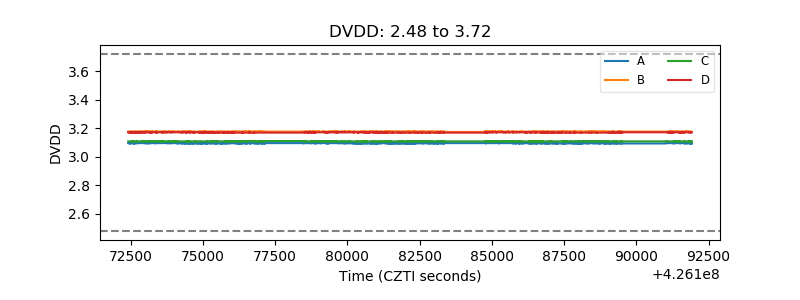 |
| Temperature 1 | 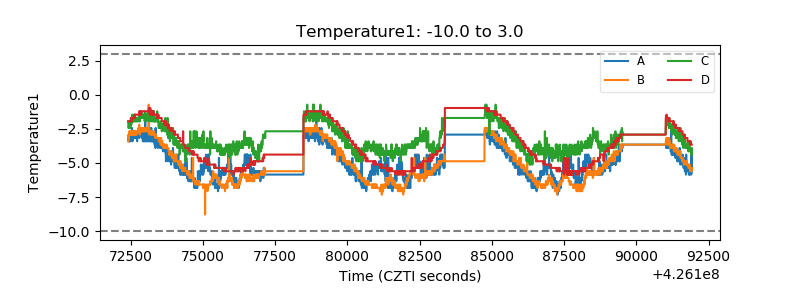 |
| Veto HV Monitor | 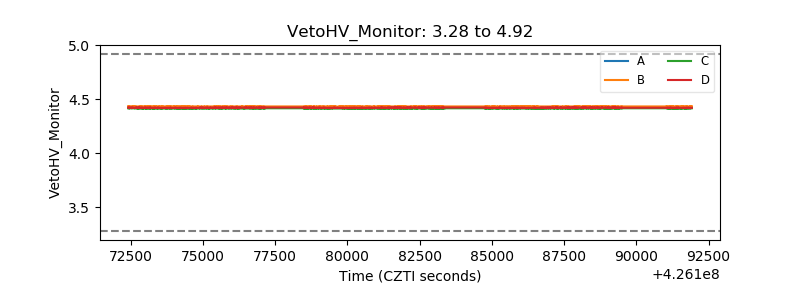 |
| Veto LLD | 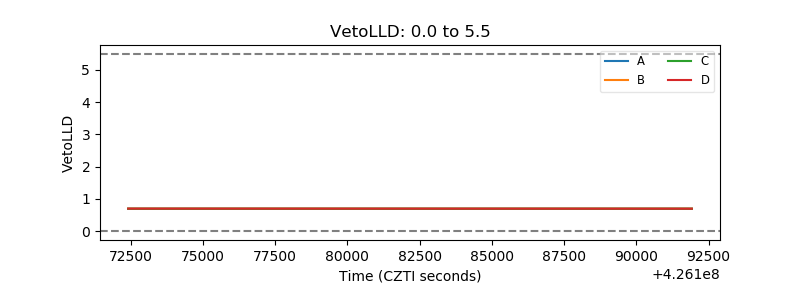 |
| Alpha Counter | 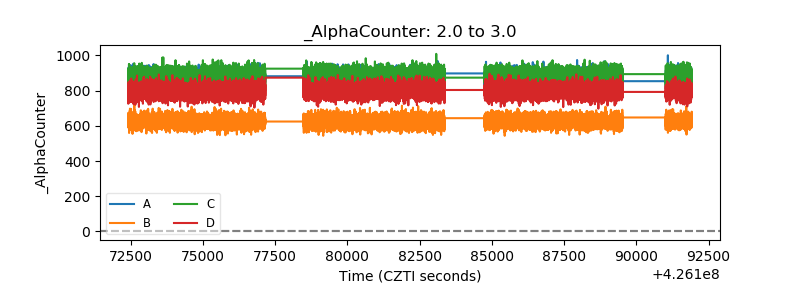 |
| _CPM_Rate | 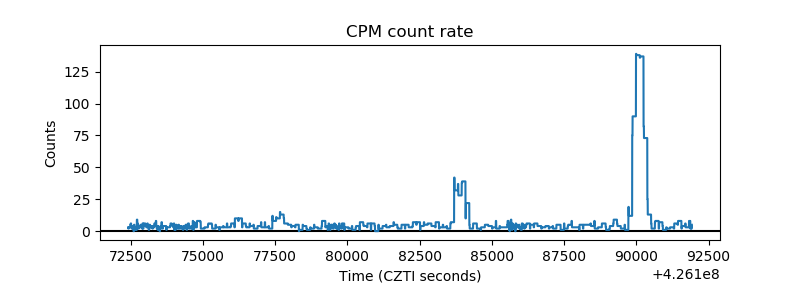 |
| CZT Counter | 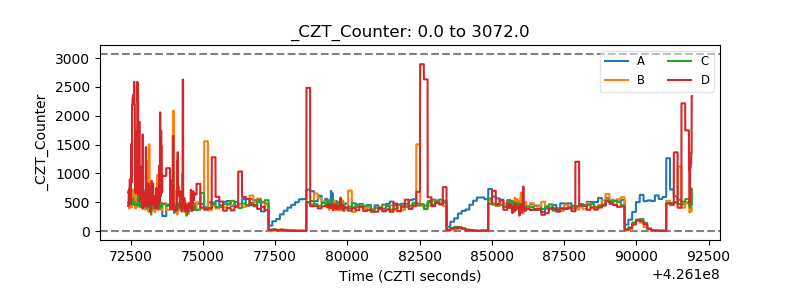 |
| +2.5 Volts monitor | 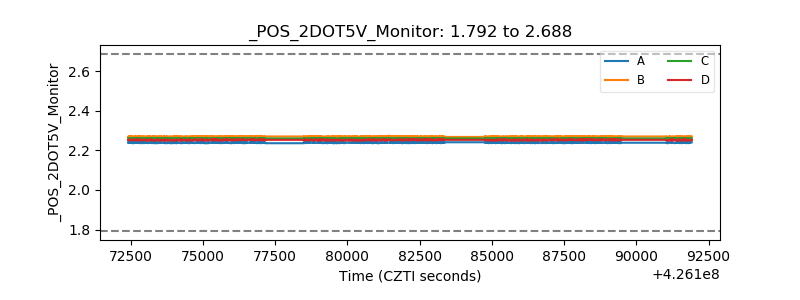 |
| +5 Volts monitor | 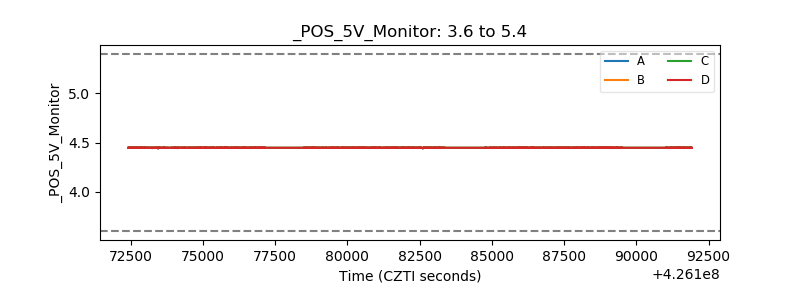 |
| _ROLL_ROT | 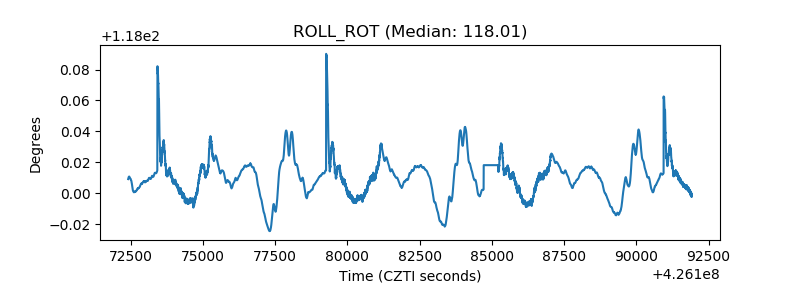 |
| _Roll_DEC | 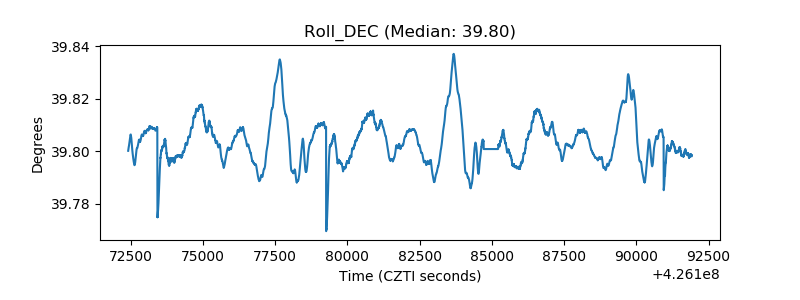 |
| _Roll_RA | 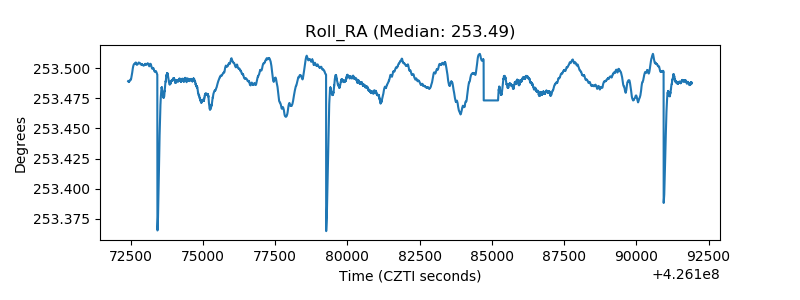 |
| Veto Counter | 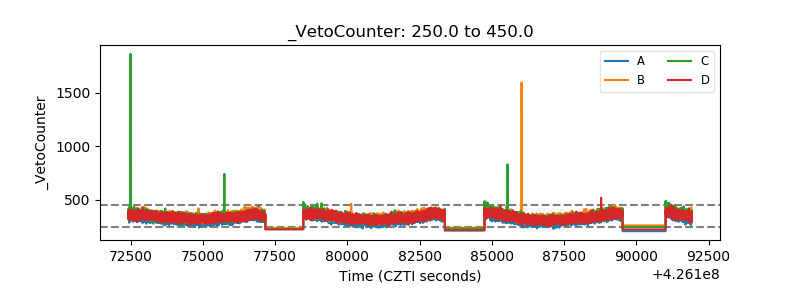 |