| Param | Original file | Final file |
|---|---|---|
| Filename | modeM0/AS1A12_104T01_9000005728_41991cztM0_level2.fits | modeM0/AS1A12_104T01_9000005728_41991cztM0_level2_quad_clean.evt |
| Size (bytes) | 367,378,560 | 73,785,600 |
| Size | 350.4 MB | 70.4 MB |
| Events in quadrant A | 2,278,446 | 494,214 |
| Events in quadrant B | 2,041,056 | 503,856 |
| Events in quadrant C | 2,070,136 | 491,743 |
| Events in quadrant D | 6,849,499 | 419,047 |
| Mode SS | |||
|---|---|---|---|
| Quadrant | BADHDUFLAG | Total packets | Discarded packets |
| A | 0 | 94 | 0 |
| B | 0 | 94 | 0 |
| C | 0 | 94 | 0 |
| D | 0 | 94 | 0 |
| Mode M0 | |||
|---|---|---|---|
| Quadrant | BADHDUFLAG | Total packets | Discarded packets |
| A | 0 | 9733 | 1 |
| B | 0 | 9521 | 1 |
| C | 0 | 9294 | 1 |
| D | 0 | 23499 | 1 |
| Mode M9 | |||
|---|---|---|---|
| Quadrant | BADHDUFLAG | Total packets | Discarded packets |
| A | 0 | 22 | 0 |
| B | 0 | 22 | 0 |
| C | 0 | 22 | 0 |
| D | 0 | 23 | 0 |
| Quadrant | Total seconds | Saturated seconds | Saturation percentage |
|---|---|---|---|
| A | 4629 | 7 | 0.151221% |
| B | 4629 | 5 | 0.108015% |
| C | 4629 | 5 | 0.108015% |
| D | 4629 | 520 | 11.233528% |
Noise dominated data is calculated using 1-second bins in cleaned event files. If a bin has >2000 counts, and if more than 50% of those come from <1% of pixels, then it is considered to be noise-dominated and hence unusable.
| Quadrant | # 1 sec bins | Bins with >0 counts | Bins with >2000 counts | High rate bins dominated by noise | Noise dominated (total time) | Noise dominated (detector-on time) | Marked lightcurve |
|---|---|---|---|---|---|---|---|
| A | 4629 | 4629 | 3 | 3 | 0.06% | 0.06% | 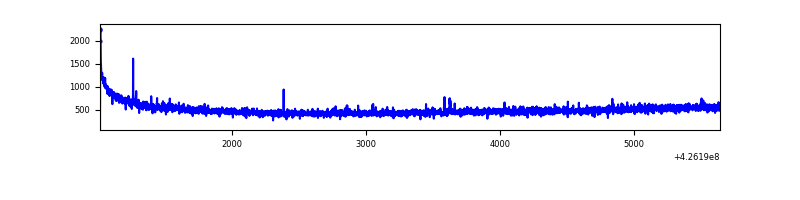 |
| B | 4629 | 4629 | 2 | 2 | 0.04% | 0.04% | 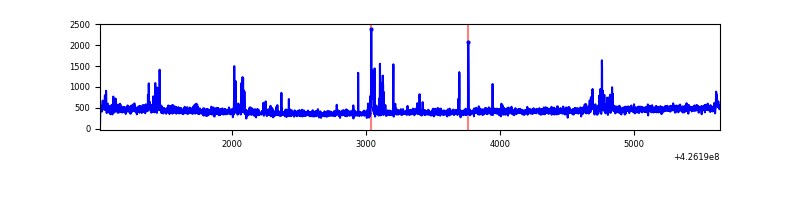 |
| C | 4629 | 4629 | 0 | 0 | 0.00% | 0.00% |  |
| D | 4629 | 4629 | 741 | 741 | 16.01% | 16.01% | 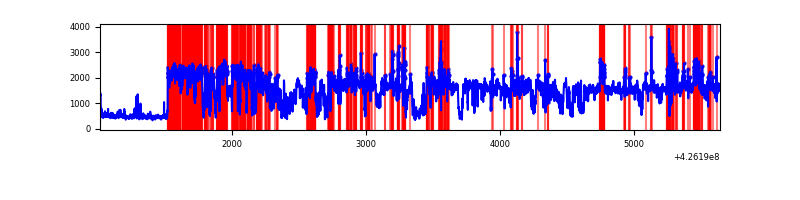 |
Top three noisy pixels from each quadrant. If the there are fewer than three noisy pixels in the level2.evt file, extra rows are filled as -1
| Pixel properties | Quadrant properties | ||||||
|---|---|---|---|---|---|---|---|
| Quadrant | DetID | PixID | Counts | Sigma | Mean | Median | Sigma |
| A | 10 | 83 | 388626 | 3817.18 | 485 | 474 | 101.7 |
| A | 15 | 235 | 6807 | 62.28 | 485 | 474 | 101.7 |
| A | 15 | 223 | 6564 | 59.89 | 485 | 474 | 101.7 |
| B | 5 | 255 | 85003 | 895.05 | 482 | 467 | 94.4 |
| B | 0 | 190 | 38967 | 407.63 | 482 | 467 | 94.4 |
| B | 12 | 111 | 12298 | 125.26 | 482 | 467 | 94.4 |
| C | 15 | 214 | 187808 | 1656.66 | 478 | 481 | 113.1 |
| C | 8 | 229 | 9665 | 81.22 | 478 | 481 | 113.1 |
| C | 15 | 111 | 4998 | 39.95 | 478 | 481 | 113.1 |
| D | 1 | 52 | 4633121 | 40834.04 | 462 | 448 | 113.5 |
| D | 13 | 249 | 184171 | 1619.4 | 462 | 448 | 113.5 |
| D | 2 | 249 | 122558 | 1076.32 | 462 | 448 | 113.5 |
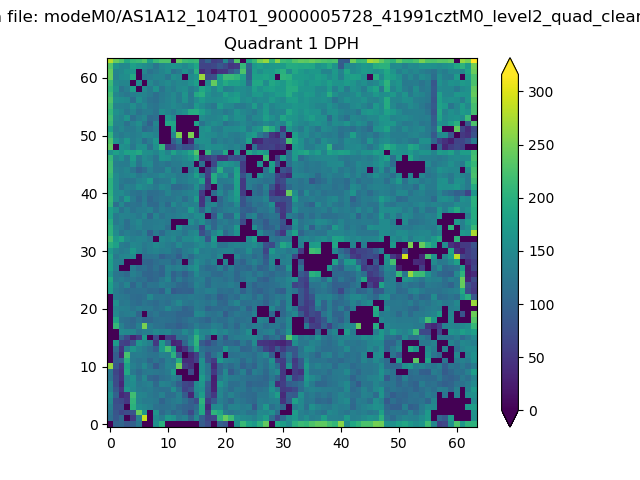
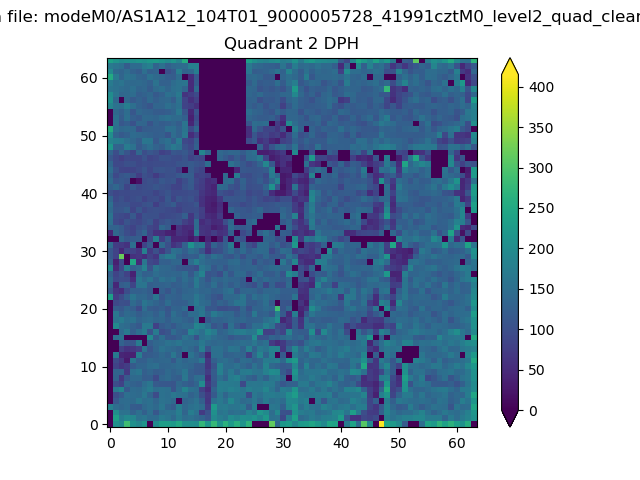
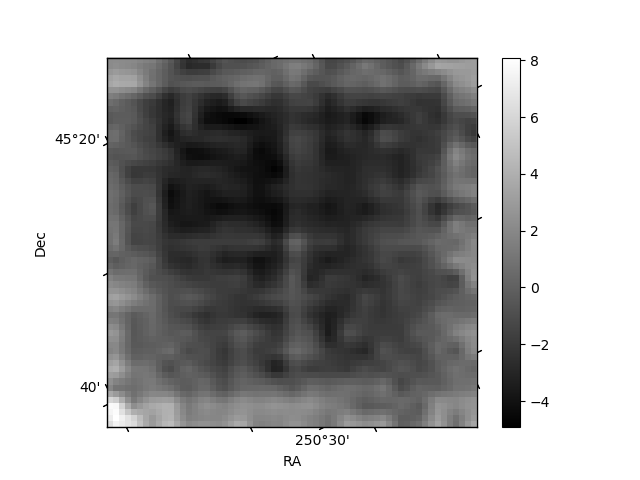
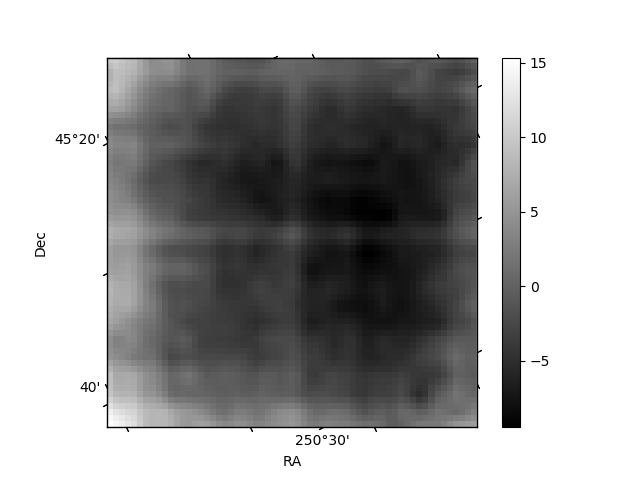
Histogram calculated using DETX and DETY for each event in the final _common_clean file
| Quadrant A |  |
 |
Quadrant B |
|---|---|---|---|
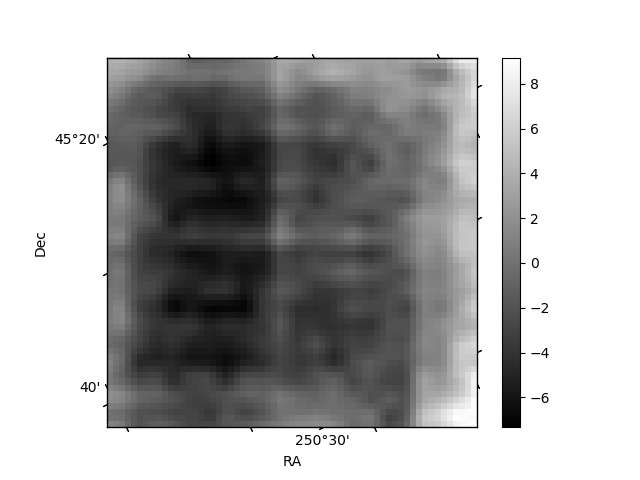
| Quadrant D | 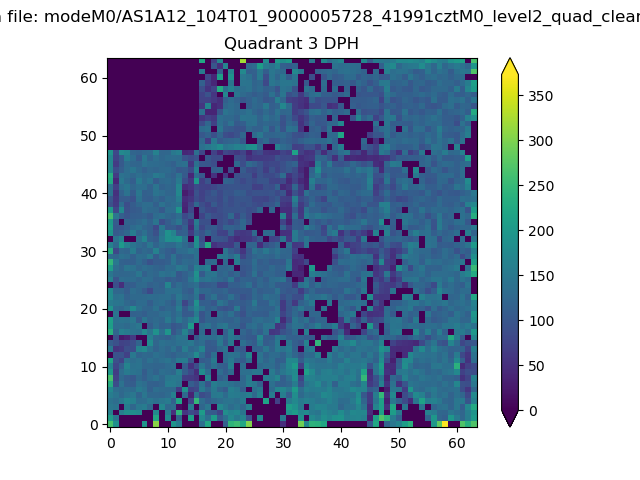 |
 |
Quadrant C |
| Plot type | Count rate plots | Images |
|---|---|---|
| Comparison with Poisson distribution Blue bars denote a histogram of data divided into 1 sec bins. Red curve is a Poisson curve with rate = median count rate of data. |
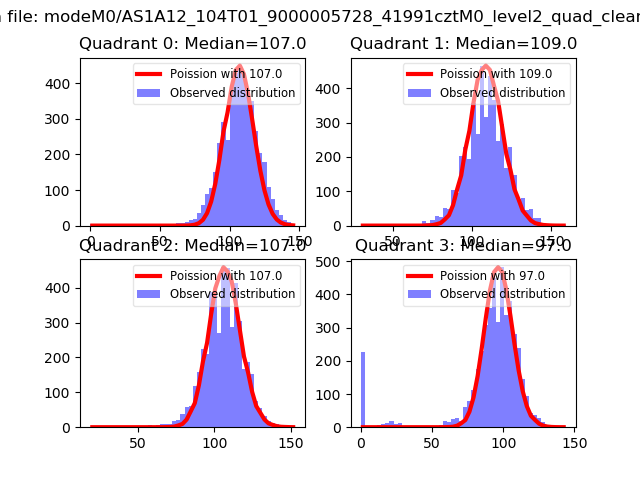 |
 |
| Quadrant-wise count rates Data is divided into 100 sec bins |
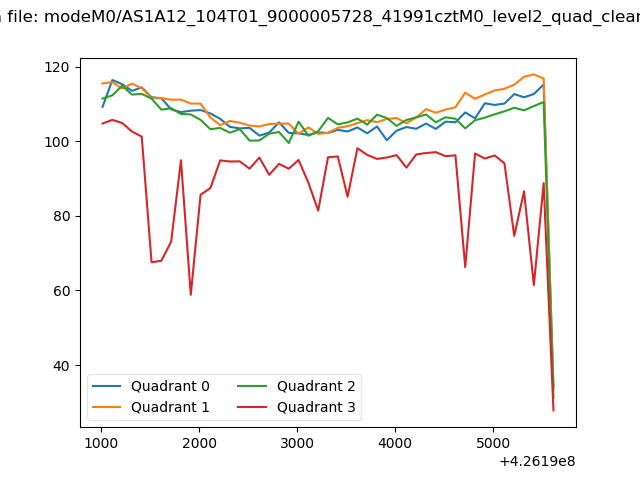 |
|
| Module-wise count rates for Quadrant A Data is divided into 100 sec bins |
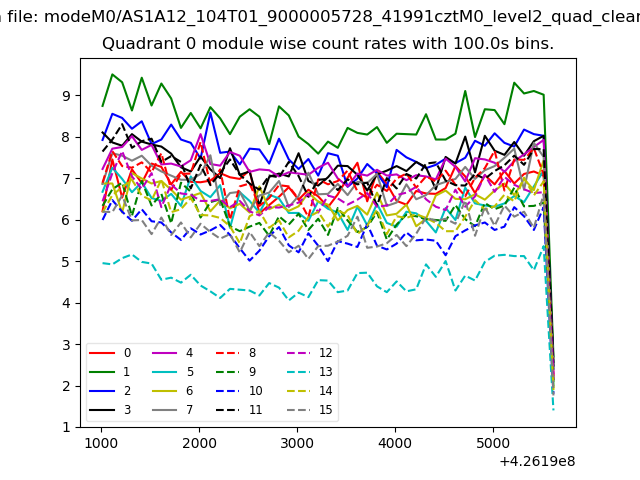 |
 |
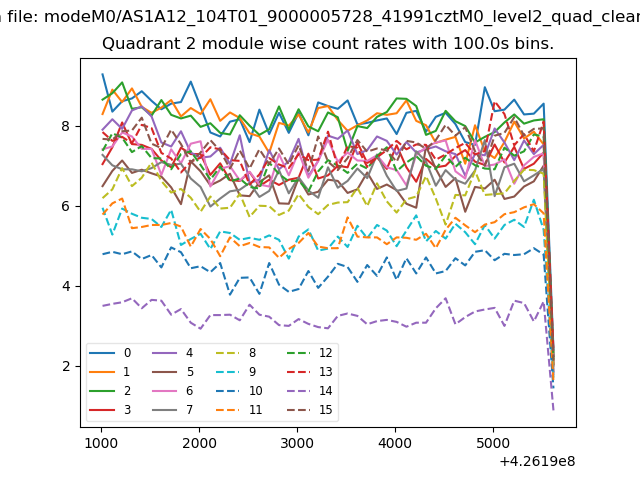
| Module-wise count rates for Quadrant B Data is divided into 100 sec bins |
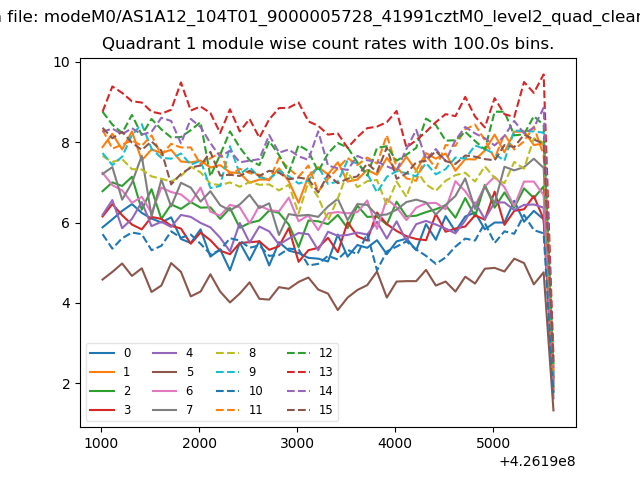 |
 |
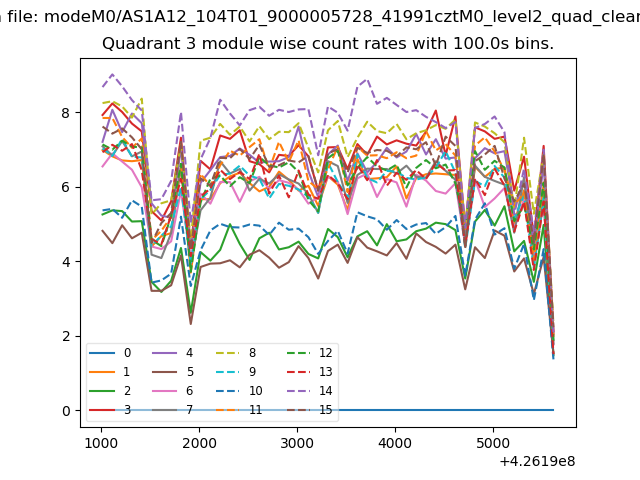
| Module-wise count rates for Quadrant C Data is divided into 100 sec bins |
 |
 |
| Module-wise count rates for Quadrant D Data is divided into 100 sec bins |
 |
 |
| Parameter | Plot |
|---|---|
| CZT HV Monitor | 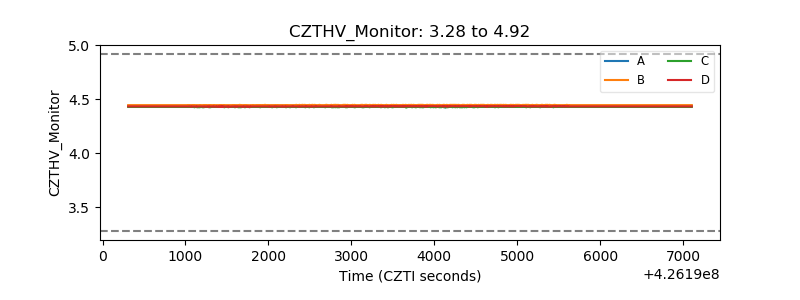 |
| D_VDD | 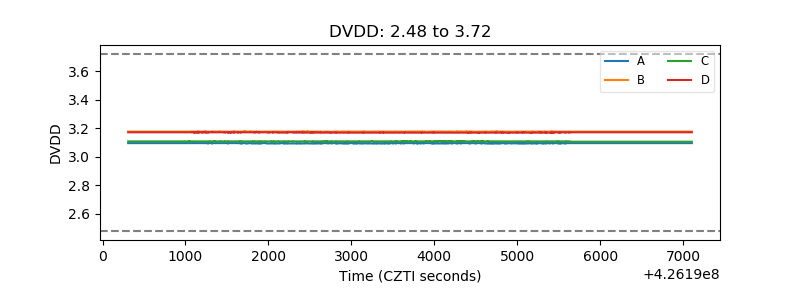 |
| Temperature 1 | 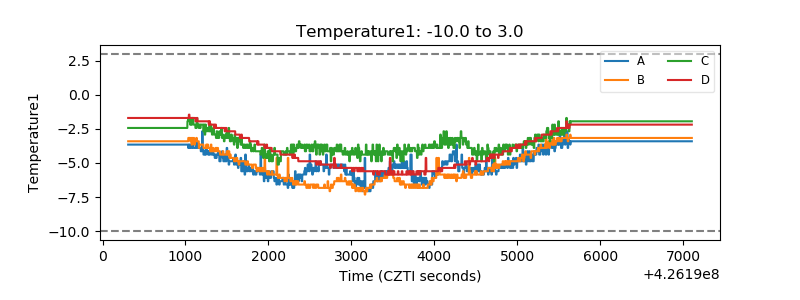 |
| Veto HV Monitor | 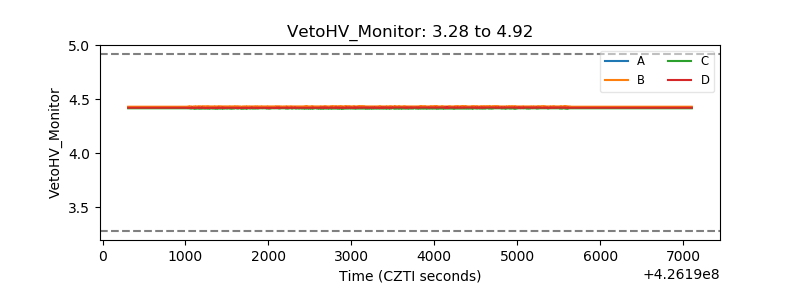 |
| Veto LLD | 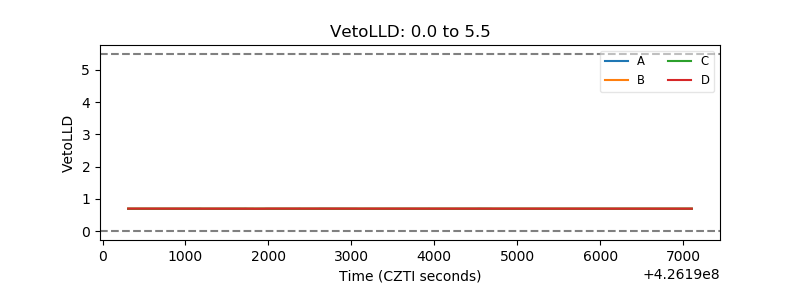 |
| Alpha Counter | 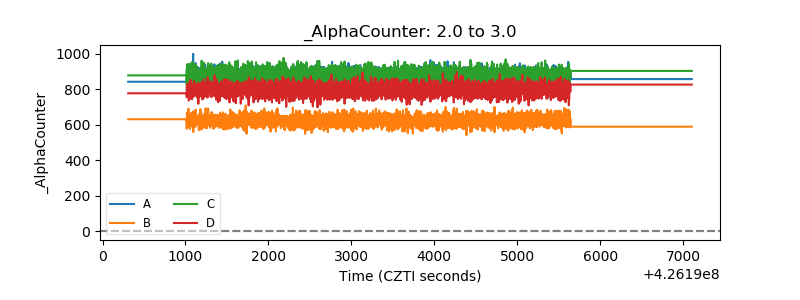 |
| _CPM_Rate |  |
| CZT Counter | 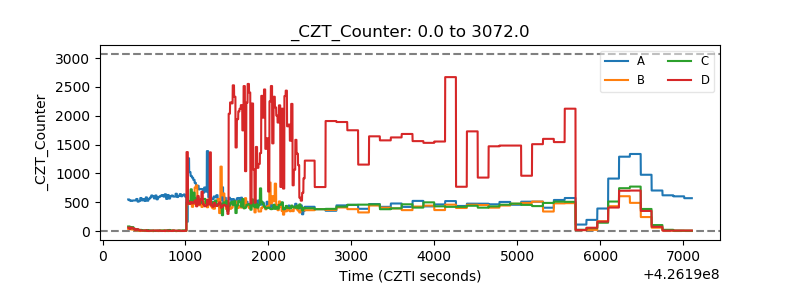 |
| +2.5 Volts monitor | 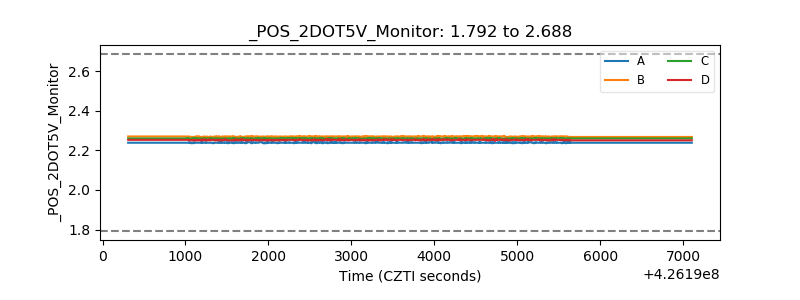 |
| +5 Volts monitor | 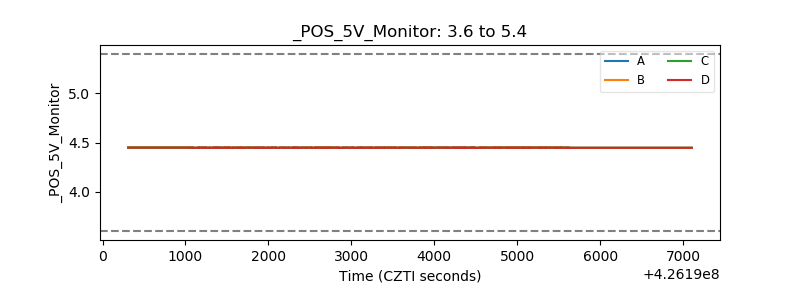 |
| _ROLL_ROT | 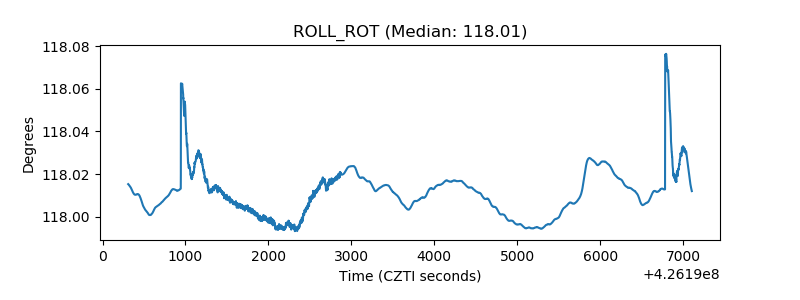 |
| _Roll_DEC | 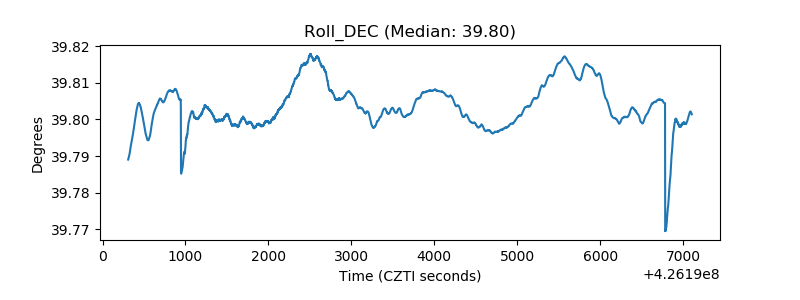 |
| _Roll_RA | 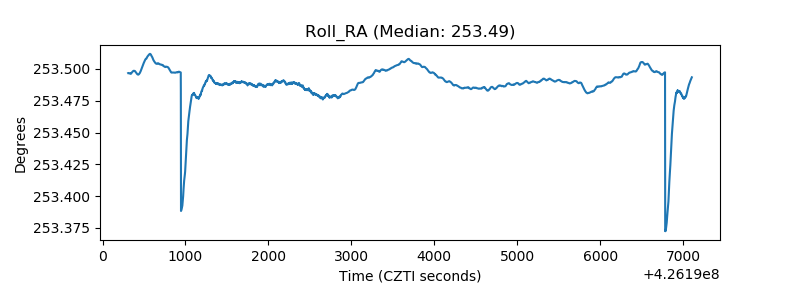 |
| Veto Counter | 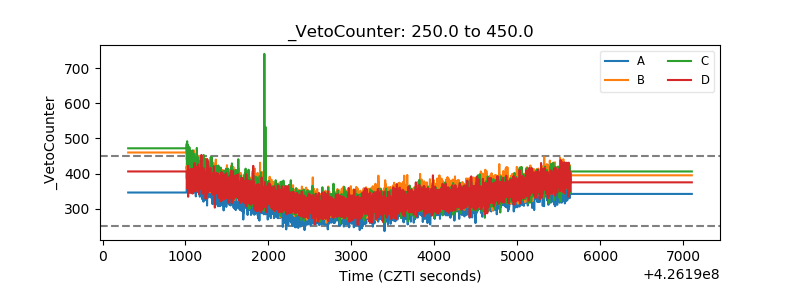 |