| Param | Original file | Final file |
|---|---|---|
| Filename | modeM0/AS1T05_132T01_9000005730_41993cztM0_level2.fits | modeM0/AS1T05_132T01_9000005730_41993cztM0_level2_quad_clean.evt |
| Size (bytes) | 413,827,200 | 78,163,200 |
| Size | 394.7 MB | 74.5 MB |
| Events in quadrant A | 2,480,641 | 536,749 |
| Events in quadrant B | 2,293,627 | 549,936 |
| Events in quadrant C | 2,215,487 | 537,292 |
| Events in quadrant D | 7,943,352 | 395,301 |
| Mode SS | |||
|---|---|---|---|
| Quadrant | BADHDUFLAG | Total packets | Discarded packets |
| A | 0 | 100 | 0 |
| B | 0 | 100 | 0 |
| C | 0 | 100 | 0 |
| D | 0 | 100 | 0 |
| Mode M0 | |||
|---|---|---|---|
| Quadrant | BADHDUFLAG | Total packets | Discarded packets |
| A | 0 | 10506 | 1 |
| B | 0 | 10489 | 1 |
| C | 0 | 9949 | 1 |
| D | 0 | 27060 | 1 |
| Mode M9 | |||
|---|---|---|---|
| Quadrant | BADHDUFLAG | Total packets | Discarded packets |
| A | 0 | 18 | 0 |
| B | 0 | 18 | 0 |
| C | 0 | 18 | 0 |
| D | 0 | 18 | 0 |
| Quadrant | Total seconds | Saturated seconds | Saturation percentage |
|---|---|---|---|
| A | 4958 | 13 | 0.262203% |
| B | 4958 | 29 | 0.584913% |
| C | 4958 | 1 | 0.020169% |
| D | 4958 | 1159 | 23.376361% |
Noise dominated data is calculated using 1-second bins in cleaned event files. If a bin has >2000 counts, and if more than 50% of those come from <1% of pixels, then it is considered to be noise-dominated and hence unusable.
| Quadrant | # 1 sec bins | Bins with >0 counts | Bins with >2000 counts | High rate bins dominated by noise | Noise dominated (total time) | Noise dominated (detector-on time) | Marked lightcurve |
|---|---|---|---|---|---|---|---|
| A | 6690 | 4959 | 6 | 6 | 0.09% | 0.12% | 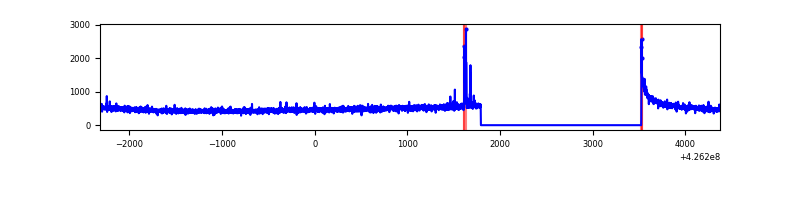 |
| B | 6690 | 4959 | 23 | 23 | 0.34% | 0.46% | 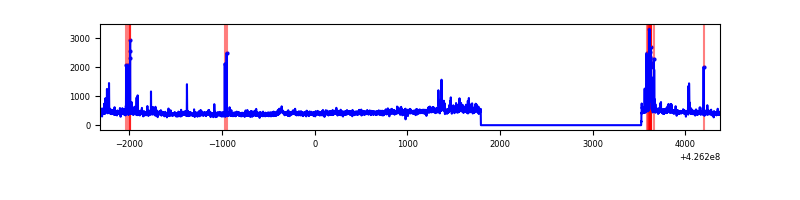 |
| C | 6690 | 4959 | 0 | 0 | 0.00% | 0.00% | 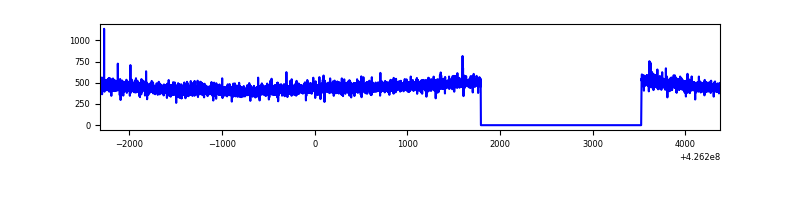 |
| D | 6690 | 4959 | 1182 | 1182 | 17.67% | 23.84% | 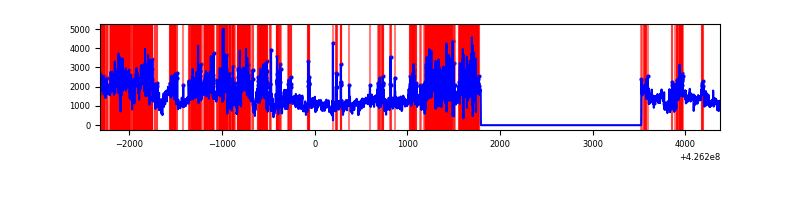 |
Top three noisy pixels from each quadrant. If the there are fewer than three noisy pixels in the level2.evt file, extra rows are filled as -1
| Pixel properties | Quadrant properties | ||||||
|---|---|---|---|---|---|---|---|
| Quadrant | DetID | PixID | Counts | Sigma | Mean | Median | Sigma |
| A | 10 | 83 | 416548 | 3870.31 | 522 | 510 | 107.5 |
| A | 15 | 223 | 32565 | 298.2 | 522 | 510 | 107.5 |
| A | 13 | 6 | 8074 | 70.37 | 522 | 510 | 107.5 |
| B | 5 | 255 | 133192 | 1315.79 | 520 | 504 | 100.8 |
| B | 0 | 156 | 54748 | 537.91 | 520 | 504 | 100.8 |
| B | 0 | 190 | 45923 | 450.39 | 520 | 504 | 100.8 |
| C | 15 | 214 | 202664 | 1664.7 | 514 | 517 | 121.4 |
| C | 8 | 229 | 6197 | 46.78 | 514 | 517 | 121.4 |
| C | 13 | 61 | 3367 | 23.47 | 514 | 517 | 121.4 |
| D | 1 | 52 | 3901991 | 33703.86 | 464 | 450 | 115.8 |
| D | 2 | 249 | 1546794 | 13358.25 | 464 | 450 | 115.8 |
| D | 13 | 249 | 401966 | 3468.54 | 464 | 450 | 115.8 |
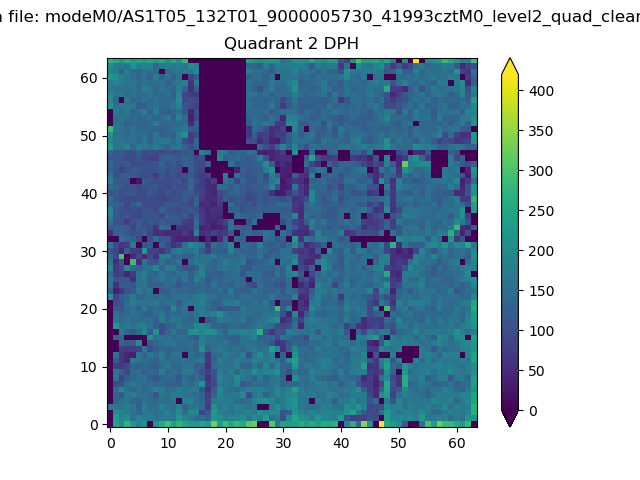
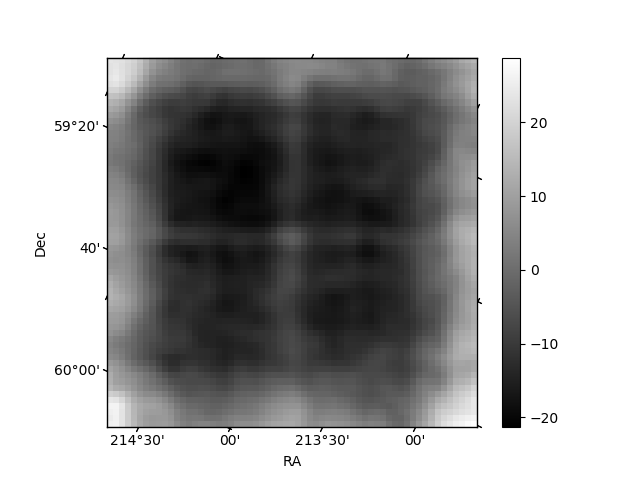
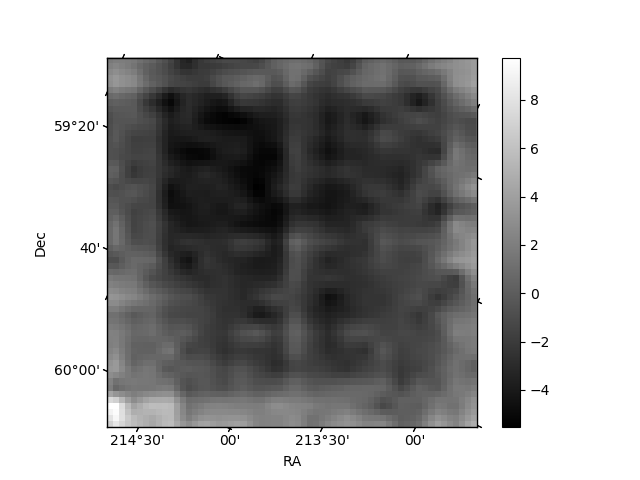
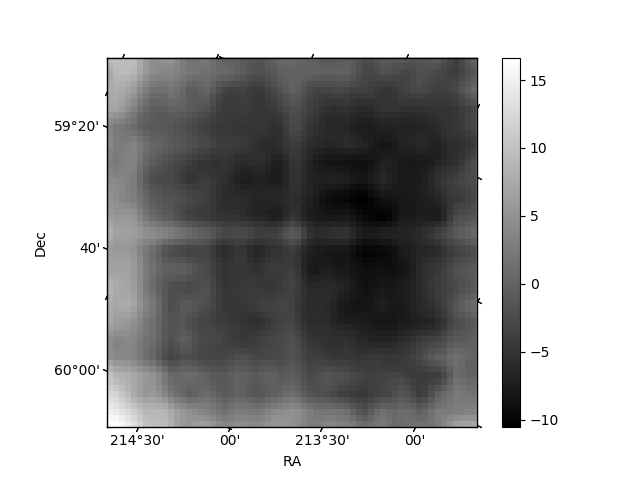
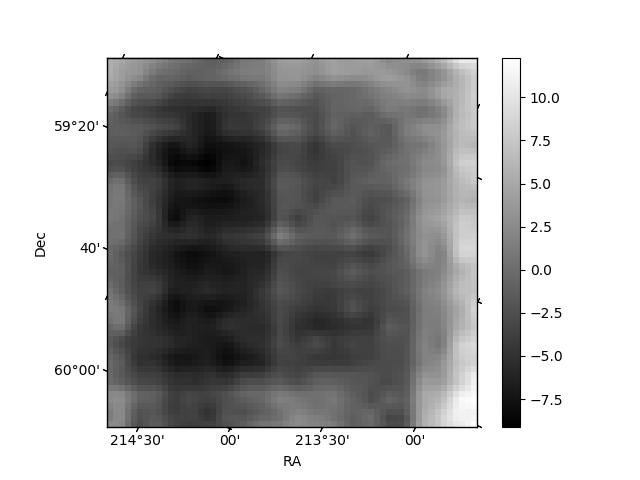
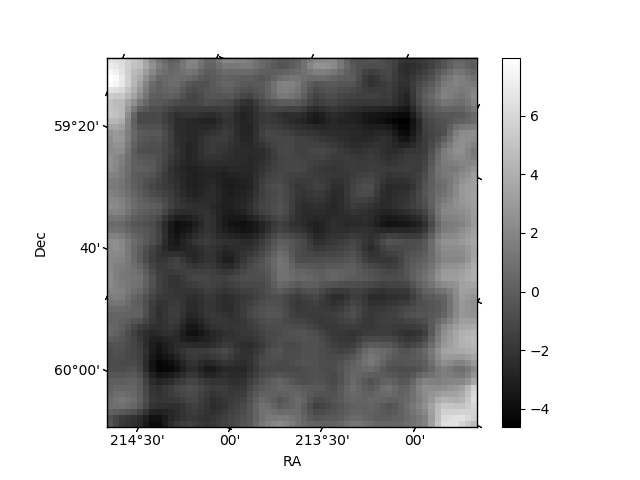
Histogram calculated using DETX and DETY for each event in the final _common_clean file
| Quadrant A | 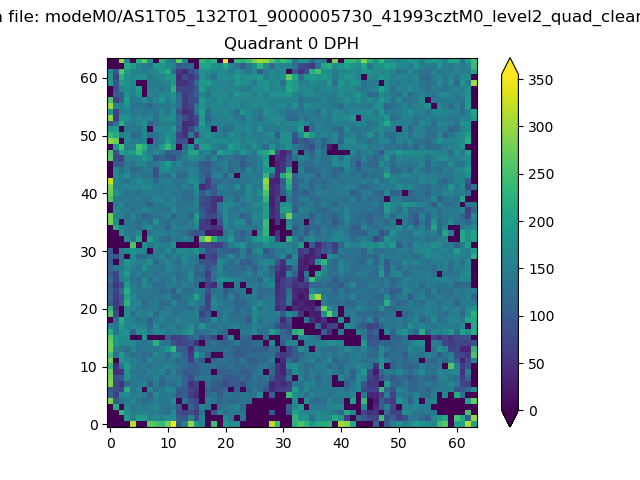 |
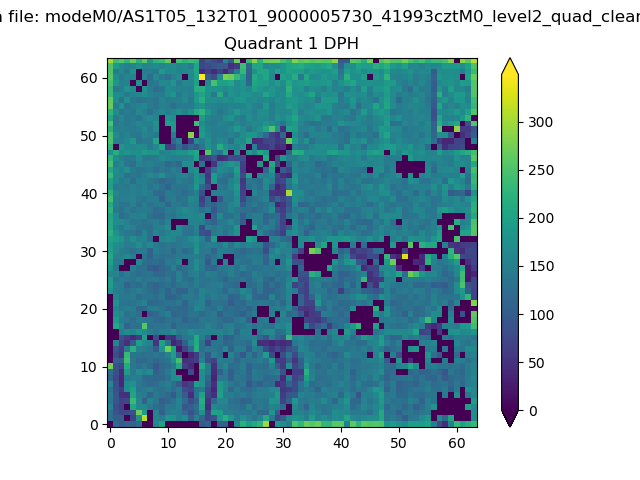 |
Quadrant B |
|---|---|---|---|
| Quadrant D | 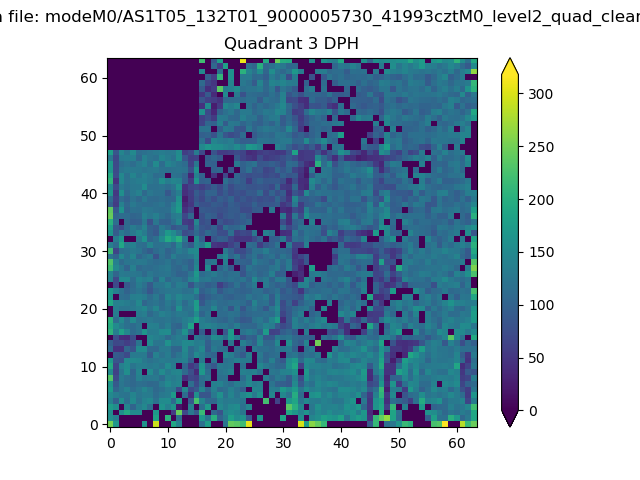 |
 |
Quadrant C |
| Plot type | Count rate plots | Images |
|---|---|---|
| Comparison with Poisson distribution Blue bars denote a histogram of data divided into 1 sec bins. Red curve is a Poisson curve with rate = median count rate of data. |
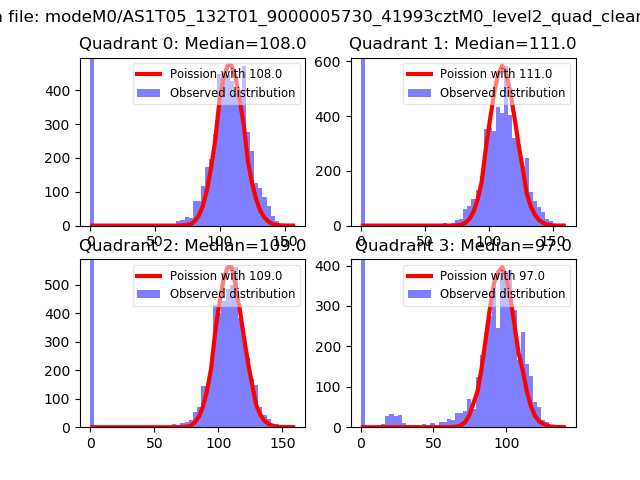 |
 |
| Quadrant-wise count rates Data is divided into 100 sec bins |
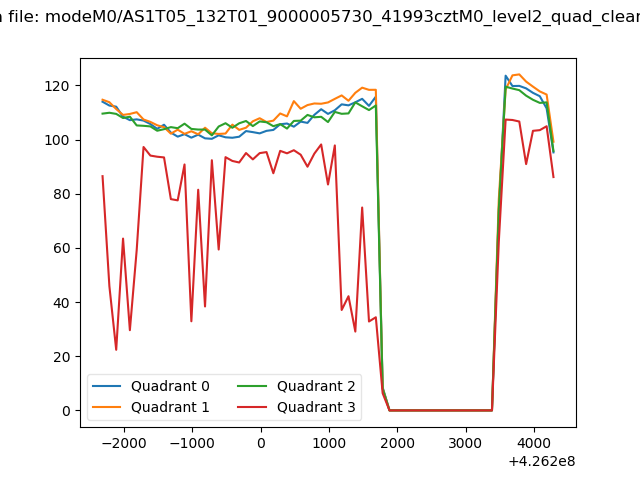 |
|
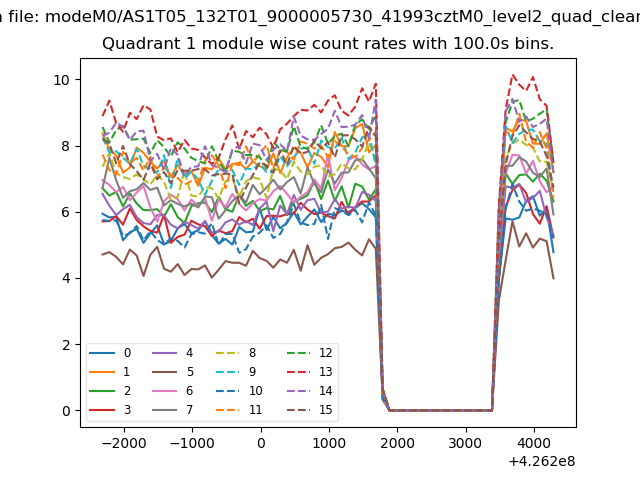
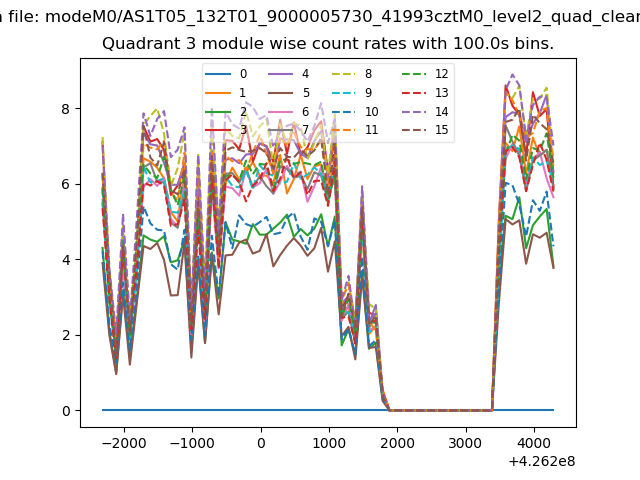
| Module-wise count rates for Quadrant A Data is divided into 100 sec bins |
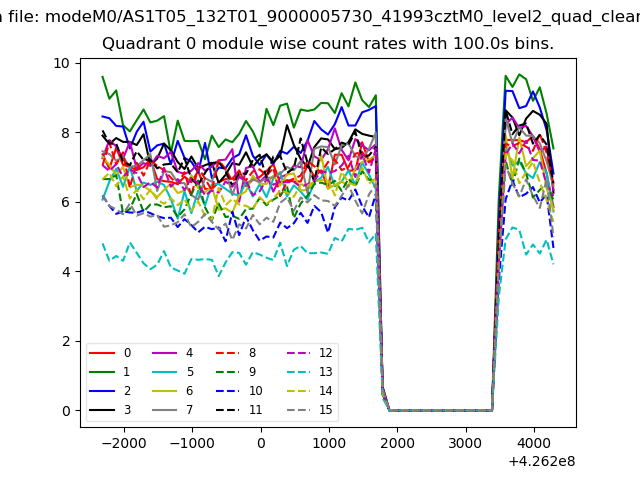 |
 |
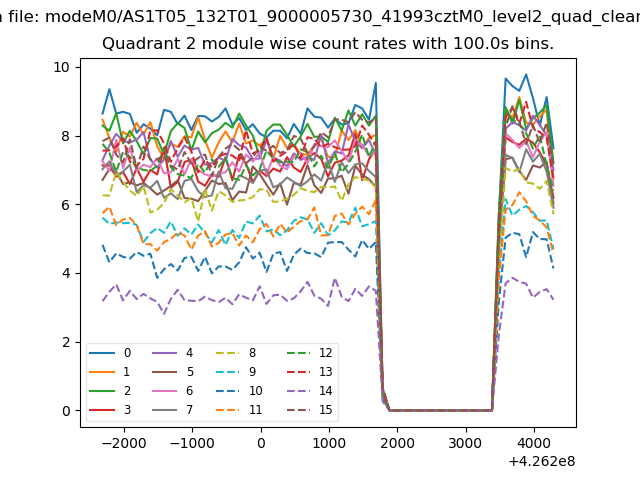
| Module-wise count rates for Quadrant B Data is divided into 100 sec bins |
 |
 |
| Module-wise count rates for Quadrant C Data is divided into 100 sec bins |
 |
 |
| Module-wise count rates for Quadrant D Data is divided into 100 sec bins |
 |
 |
| Parameter | Plot |
|---|---|
| CZT HV Monitor | 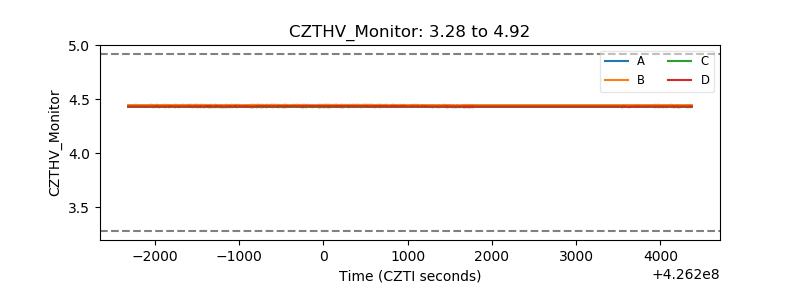 |
| D_VDD | 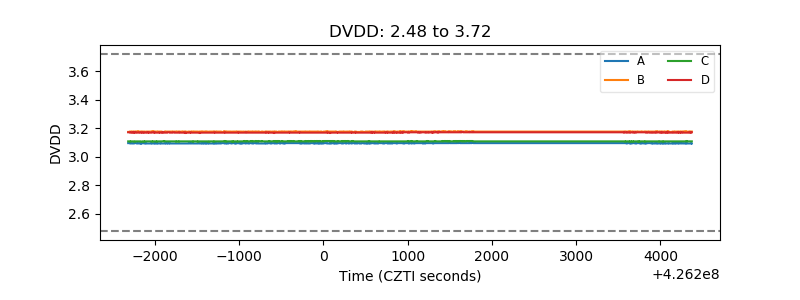 |
| Temperature 1 | 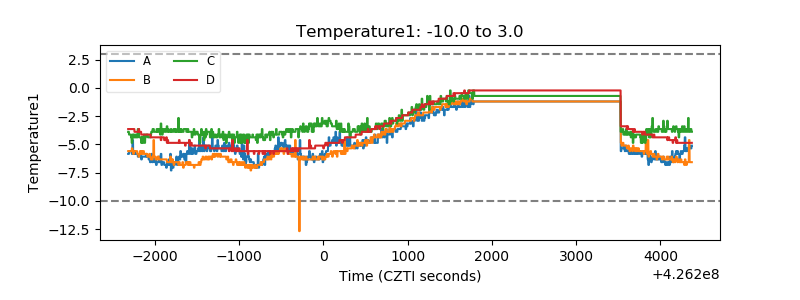 |
| Veto HV Monitor | 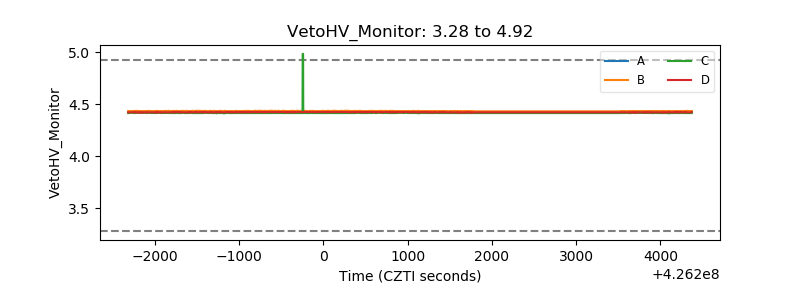 |
| Veto LLD | 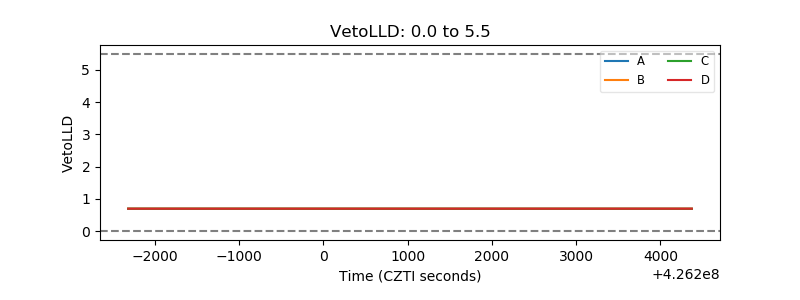 |
| Alpha Counter | 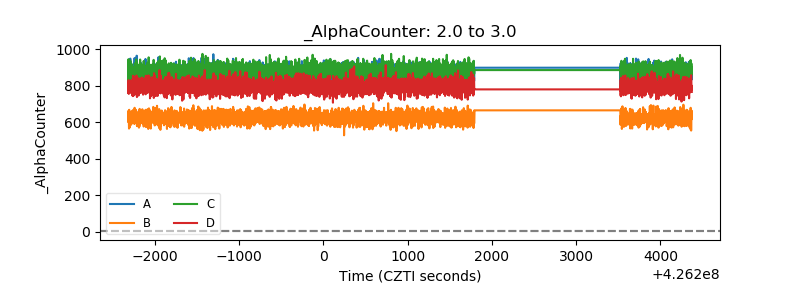 |
| _CPM_Rate | 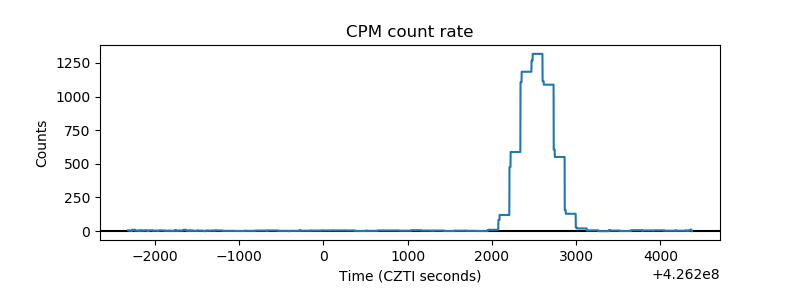 |
| CZT Counter | 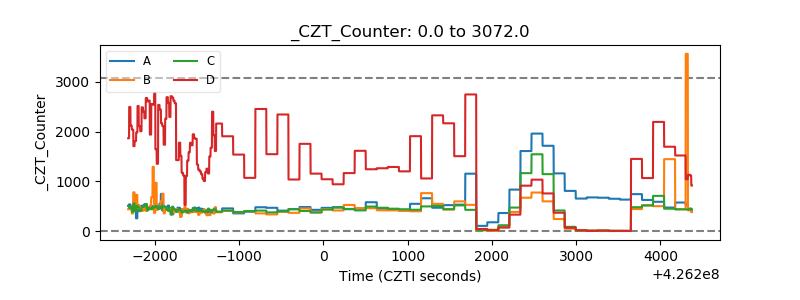 |
| +2.5 Volts monitor | 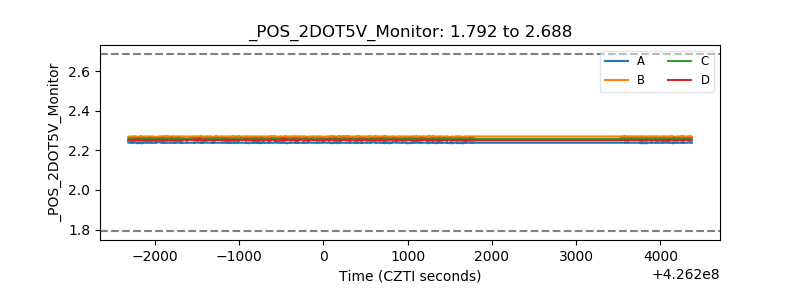 |
| +5 Volts monitor |  |
| _ROLL_ROT | 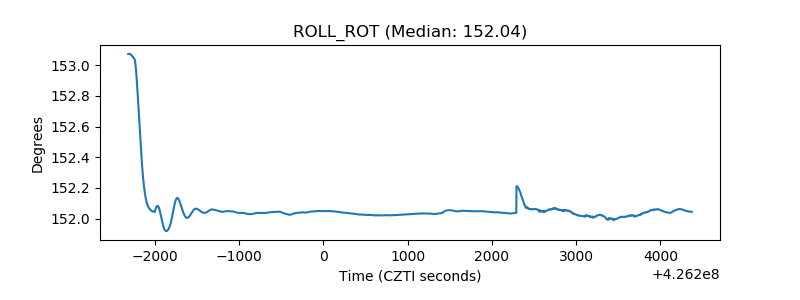 |
| _Roll_DEC | 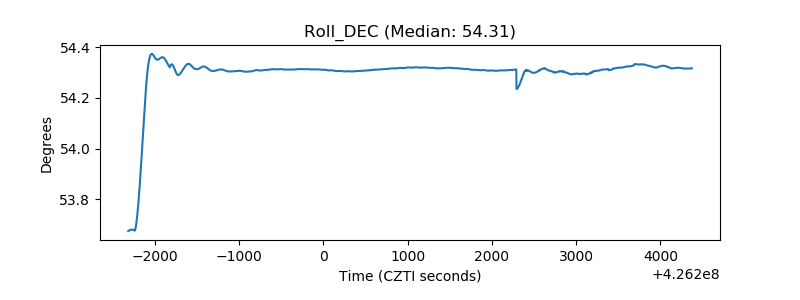 |
| _Roll_RA | 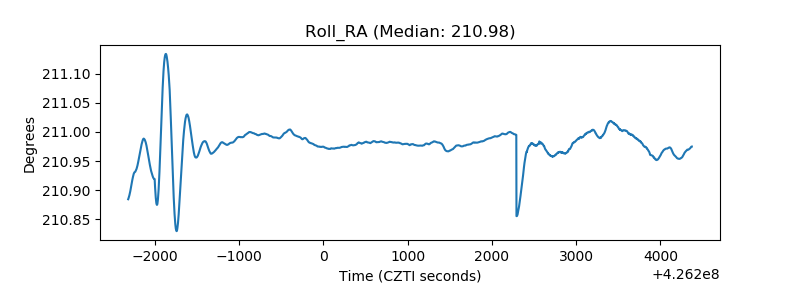 |
| Veto Counter |  |