| Param | Original file | Final file |
|---|---|---|
| Filename | modeM0/AS1T05_132T01_9000005730_41994cztM0_level2.fits | modeM0/AS1T05_132T01_9000005730_41994cztM0_level2_quad_clean.evt |
| Size (bytes) | 400,919,040 | 87,906,240 |
| Size | 382.3 MB | 83.8 MB |
| Events in quadrant A | 2,767,138 | 585,732 |
| Events in quadrant B | 2,438,517 | 606,363 |
| Events in quadrant C | 2,409,093 | 587,714 |
| Events in quadrant D | 6,818,040 | 513,884 |
| Mode SS | |||
|---|---|---|---|
| Quadrant | BADHDUFLAG | Total packets | Discarded packets |
| A | 0 | 108 | 0 |
| B | 0 | 108 | 0 |
| C | 0 | 108 | 0 |
| D | 0 | 108 | 0 |
| Mode M0 | |||
|---|---|---|---|
| Quadrant | BADHDUFLAG | Total packets | Discarded packets |
| A | 0 | 11479 | 2 |
| B | 0 | 10985 | 2 |
| C | 0 | 10565 | 2 |
| D | 0 | 23997 | 2 |
| Mode M9 | |||
|---|---|---|---|
| Quadrant | BADHDUFLAG | Total packets | Discarded packets |
| A | 0 | 33 | 0 |
| B | 0 | 34 | 0 |
| C | 0 | 34 | 0 |
| D | 0 | 34 | 0 |
| Quadrant | Total seconds | Saturated seconds | Saturation percentage |
|---|---|---|---|
| A | 5252 | 10 | 0.190404% |
| B | 5252 | 22 | 0.418888% |
| C | 5252 | 5 | 0.095202% |
| D | 5252 | 379 | 7.216299% |
Noise dominated data is calculated using 1-second bins in cleaned event files. If a bin has >2000 counts, and if more than 50% of those come from <1% of pixels, then it is considered to be noise-dominated and hence unusable.
| Quadrant | # 1 sec bins | Bins with >0 counts | Bins with >2000 counts | High rate bins dominated by noise | Noise dominated (total time) | Noise dominated (detector-on time) | Marked lightcurve |
|---|---|---|---|---|---|---|---|
| A | 7134 | 5253 | 5 | 5 | 0.07% | 0.10% | 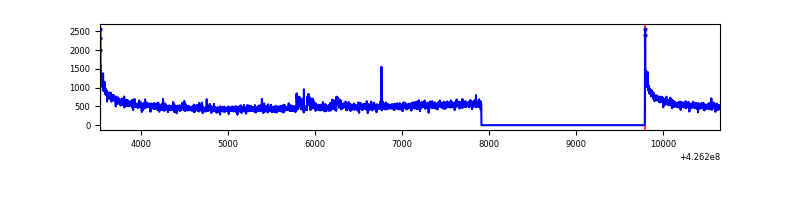 |
| B | 7134 | 5253 | 18 | 18 | 0.25% | 0.34% | 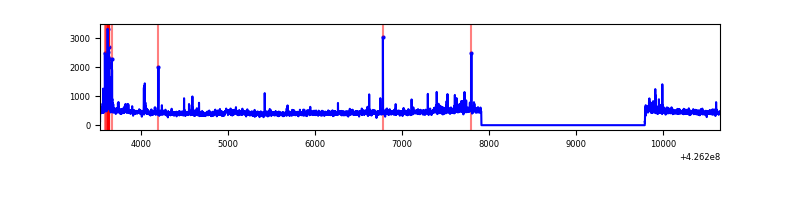 |
| C | 7134 | 5253 | 1 | 1 | 0.01% | 0.02% | 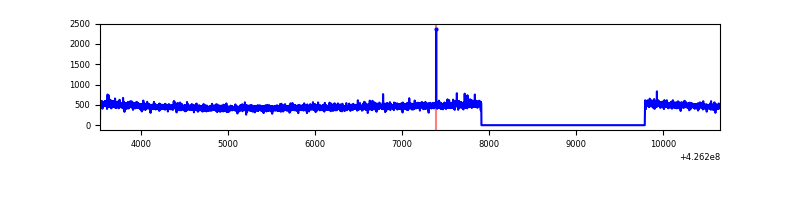 |
| D | 7134 | 5253 | 348 | 348 | 4.88% | 6.62% | 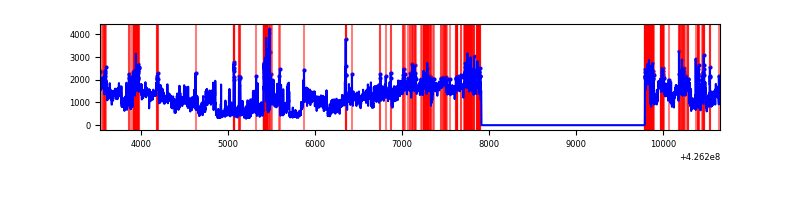 |
Top three noisy pixels from each quadrant. If the there are fewer than three noisy pixels in the level2.evt file, extra rows are filled as -1
| Pixel properties | Quadrant properties | ||||||
|---|---|---|---|---|---|---|---|
| Quadrant | DetID | PixID | Counts | Sigma | Mean | Median | Sigma |
| A | 10 | 83 | 532928 | 4613.77 | 564 | 552 | 115.4 |
| A | 2 | 79 | 40895 | 349.63 | 564 | 552 | 115.4 |
| A | 3 | 137 | 6222 | 49.14 | 564 | 552 | 115.4 |
| B | 5 | 255 | 111992 | 1018.06 | 566 | 549 | 109.5 |
| B | 0 | 190 | 68023 | 616.39 | 566 | 549 | 109.5 |
| B | 0 | 156 | 27982 | 250.61 | 566 | 549 | 109.5 |
| C | 15 | 214 | 218189 | 1678.86 | 558 | 561 | 129.6 |
| C | 12 | 249 | 5269 | 36.32 | 558 | 561 | 129.6 |
| C | 8 | 229 | 5107 | 35.07 | 558 | 561 | 129.6 |
| D | 1 | 52 | 4057337 | 30889.24 | 538 | 524 | 131.3 |
| D | 13 | 249 | 204755 | 1555.05 | 538 | 524 | 131.3 |
| D | 2 | 249 | 179447 | 1362.35 | 538 | 524 | 131.3 |
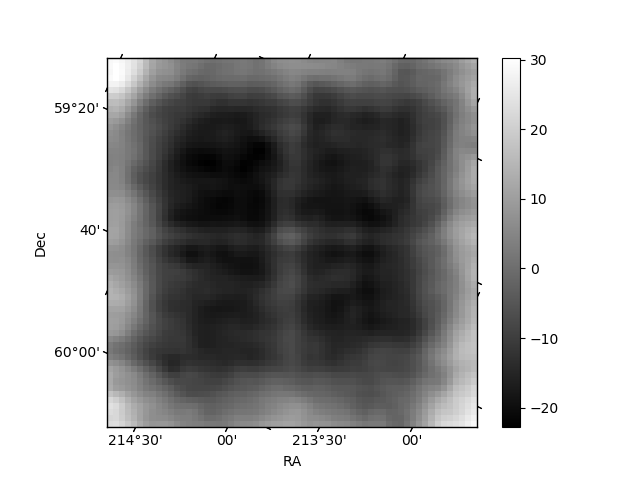
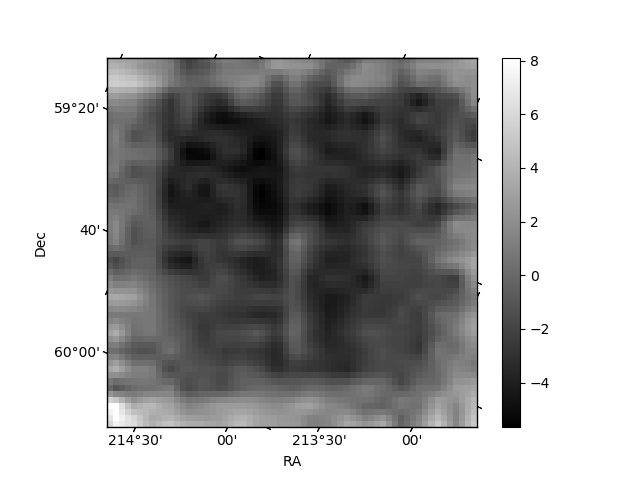
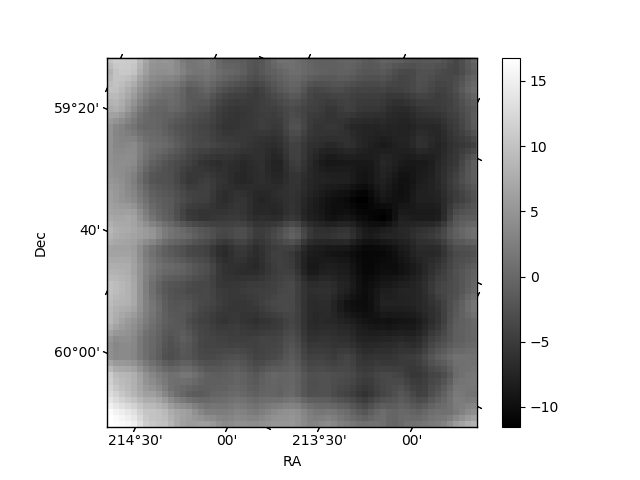
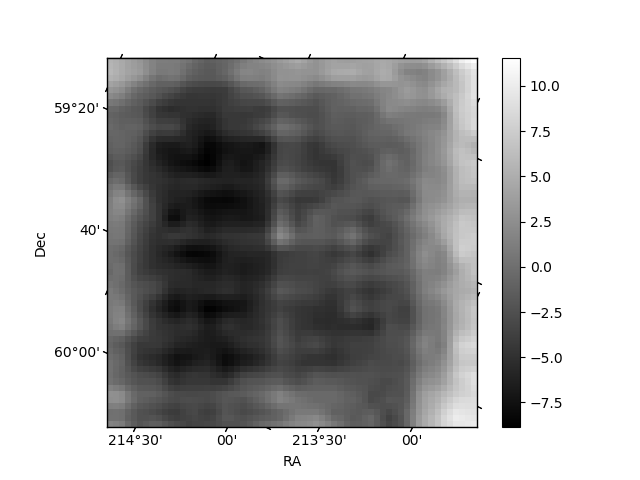
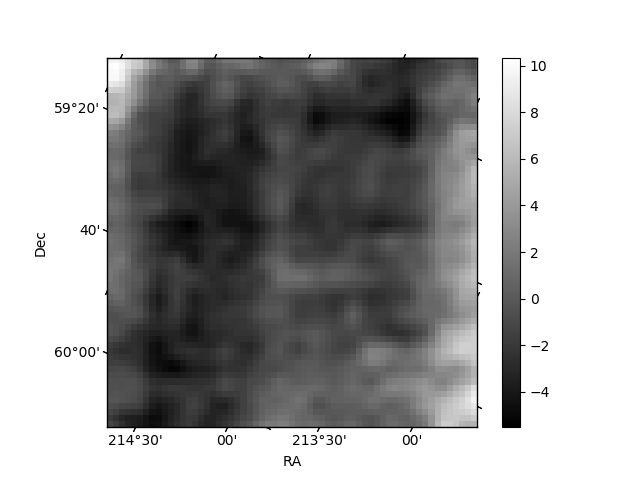
Histogram calculated using DETX and DETY for each event in the final _common_clean file
| Quadrant A | 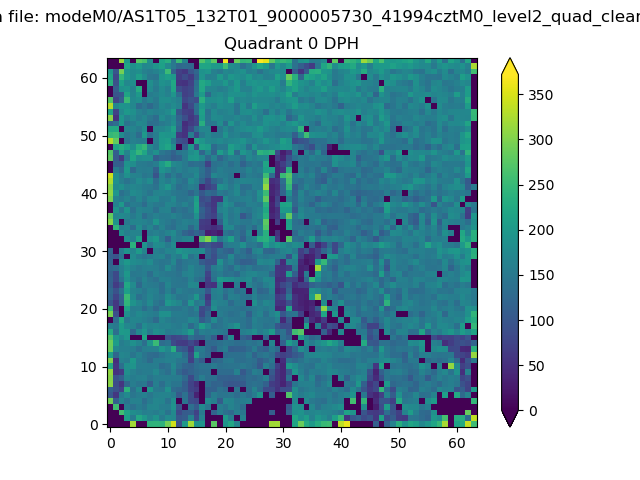 |
 |
Quadrant B |
|---|---|---|---|
| Quadrant D | 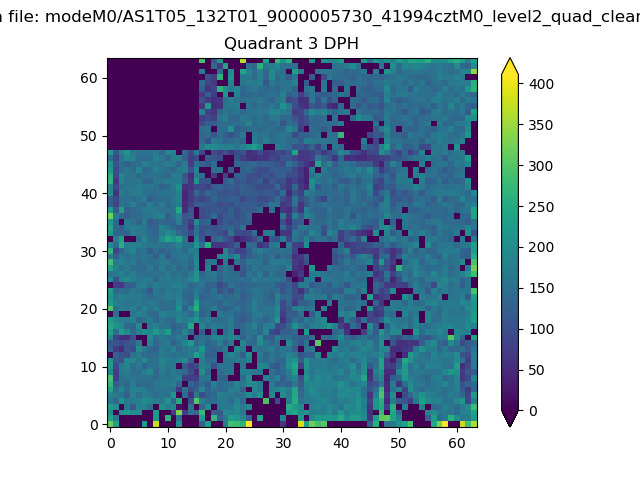 |
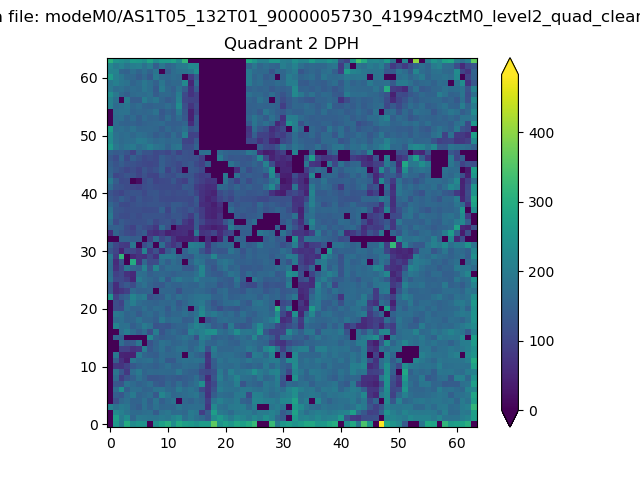 |
Quadrant C |
| Plot type | Count rate plots | Images |
|---|---|---|
| Comparison with Poisson distribution Blue bars denote a histogram of data divided into 1 sec bins. Red curve is a Poisson curve with rate = median count rate of data. |
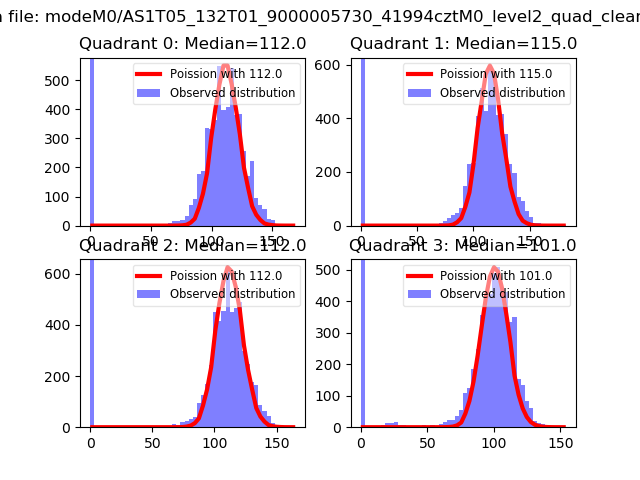 |
 |
| Quadrant-wise count rates Data is divided into 100 sec bins |
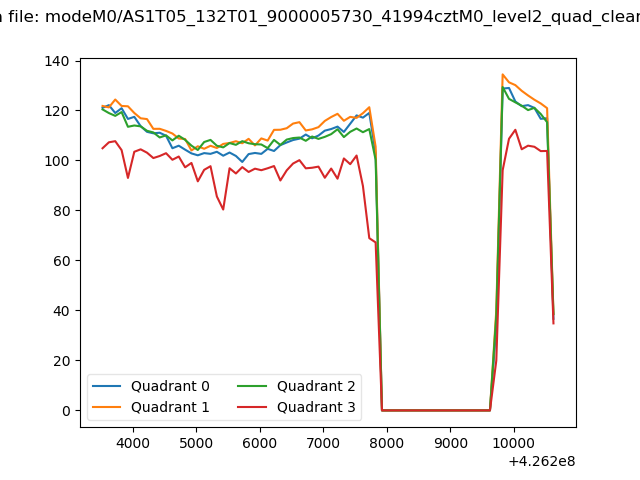 |
|
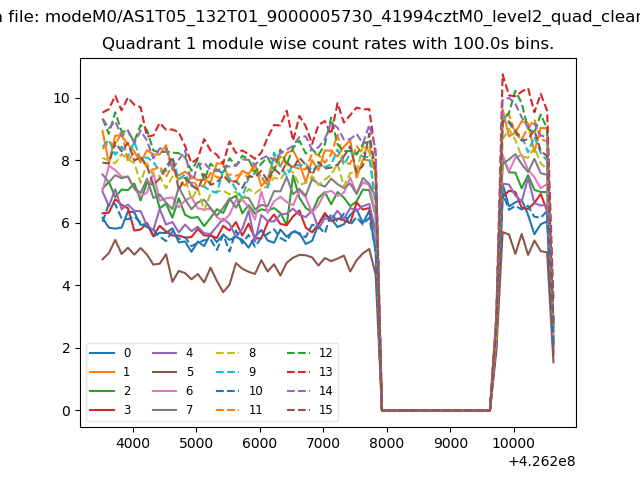
| Module-wise count rates for Quadrant A Data is divided into 100 sec bins |
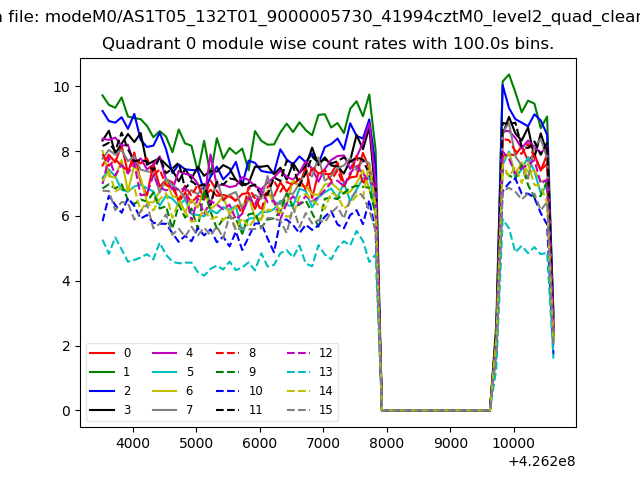 |
 |
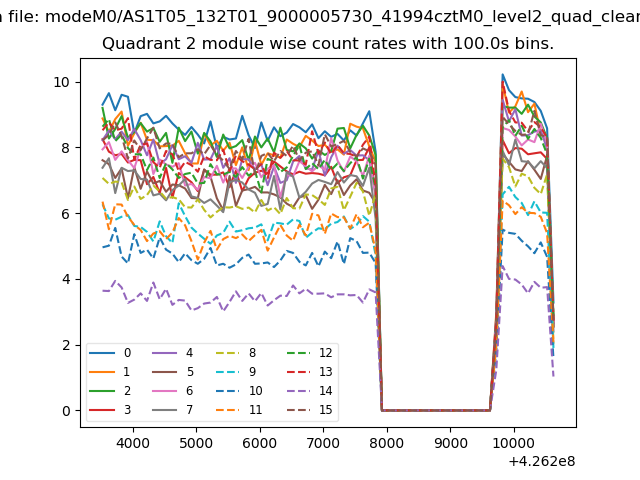
| Module-wise count rates for Quadrant B Data is divided into 100 sec bins |
 |
 |
| Module-wise count rates for Quadrant C Data is divided into 100 sec bins |
 |
 |
| Module-wise count rates for Quadrant D Data is divided into 100 sec bins |
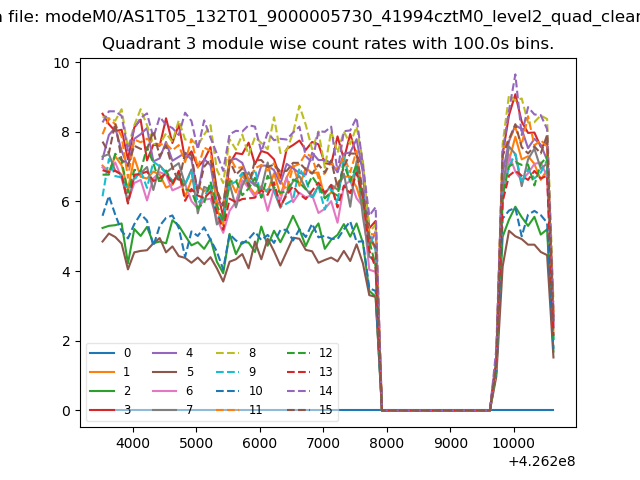 |
 |
| Parameter | Plot |
|---|---|
| CZT HV Monitor | 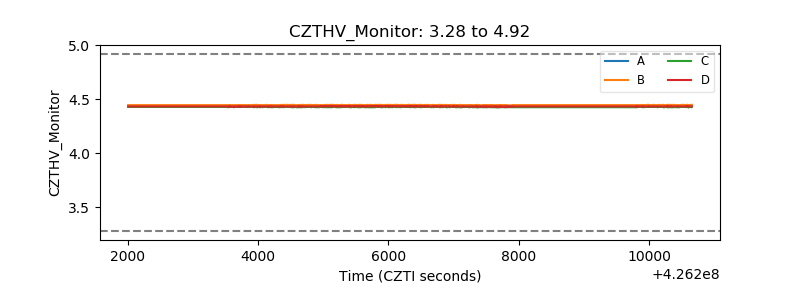 |
| D_VDD | 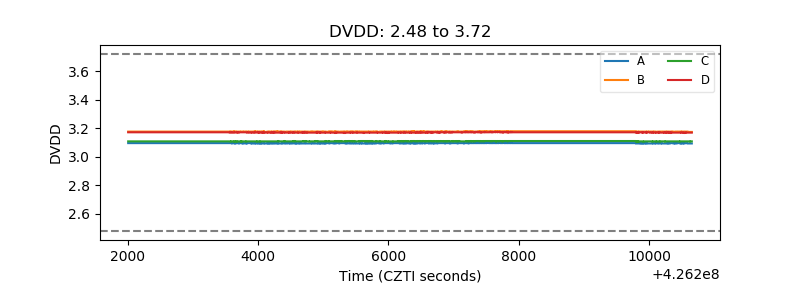 |
| Temperature 1 | 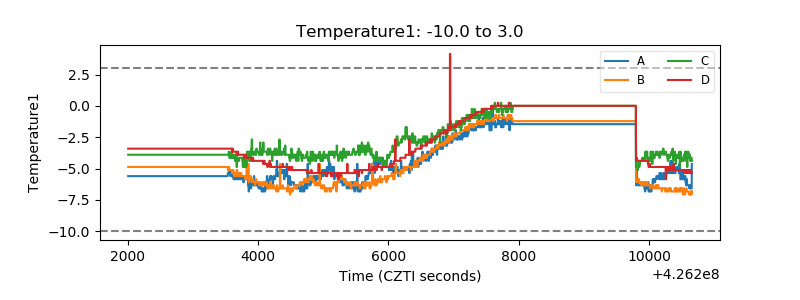 |
| Veto HV Monitor |  |
| Veto LLD | 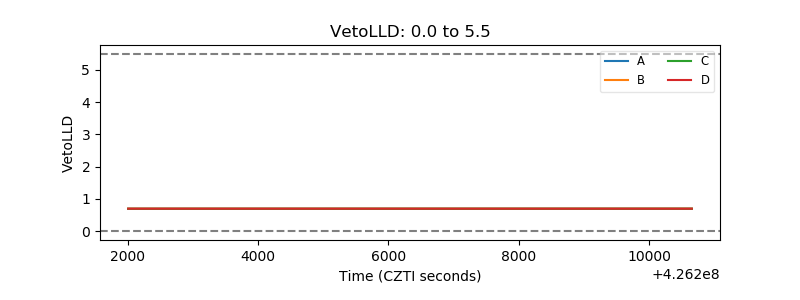 |
| Alpha Counter | 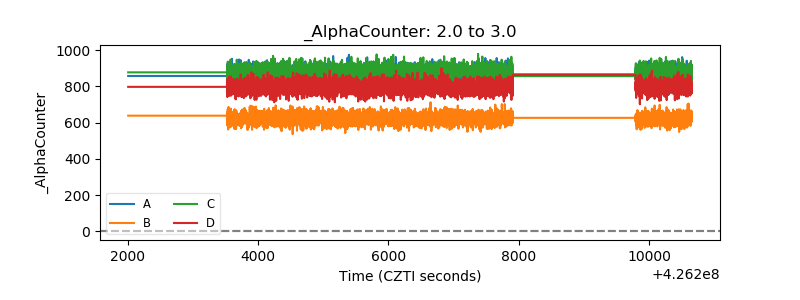 |
| _CPM_Rate | 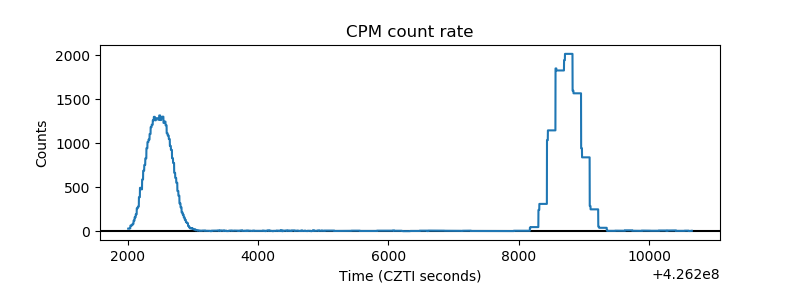 |
| CZT Counter | 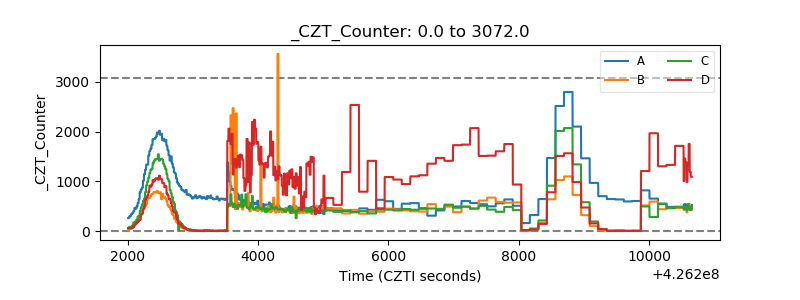 |
| +2.5 Volts monitor | 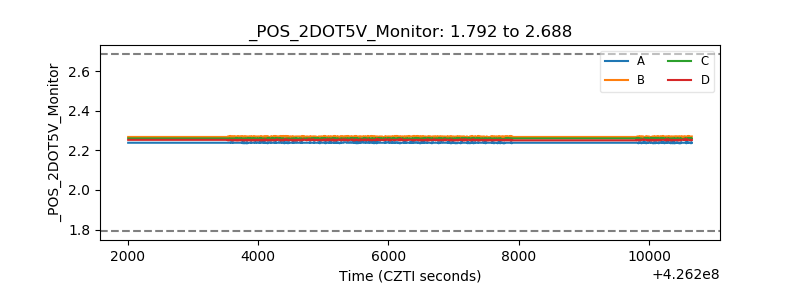 |
| +5 Volts monitor | 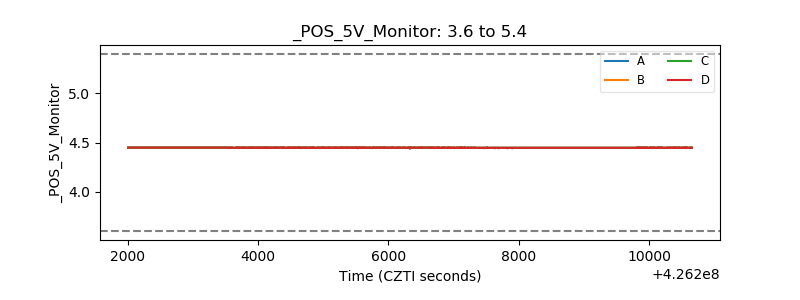 |
| _ROLL_ROT | 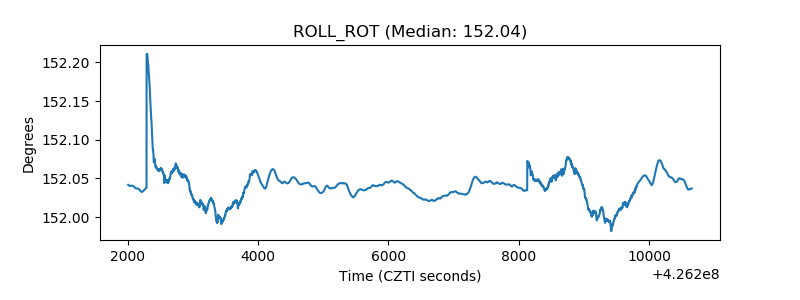 |
| _Roll_DEC | 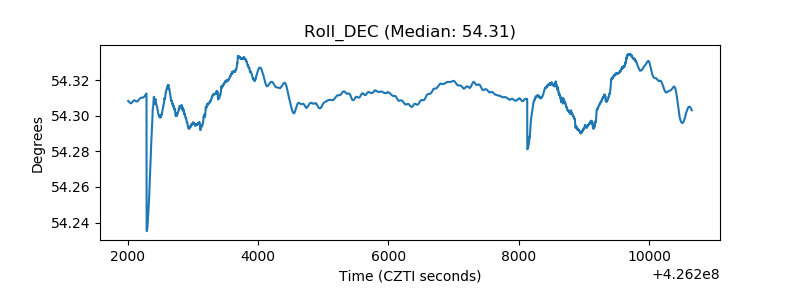 |
| _Roll_RA | 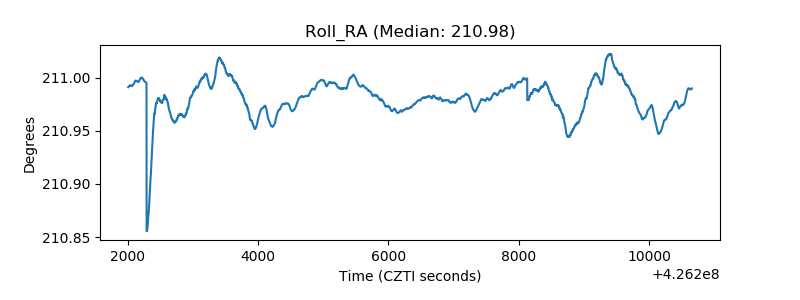 |
| Veto Counter | 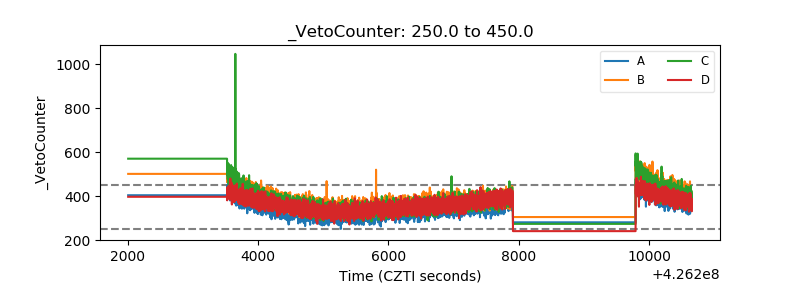 |