| Param | Original file | Final file |
|---|---|---|
| Filename | modeM0/AS1T05_132T01_9000005730_41995cztM0_level2.fits | modeM0/AS1T05_132T01_9000005730_41995cztM0_level2_quad_clean.evt |
| Size (bytes) | 405,429,120 | 90,794,880 |
| Size | 386.6 MB | 86.6 MB |
| Events in quadrant A | 2,917,479 | 612,823 |
| Events in quadrant B | 2,451,928 | 633,677 |
| Events in quadrant C | 2,452,140 | 610,636 |
| Events in quadrant D | 6,776,855 | 523,036 |
| Mode SS | |||
|---|---|---|---|
| Quadrant | BADHDUFLAG | Total packets | Discarded packets |
| A | 0 | 108 | 0 |
| B | 0 | 108 | 0 |
| C | 0 | 108 | 0 |
| D | 0 | 108 | 0 |
| Mode M0 | |||
|---|---|---|---|
| Quadrant | BADHDUFLAG | Total packets | Discarded packets |
| A | 0 | 11843 | 2 |
| B | 0 | 10894 | 3 |
| C | 0 | 10579 | 2 |
| D | 0 | 23865 | 2 |
| Mode M9 | |||
|---|---|---|---|
| Quadrant | BADHDUFLAG | Total packets | Discarded packets |
| A | 0 | 33 | 0 |
| B | 0 | 34 | 0 |
| C | 0 | 34 | 0 |
| D | 0 | 34 | 0 |
| Quadrant | Total seconds | Saturated seconds | Saturation percentage |
|---|---|---|---|
| A | 5271 | 9 | 0.170746% |
| B | 5270 | 21 | 0.398482% |
| C | 5270 | 3 | 0.056926% |
| D | 5270 | 414 | 7.855787% |
Noise dominated data is calculated using 1-second bins in cleaned event files. If a bin has >2000 counts, and if more than 50% of those come from <1% of pixels, then it is considered to be noise-dominated and hence unusable.
| Quadrant | # 1 sec bins | Bins with >0 counts | Bins with >2000 counts | High rate bins dominated by noise | Noise dominated (total time) | Noise dominated (detector-on time) | Marked lightcurve |
|---|---|---|---|---|---|---|---|
| A | 7274 | 5272 | 5 | 5 | 0.07% | 0.09% | 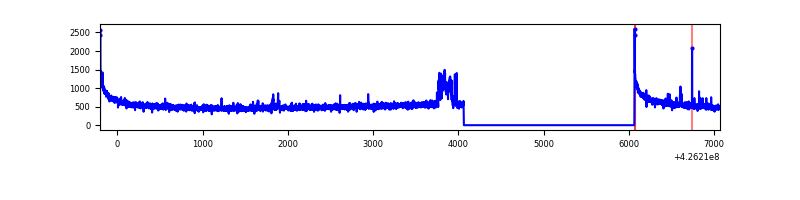 |
| B | 7273 | 5271 | 10 | 10 | 0.14% | 0.19% | 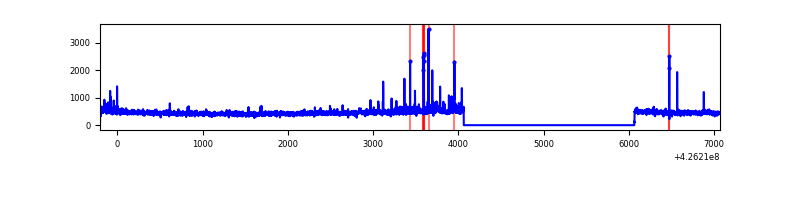 |
| C | 7273 | 5271 | 0 | 0 | 0.00% | 0.00% | 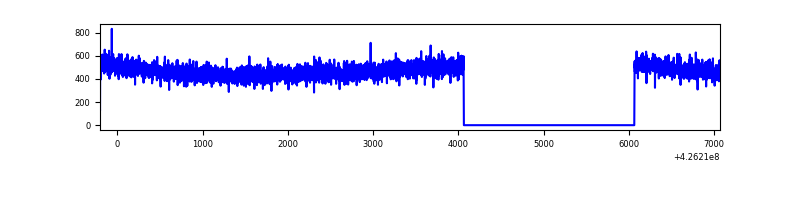 |
| D | 7273 | 5271 | 356 | 356 | 4.89% | 6.75% | 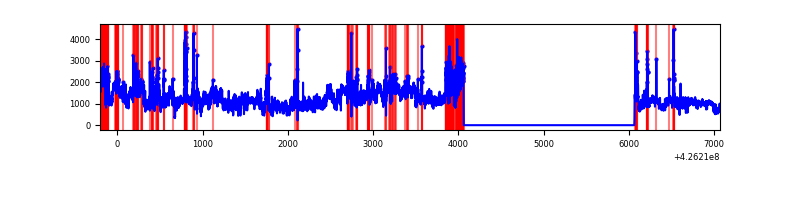 |
Top three noisy pixels from each quadrant. If the there are fewer than three noisy pixels in the level2.evt file, extra rows are filled as -1
| Pixel properties | Quadrant properties | ||||||
|---|---|---|---|---|---|---|---|
| Quadrant | DetID | PixID | Counts | Sigma | Mean | Median | Sigma |
| A | 10 | 83 | 542280 | 4579.82 | 581 | 570 | 118.3 |
| A | 2 | 79 | 119712 | 1007.27 | 581 | 570 | 118.3 |
| A | 3 | 137 | 6306 | 48.49 | 581 | 570 | 118.3 |
| B | 0 | 190 | 61594 | 541.8 | 581 | 565 | 112.6 |
| B | 5 | 255 | 38581 | 337.5 | 581 | 565 | 112.6 |
| B | 0 | 186 | 24789 | 215.06 | 581 | 565 | 112.6 |
| C | 15 | 214 | 220091 | 1654.12 | 569 | 573 | 132.7 |
| C | 8 | 229 | 9522 | 67.43 | 569 | 573 | 132.7 |
| C | 13 | 61 | 3869 | 24.84 | 569 | 573 | 132.7 |
| D | 1 | 52 | 4030004 | 30214.58 | 544 | 528 | 133.4 |
| D | 2 | 249 | 213302 | 1595.46 | 544 | 528 | 133.4 |
| D | 13 | 249 | 138879 | 1037.41 | 544 | 528 | 133.4 |
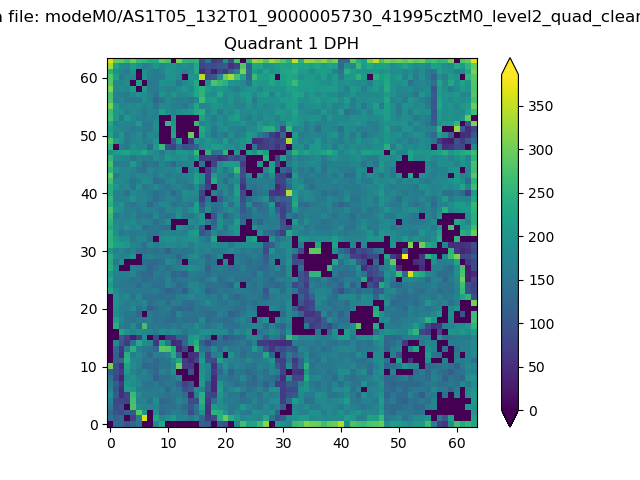
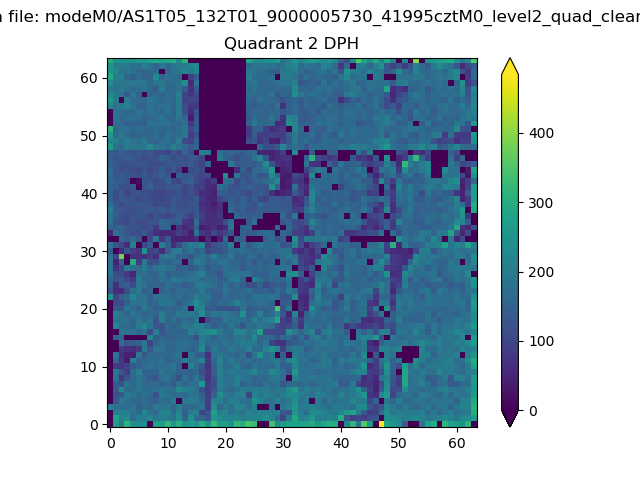
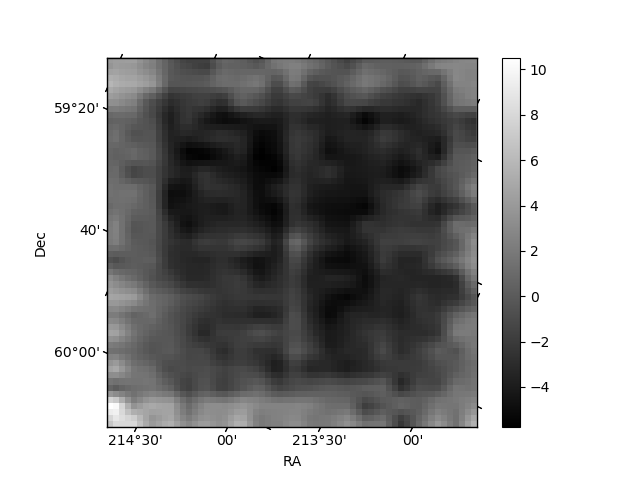
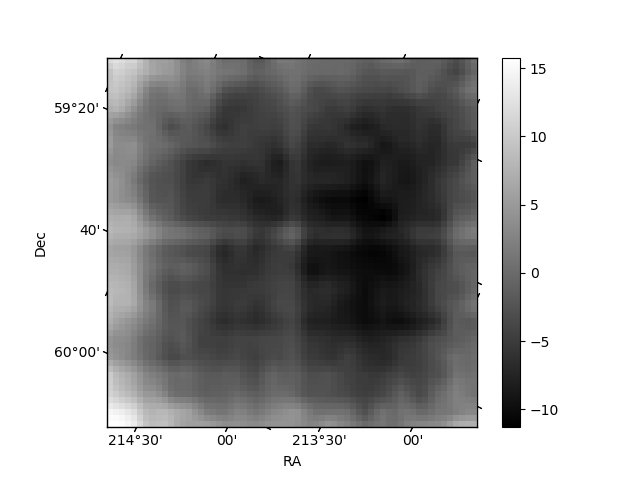
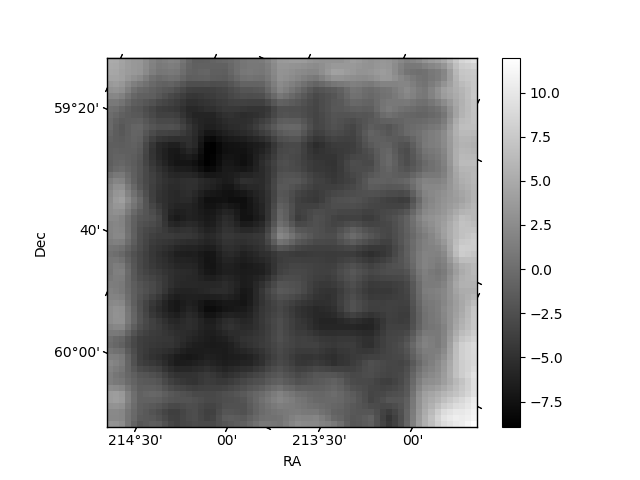
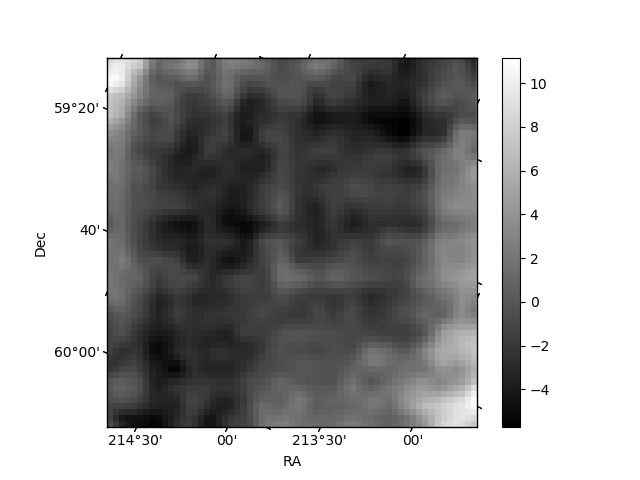
Histogram calculated using DETX and DETY for each event in the final _common_clean file
| Quadrant A |  |
 |
Quadrant B |
|---|---|---|---|
| Quadrant D |  |
 |
Quadrant C |
| Plot type | Count rate plots | Images |
|---|---|---|
| Comparison with Poisson distribution Blue bars denote a histogram of data divided into 1 sec bins. Red curve is a Poisson curve with rate = median count rate of data. |
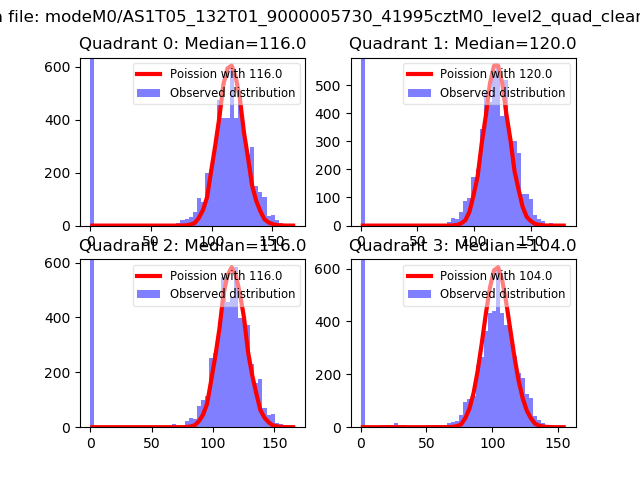 |
 |
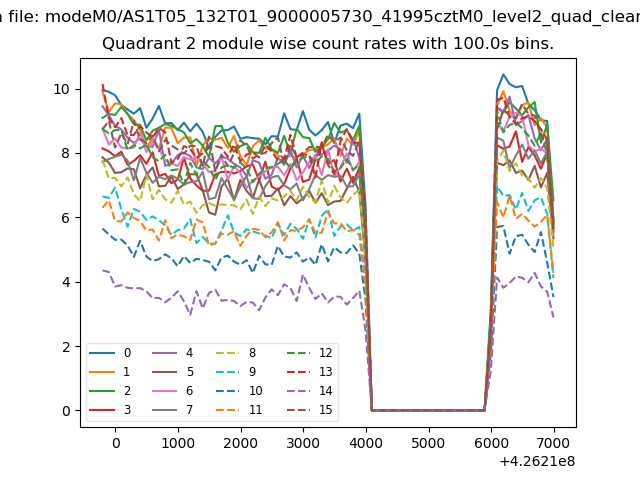
| Quadrant-wise count rates Data is divided into 100 sec bins |
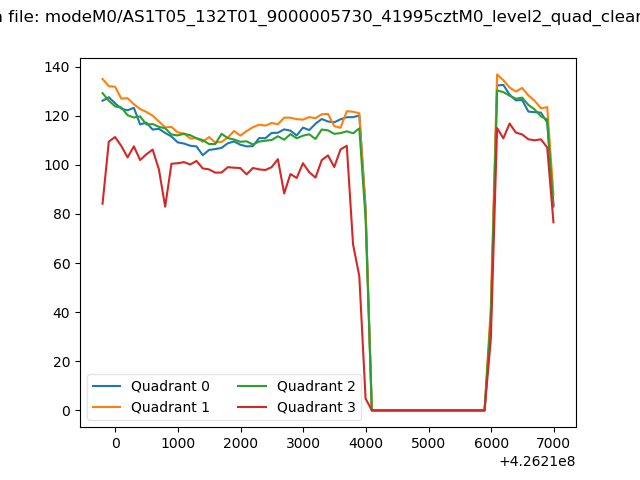 |
|
| Module-wise count rates for Quadrant A Data is divided into 100 sec bins |
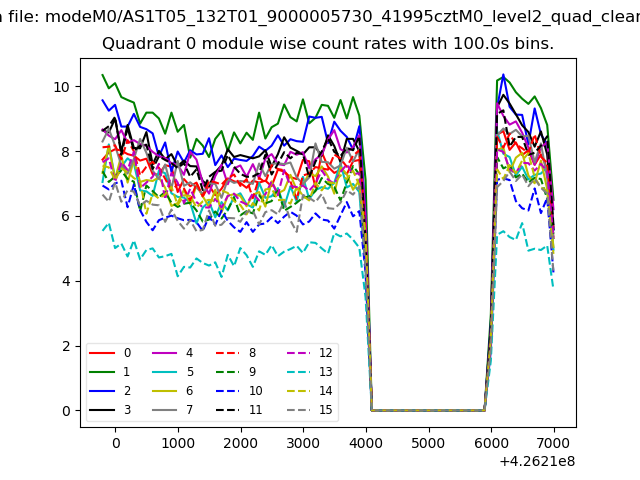 |
 |
| Module-wise count rates for Quadrant B Data is divided into 100 sec bins |
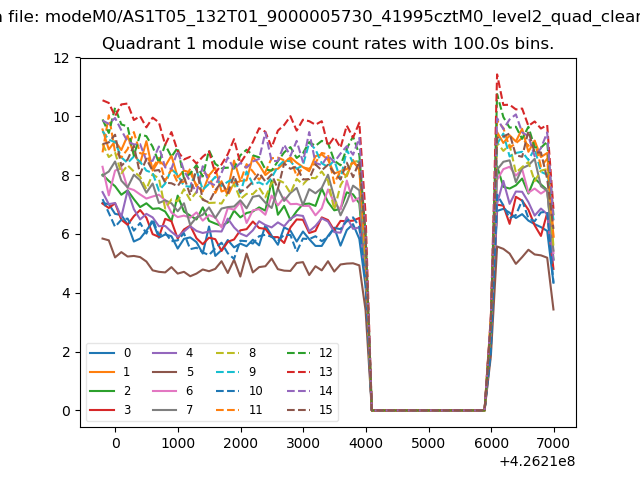 |
 |
| Module-wise count rates for Quadrant C Data is divided into 100 sec bins |
 |
 |
| Module-wise count rates for Quadrant D Data is divided into 100 sec bins |
 |
 |
| Parameter | Plot |
|---|---|
| CZT HV Monitor | 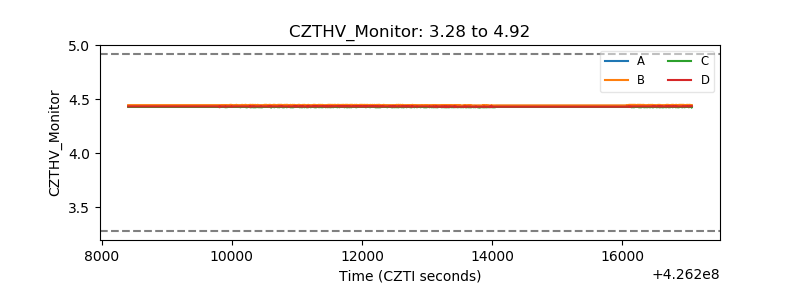 |
| D_VDD | 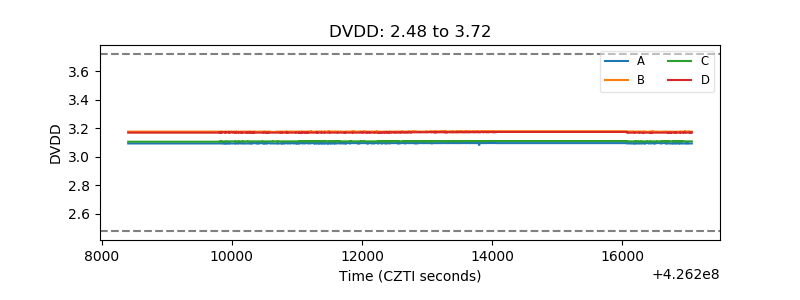 |
| Temperature 1 | 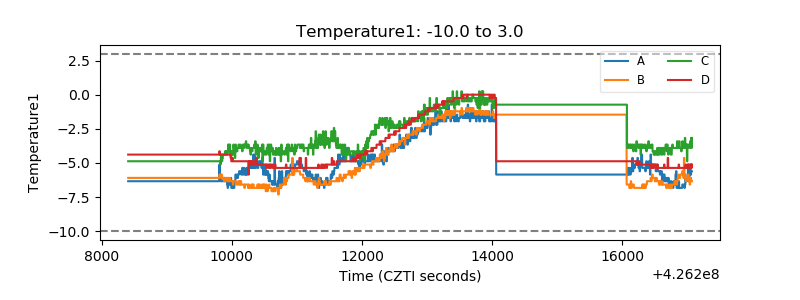 |
| Veto HV Monitor | 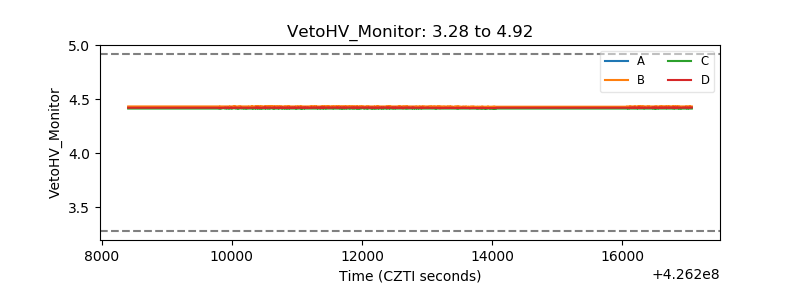 |
| Veto LLD | 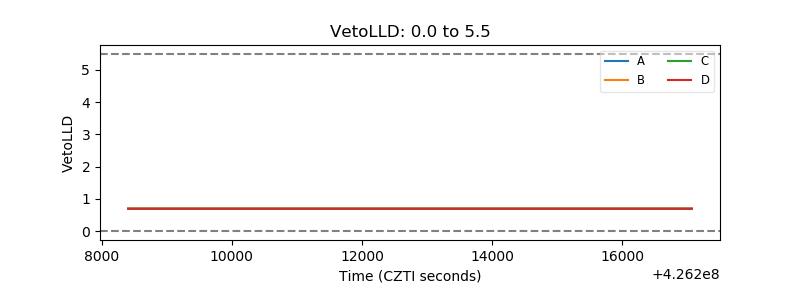 |
| Alpha Counter | 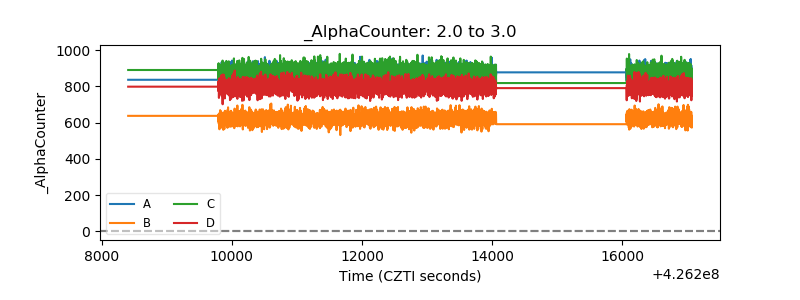 |
| _CPM_Rate | 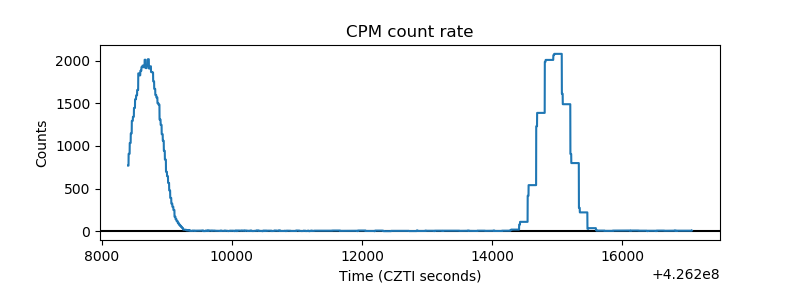 |
| CZT Counter | 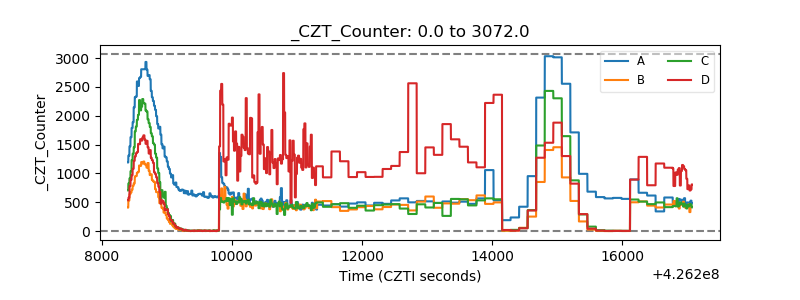 |
| +2.5 Volts monitor | 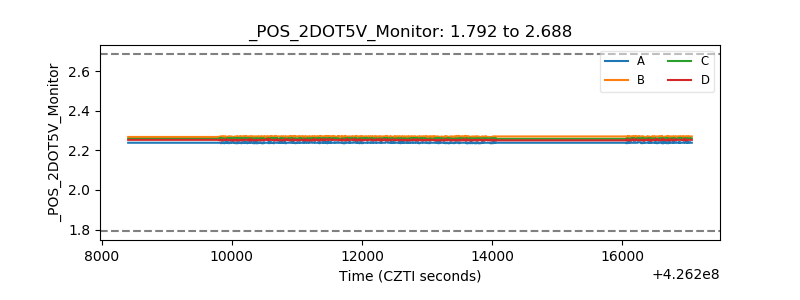 |
| +5 Volts monitor | 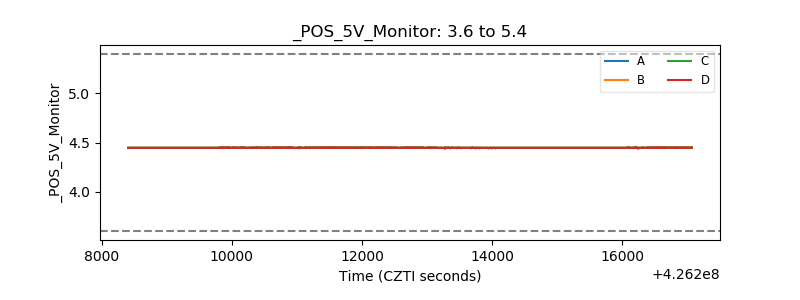 |
| _ROLL_ROT | 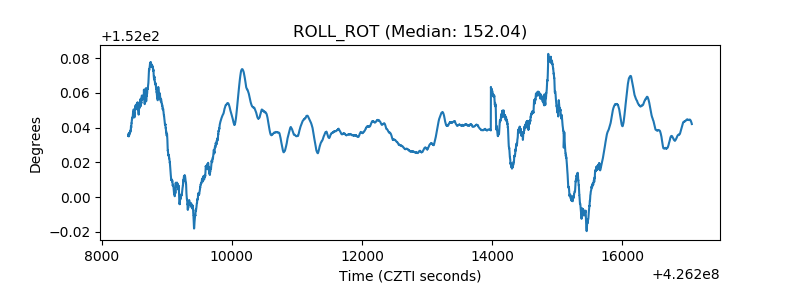 |
| _Roll_DEC | 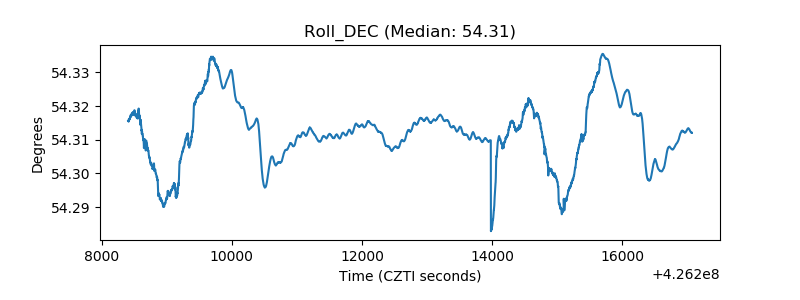 |
| _Roll_RA | 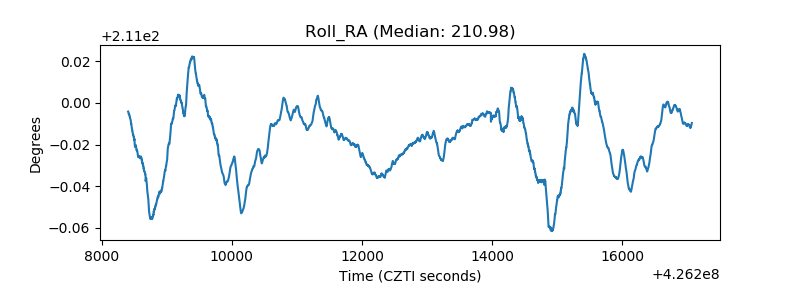 |
| Veto Counter | 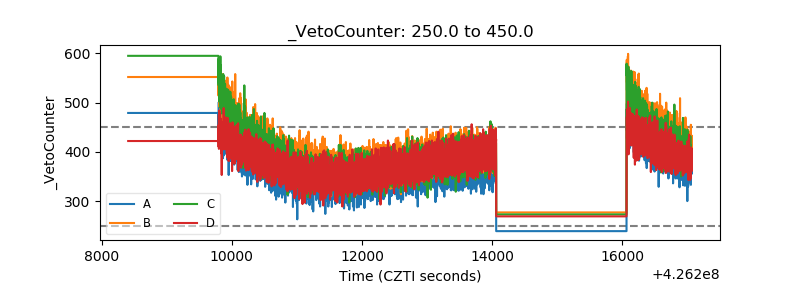 |