| Param | Original file | Final file |
|---|---|---|
| Filename | modeM0/AS1T05_132T01_9000005730_41996cztM0_level2.fits | modeM0/AS1T05_132T01_9000005730_41996cztM0_level2_quad_clean.evt |
| Size (bytes) | 346,847,040 | 89,303,040 |
| Size | 330.8 MB | 85.2 MB |
| Events in quadrant A | 2,774,658 | 603,074 |
| Events in quadrant B | 2,335,228 | 624,491 |
| Events in quadrant C | 2,386,869 | 597,456 |
| Events in quadrant D | 4,948,284 | 524,035 |
| Mode SS | |||
|---|---|---|---|
| Quadrant | BADHDUFLAG | Total packets | Discarded packets |
| A | 0 | 104 | 0 |
| B | 0 | 104 | 0 |
| C | 0 | 104 | 0 |
| D | 0 | 104 | 0 |
| Mode M0 | |||
|---|---|---|---|
| Quadrant | BADHDUFLAG | Total packets | Discarded packets |
| A | 0 | 11256 | 2 |
| B | 0 | 10356 | 2 |
| C | 0 | 10172 | 2 |
| D | 0 | 18430 | 4 |
| Mode M9 | |||
|---|---|---|---|
| Quadrant | BADHDUFLAG | Total packets | Discarded packets |
| A | 0 | 34 | 0 |
| B | 0 | 35 | 0 |
| C | 0 | 35 | 0 |
| D | 0 | 35 | 0 |
| Quadrant | Total seconds | Saturated seconds | Saturation percentage |
|---|---|---|---|
| A | 5065 | 11 | 0.217177% |
| B | 5065 | 14 | 0.276407% |
| C | 5065 | 3 | 0.059230% |
| D | 5064 | 209 | 4.127172% |
Noise dominated data is calculated using 1-second bins in cleaned event files. If a bin has >2000 counts, and if more than 50% of those come from <1% of pixels, then it is considered to be noise-dominated and hence unusable.
| Quadrant | # 1 sec bins | Bins with >0 counts | Bins with >2000 counts | High rate bins dominated by noise | Noise dominated (total time) | Noise dominated (detector-on time) | Marked lightcurve |
|---|---|---|---|---|---|---|---|
| A | 7157 | 5066 | 4 | 4 | 0.06% | 0.08% | 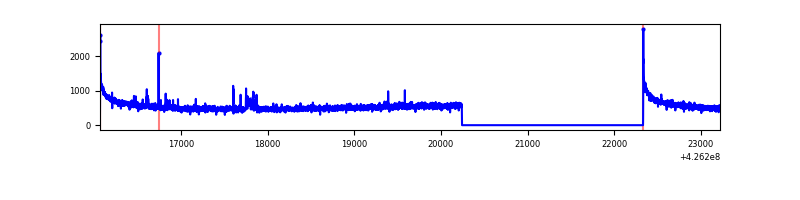 |
| B | 7157 | 5066 | 2 | 2 | 0.03% | 0.04% | 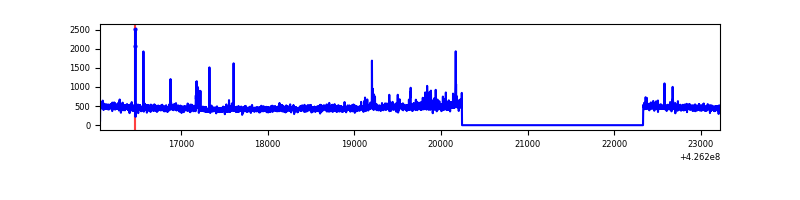 |
| C | 7157 | 5066 | 0 | 0 | 0.00% | 0.00% | 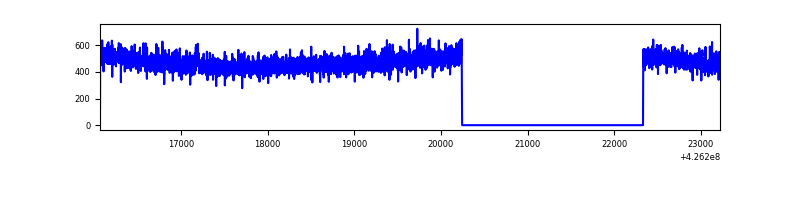 |
| D | 7156 | 5065 | 150 | 150 | 2.10% | 2.96% | 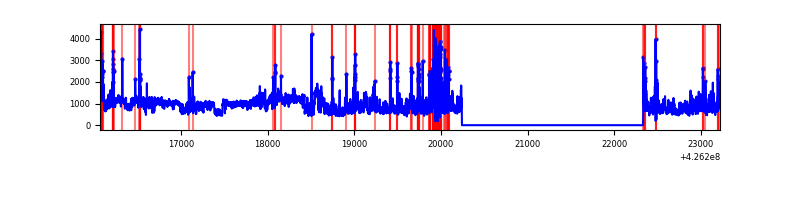 |
Top three noisy pixels from each quadrant. If the there are fewer than three noisy pixels in the level2.evt file, extra rows are filled as -1
| Pixel properties | Quadrant properties | ||||||
|---|---|---|---|---|---|---|---|
| Quadrant | DetID | PixID | Counts | Sigma | Mean | Median | Sigma |
| A | 10 | 83 | 521832 | 4465.73 | 570 | 560 | 116.7 |
| A | 2 | 79 | 39775 | 335.95 | 570 | 560 | 116.7 |
| A | 3 | 137 | 6054 | 47.06 | 570 | 560 | 116.7 |
| B | 0 | 190 | 35943 | 329.54 | 569 | 554 | 107.4 |
| B | 5 | 255 | 33776 | 309.36 | 569 | 554 | 107.4 |
| B | 12 | 111 | 13483 | 120.39 | 569 | 554 | 107.4 |
| C | 15 | 214 | 211088 | 1630.14 | 555 | 558 | 129.1 |
| C | 8 | 229 | 7875 | 56.66 | 555 | 558 | 129.1 |
| C | 7 | 220 | 4381 | 29.6 | 555 | 558 | 129.1 |
| D | 1 | 52 | 1992144 | 15179.48 | 537 | 522 | 131.2 |
| D | 13 | 249 | 361467 | 2751.0 | 537 | 522 | 131.2 |
| D | 12 | 217 | 210850 | 1603.05 | 537 | 522 | 131.2 |
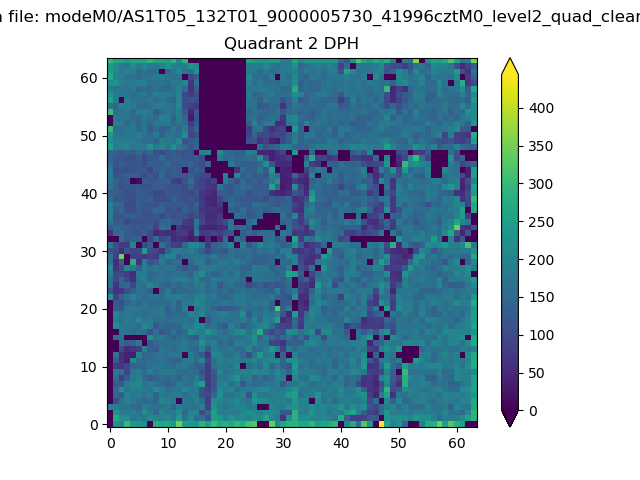
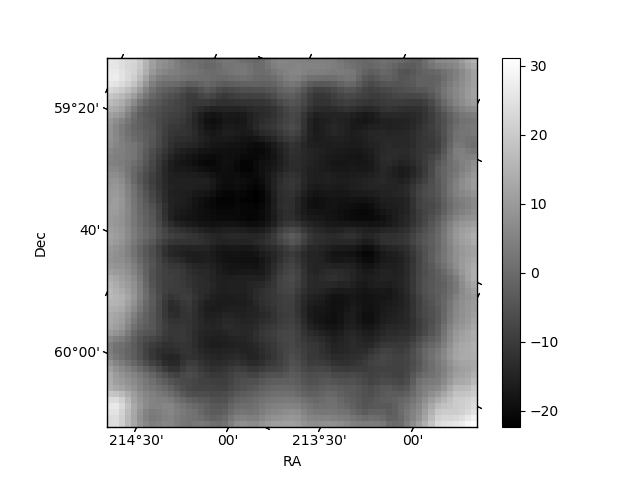
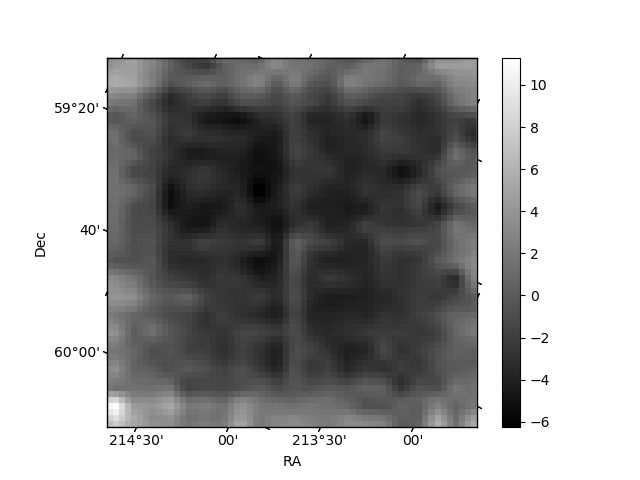
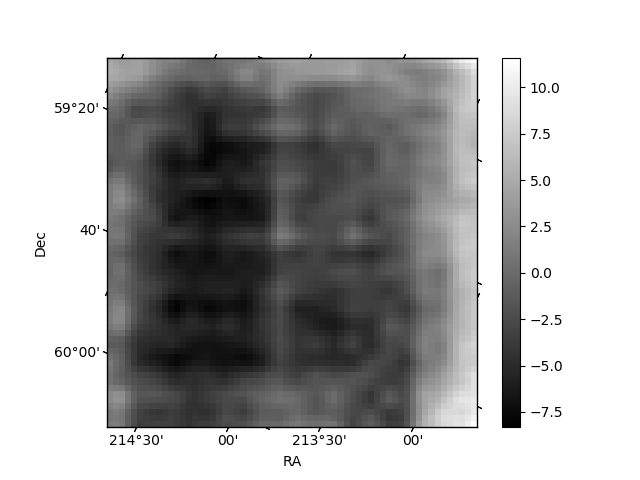
Histogram calculated using DETX and DETY for each event in the final _common_clean file
| Quadrant A | 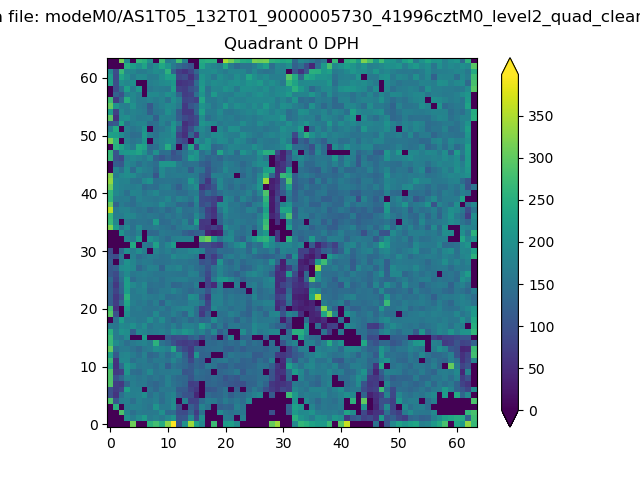 |
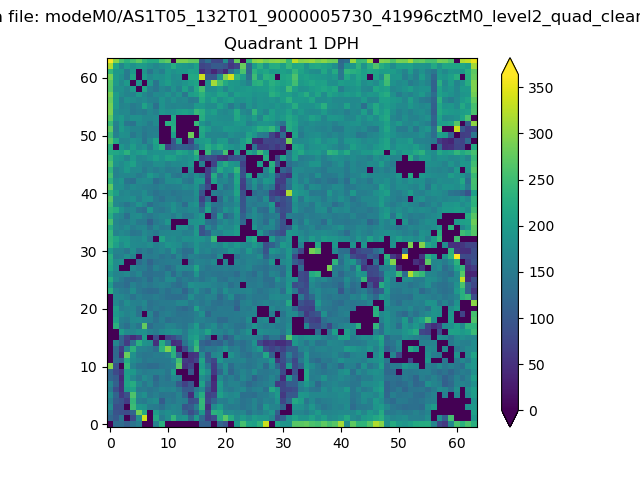 |
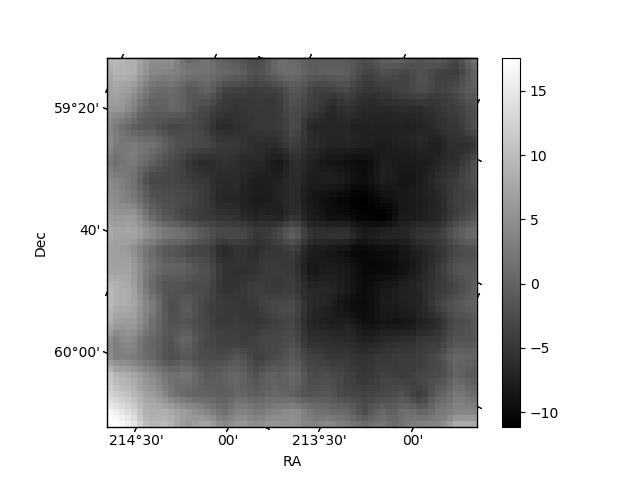
Quadrant B |
|---|---|---|---|
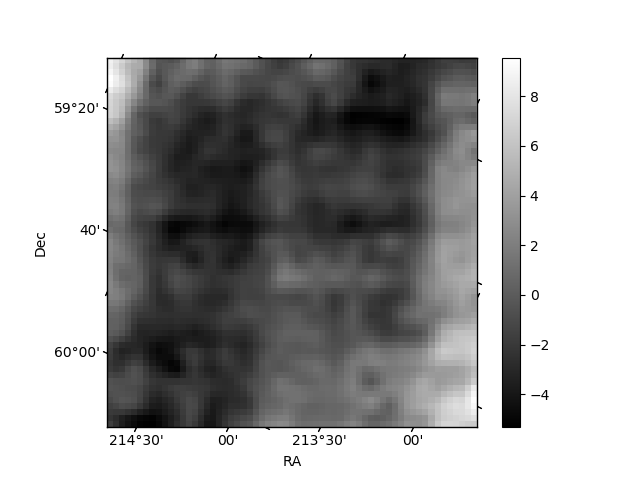
| Quadrant D | 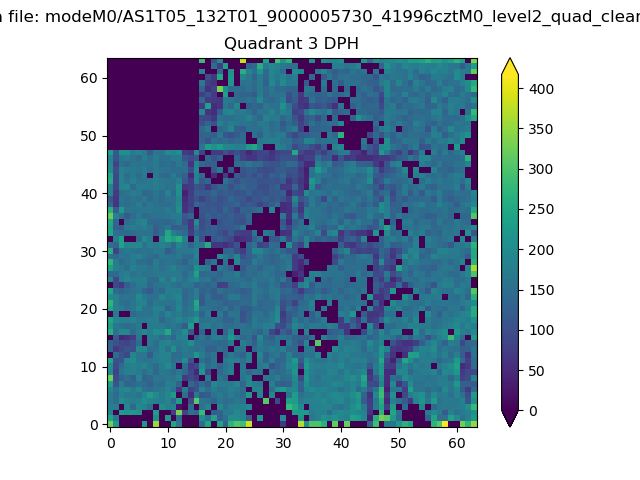 |
 |
Quadrant C |
| Plot type | Count rate plots | Images |
|---|---|---|
| Comparison with Poisson distribution Blue bars denote a histogram of data divided into 1 sec bins. Red curve is a Poisson curve with rate = median count rate of data. |
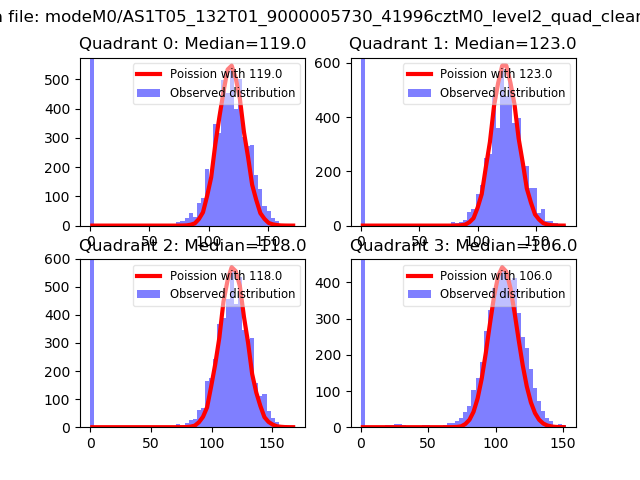 |
 |
| Quadrant-wise count rates Data is divided into 100 sec bins |
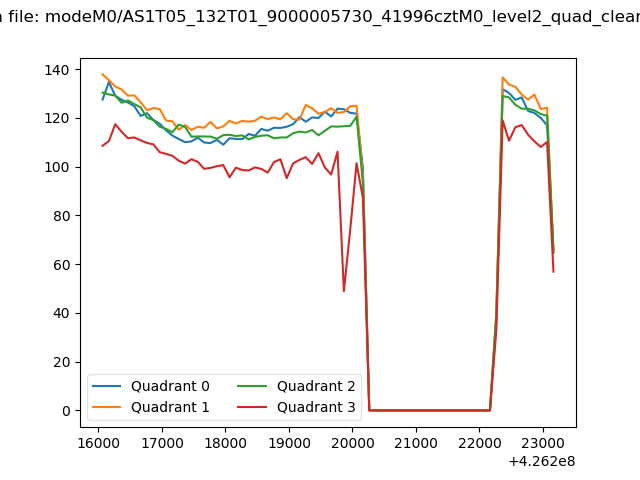 |
|
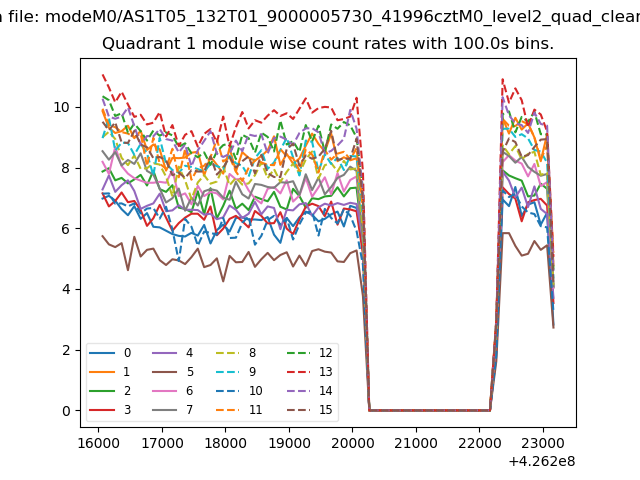
| Module-wise count rates for Quadrant A Data is divided into 100 sec bins |
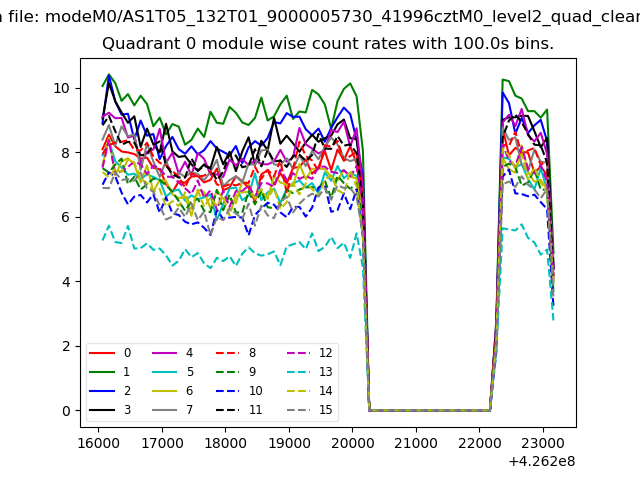 |
 |
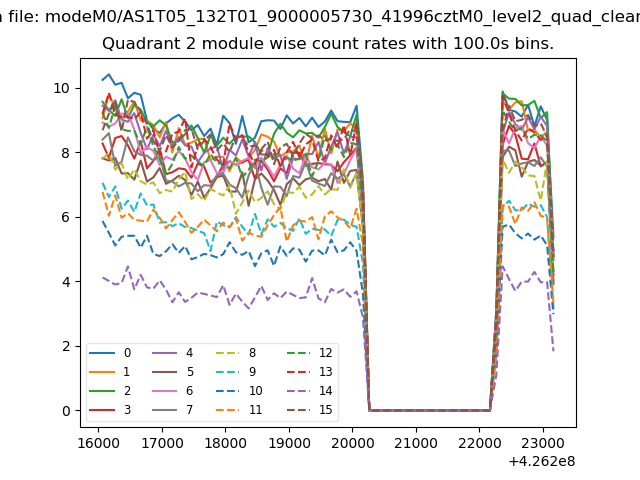
| Module-wise count rates for Quadrant B Data is divided into 100 sec bins |
 |
 |
| Module-wise count rates for Quadrant C Data is divided into 100 sec bins |
 |
 |
| Module-wise count rates for Quadrant D Data is divided into 100 sec bins |
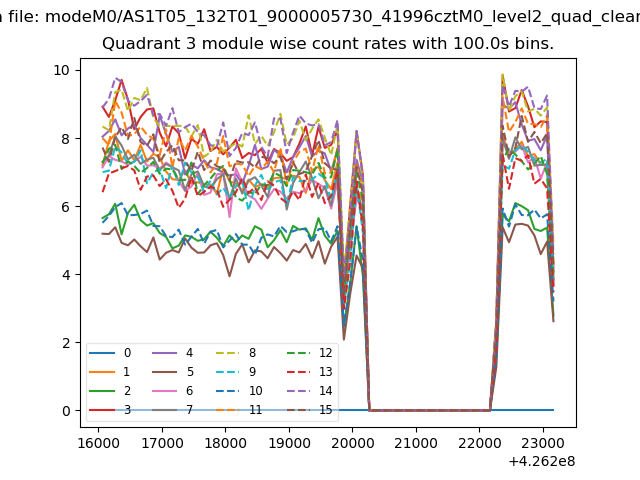 |
 |
| Parameter | Plot |
|---|---|
| CZT HV Monitor | 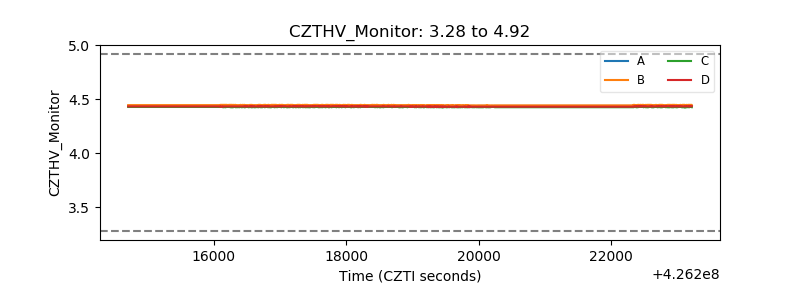 |
| D_VDD | 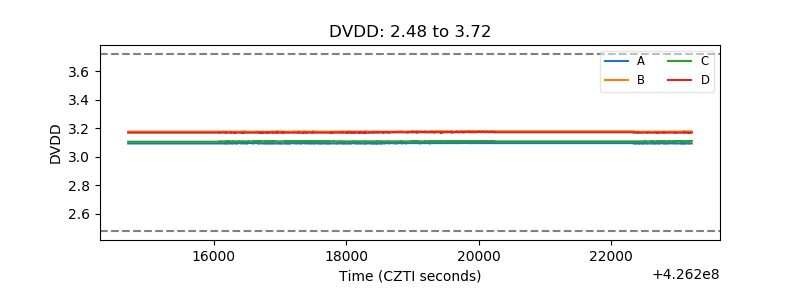 |
| Temperature 1 | 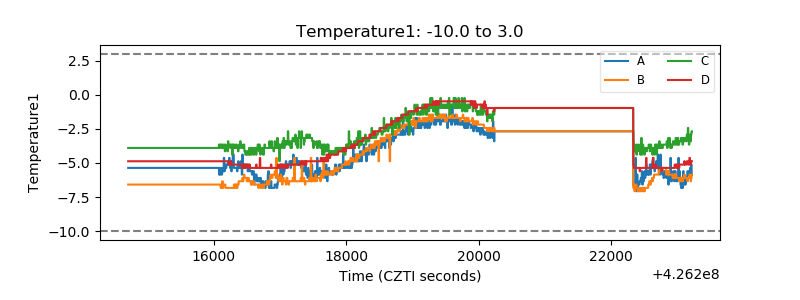 |
| Veto HV Monitor | 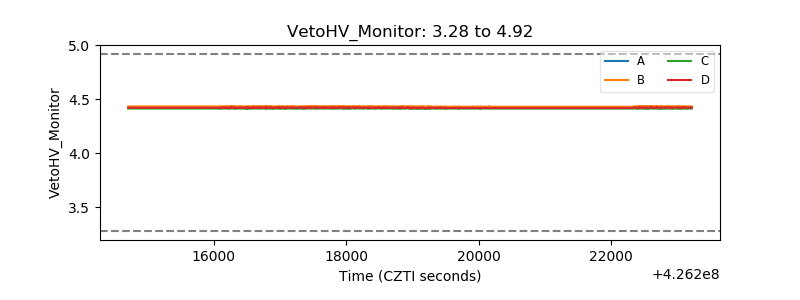 |
| Veto LLD | 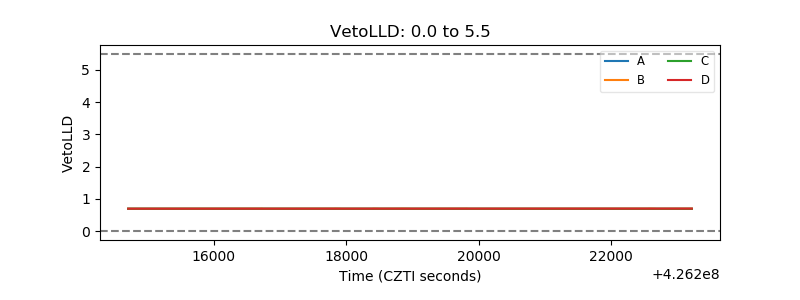 |
| Alpha Counter | 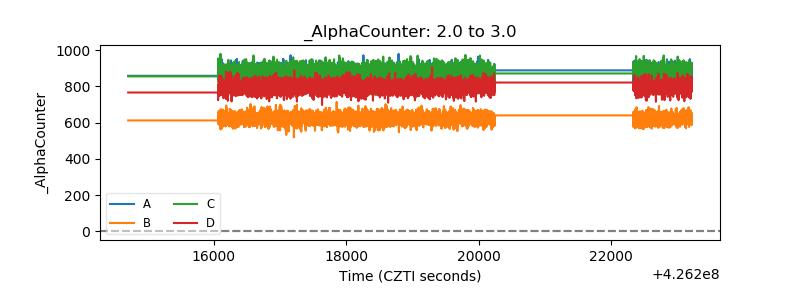 |
| _CPM_Rate | 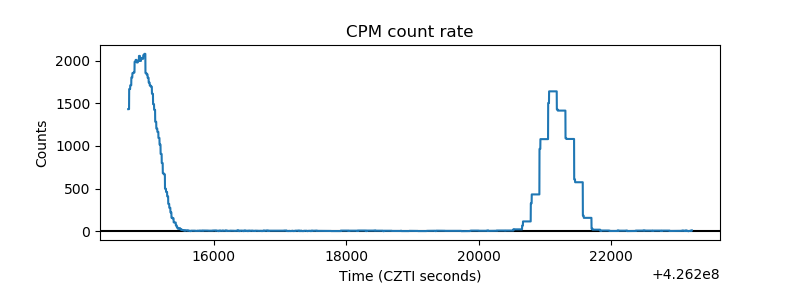 |
| CZT Counter | 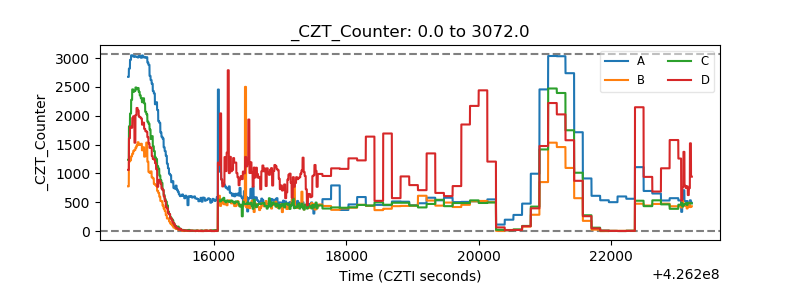 |
| +2.5 Volts monitor | 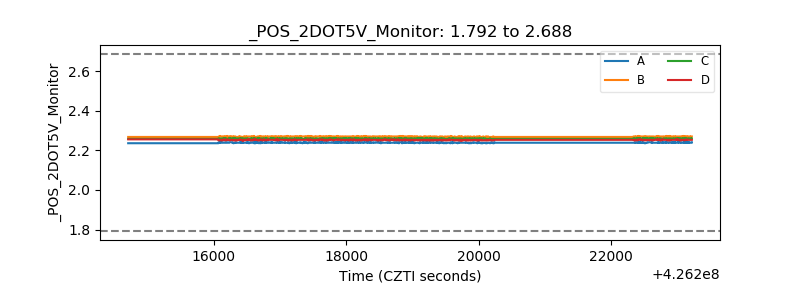 |
| +5 Volts monitor |  |
| _ROLL_ROT | 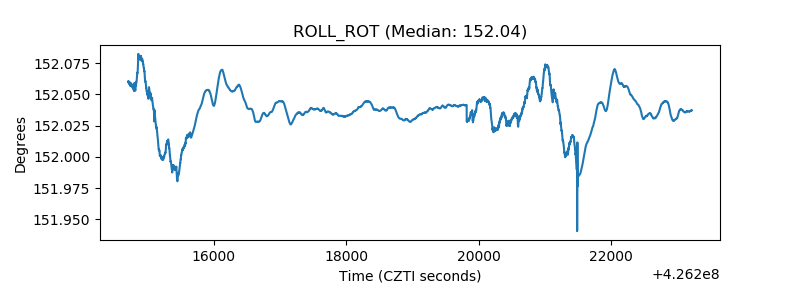 |
| _Roll_DEC | 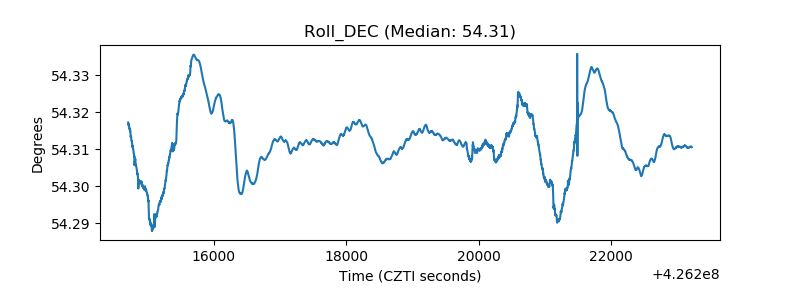 |
| _Roll_RA | 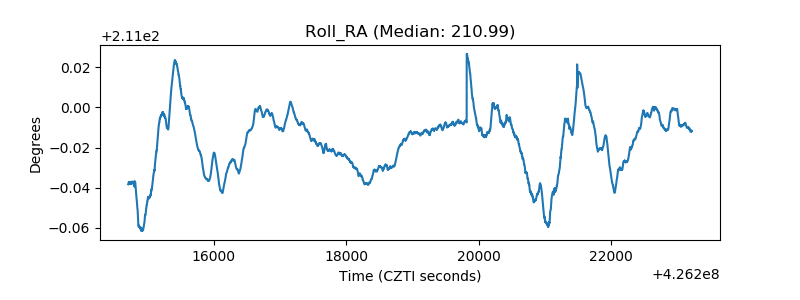 |
| Veto Counter | 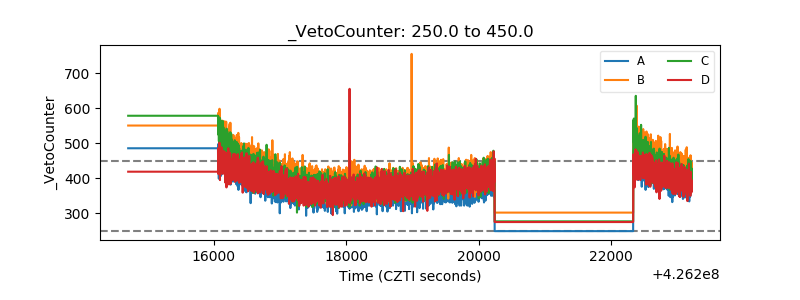 |