| Param | Original file | Final file |
|---|---|---|
| Filename | modeM0/AS1T05_132T01_9000005730_41997cztM0_level2.fits | modeM0/AS1T05_132T01_9000005730_41997cztM0_level2_quad_clean.evt |
| Size (bytes) | 310,351,680 | 87,148,800 |
| Size | 296.0 MB | 83.1 MB |
| Events in quadrant A | 2,718,766 | 584,666 |
| Events in quadrant B | 2,323,706 | 605,874 |
| Events in quadrant C | 2,320,017 | 577,288 |
| Events in quadrant D | 3,740,427 | 524,082 |
| Mode SS | |||
|---|---|---|---|
| Quadrant | BADHDUFLAG | Total packets | Discarded packets |
| A | 0 | 102 | 0 |
| B | 0 | 102 | 0 |
| C | 0 | 102 | 0 |
| D | 0 | 102 | 0 |
| Mode M0 | |||
|---|---|---|---|
| Quadrant | BADHDUFLAG | Total packets | Discarded packets |
| A | 0 | 10897 | 2 |
| B | 0 | 10234 | 2 |
| C | 0 | 9932 | 2 |
| D | 0 | 14581 | 2 |
| Mode M9 | |||
|---|---|---|---|
| Quadrant | BADHDUFLAG | Total packets | Discarded packets |
| A | 0 | 33 | 0 |
| B | 0 | 34 | 0 |
| C | 0 | 34 | 0 |
| D | 0 | 34 | 0 |
| Quadrant | Total seconds | Saturated seconds | Saturation percentage |
|---|---|---|---|
| A | 4946 | 12 | 0.242620% |
| B | 4946 | 9 | 0.181965% |
| C | 4946 | 2 | 0.040437% |
| D | 4946 | 51 | 1.031136% |
Noise dominated data is calculated using 1-second bins in cleaned event files. If a bin has >2000 counts, and if more than 50% of those come from <1% of pixels, then it is considered to be noise-dominated and hence unusable.
| Quadrant | # 1 sec bins | Bins with >0 counts | Bins with >2000 counts | High rate bins dominated by noise | Noise dominated (total time) | Noise dominated (detector-on time) | Marked lightcurve |
|---|---|---|---|---|---|---|---|
| A | 7099 | 4947 | 2 | 2 | 0.03% | 0.04% | 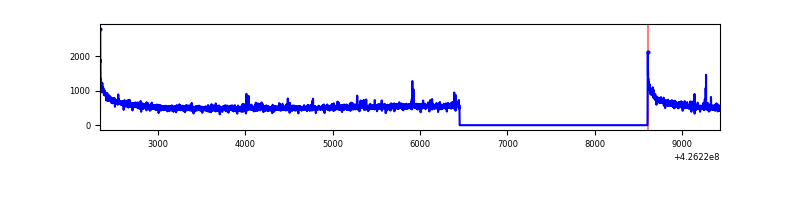 |
| B | 7099 | 4947 | 3 | 3 | 0.04% | 0.06% | 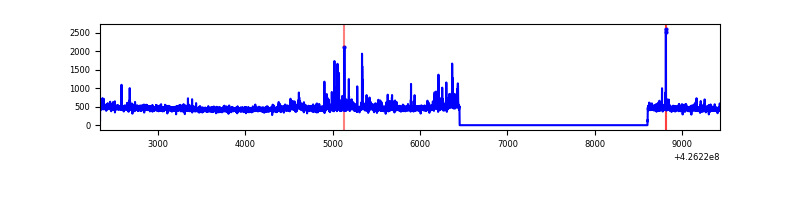 |
| C | 7099 | 4947 | 0 | 0 | 0.00% | 0.00% | 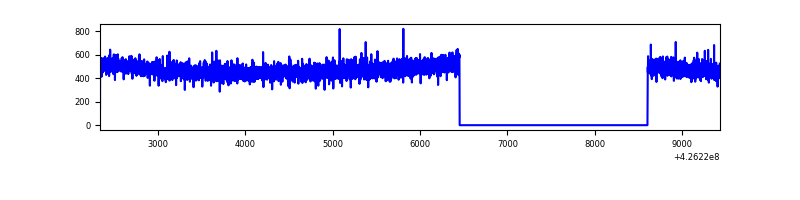 |
| D | 7099 | 4947 | 45 | 45 | 0.63% | 0.91% | 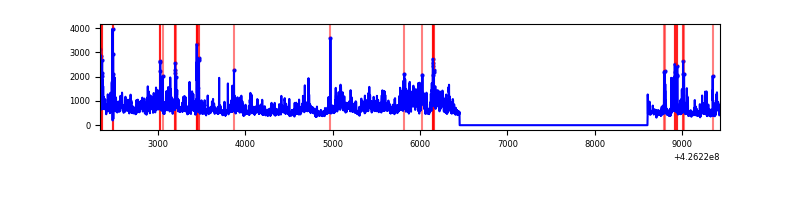 |
Top three noisy pixels from each quadrant. If the there are fewer than three noisy pixels in the level2.evt file, extra rows are filled as -1
| Pixel properties | Quadrant properties | ||||||
|---|---|---|---|---|---|---|---|
| Quadrant | DetID | PixID | Counts | Sigma | Mean | Median | Sigma |
| A | 10 | 83 | 529623 | 4660.9 | 558 | 548 | 113.5 |
| A | 2 | 79 | 11202 | 93.86 | 558 | 548 | 113.5 |
| A | 13 | 6 | 7433 | 60.65 | 558 | 548 | 113.5 |
| B | 0 | 190 | 61914 | 582.66 | 554 | 537 | 105.3 |
| B | 5 | 255 | 50735 | 476.54 | 554 | 537 | 105.3 |
| B | 4 | 81 | 20030 | 185.05 | 554 | 537 | 105.3 |
| C | 15 | 214 | 208382 | 1661.77 | 539 | 542 | 125.1 |
| C | 8 | 229 | 8878 | 66.65 | 539 | 542 | 125.1 |
| C | 13 | 61 | 3726 | 25.46 | 539 | 542 | 125.1 |
| D | 1 | 52 | 942120 | 7206.81 | 535 | 522 | 130.7 |
| D | 12 | 217 | 350873 | 2681.52 | 535 | 522 | 130.7 |
| D | 13 | 249 | 154419 | 1177.9 | 535 | 522 | 130.7 |
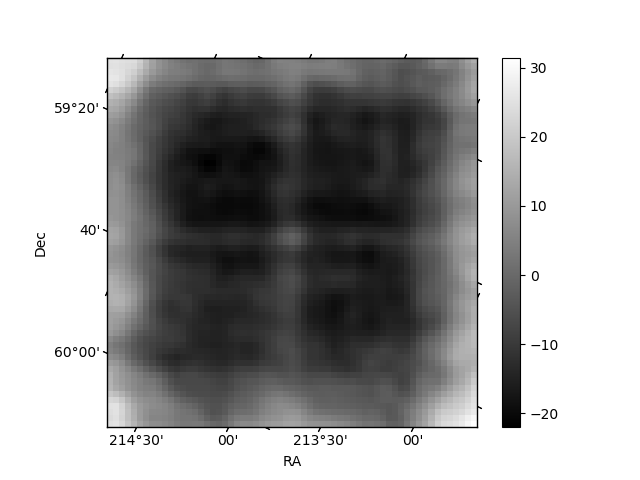
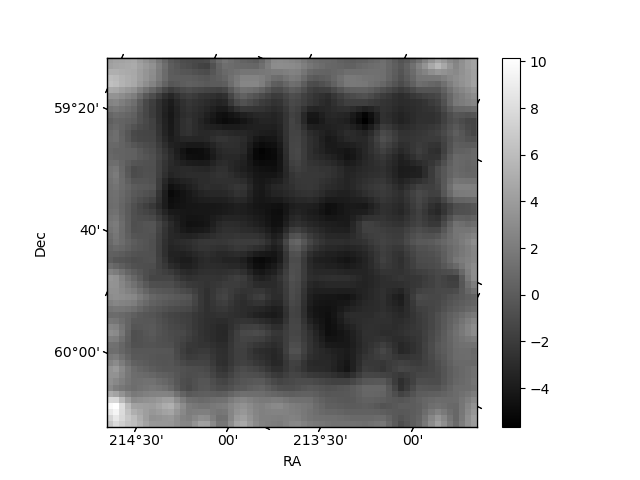
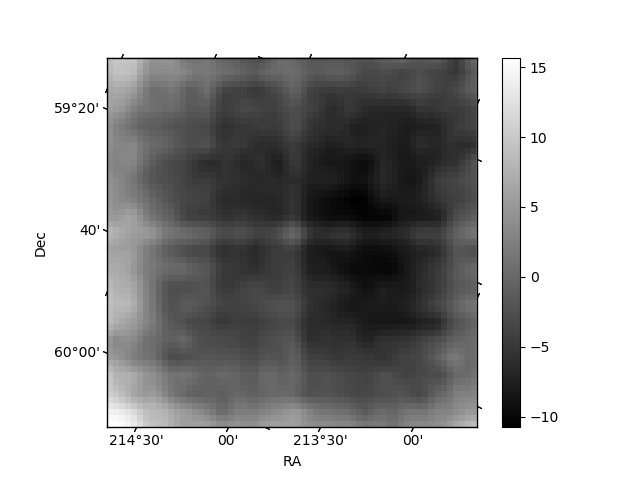
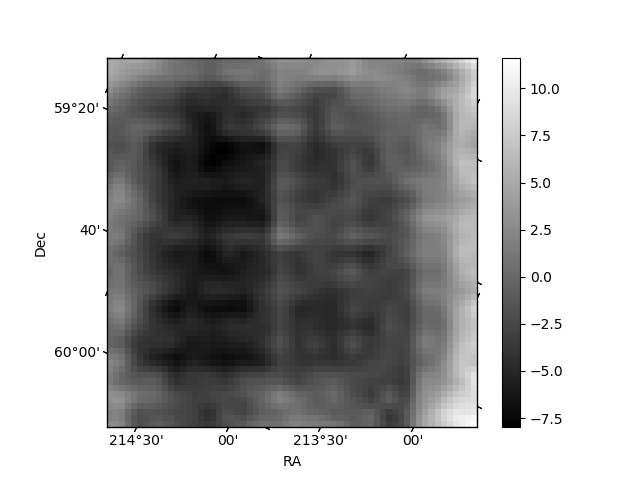
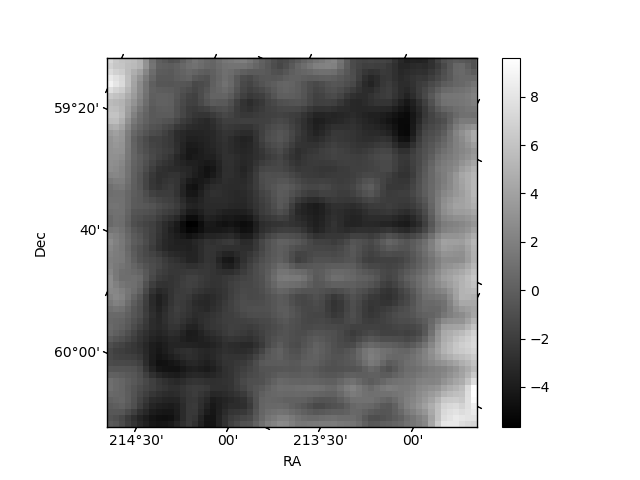
Histogram calculated using DETX and DETY for each event in the final _common_clean file
| Quadrant A | 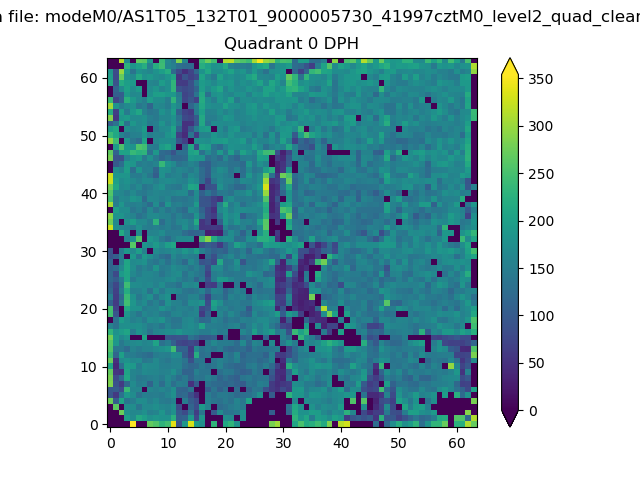 |
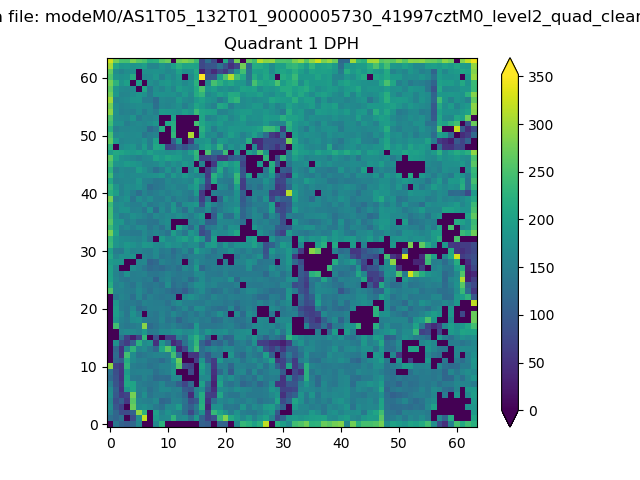 |
Quadrant B |
|---|---|---|---|
| Quadrant D | 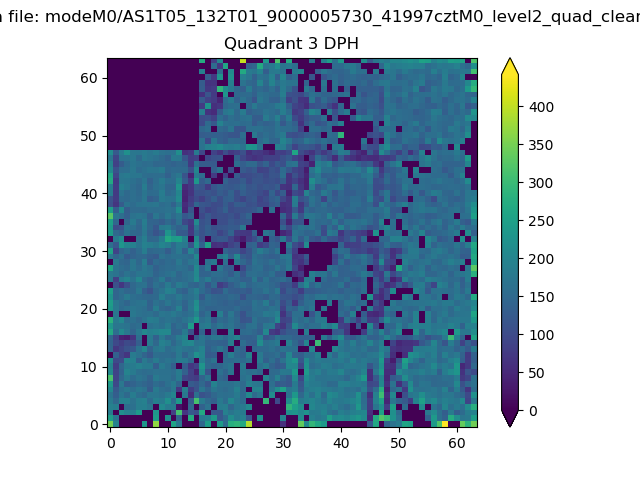 |
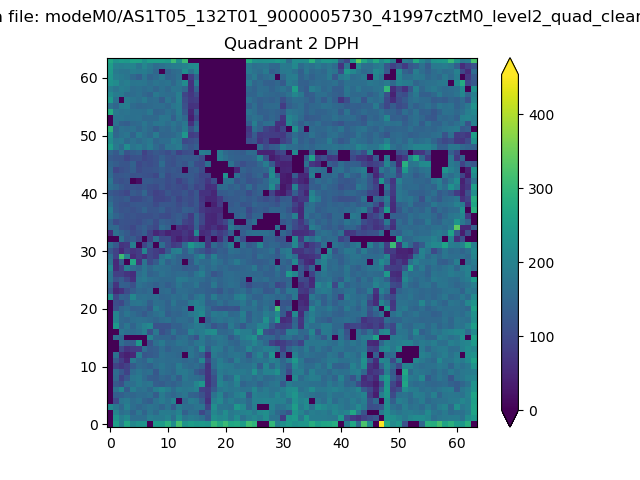 |
Quadrant C |
| Plot type | Count rate plots | Images |
|---|---|---|
| Comparison with Poisson distribution Blue bars denote a histogram of data divided into 1 sec bins. Red curve is a Poisson curve with rate = median count rate of data. |
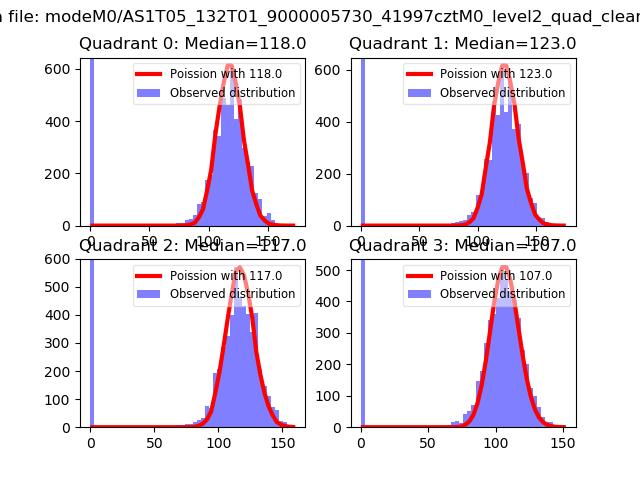 |
 |
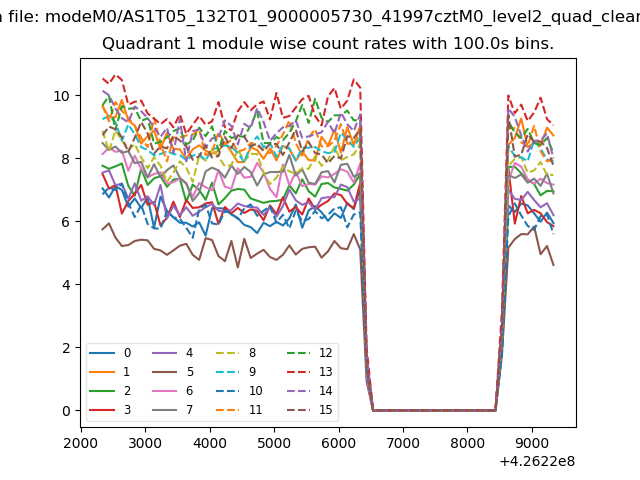
| Quadrant-wise count rates Data is divided into 100 sec bins |
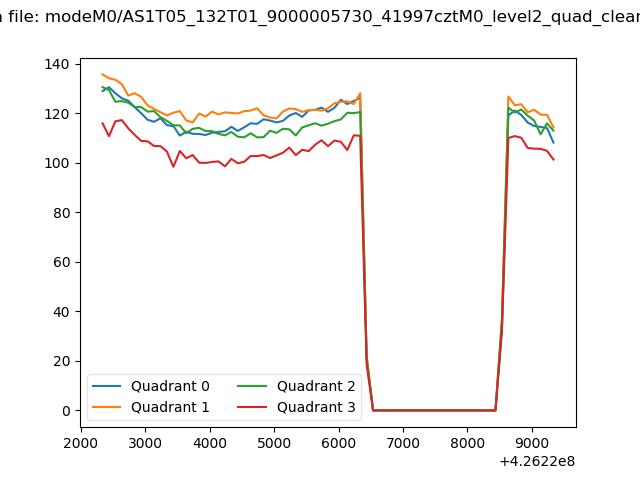 |
|
| Module-wise count rates for Quadrant A Data is divided into 100 sec bins |
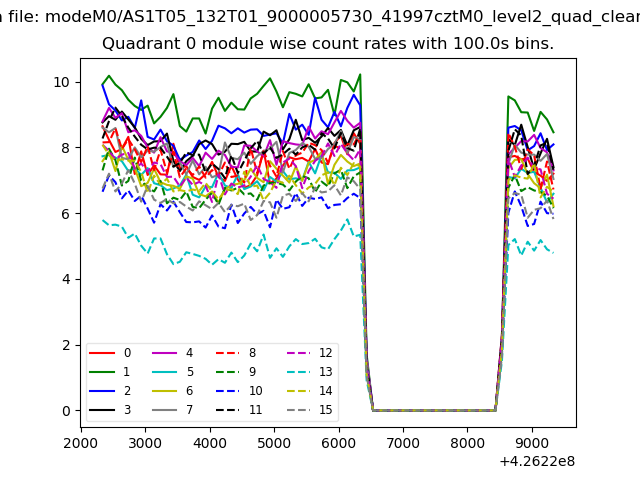 |
 |
| Module-wise count rates for Quadrant B Data is divided into 100 sec bins |
 |
 |
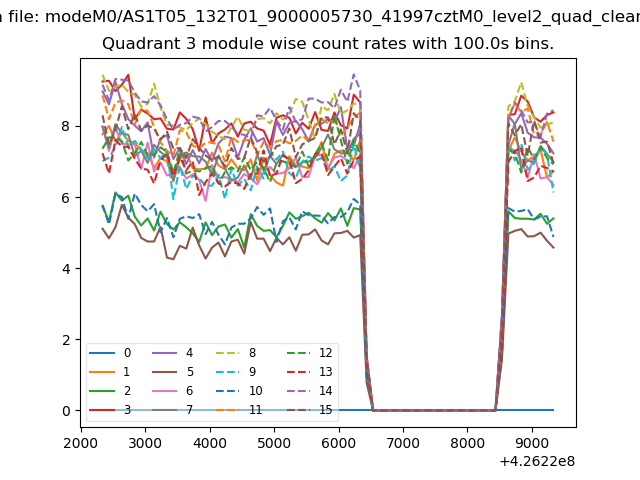
| Module-wise count rates for Quadrant C Data is divided into 100 sec bins |
 |
 |
| Module-wise count rates for Quadrant D Data is divided into 100 sec bins |
 |
 |
| Parameter | Plot |
|---|---|
| CZT HV Monitor | 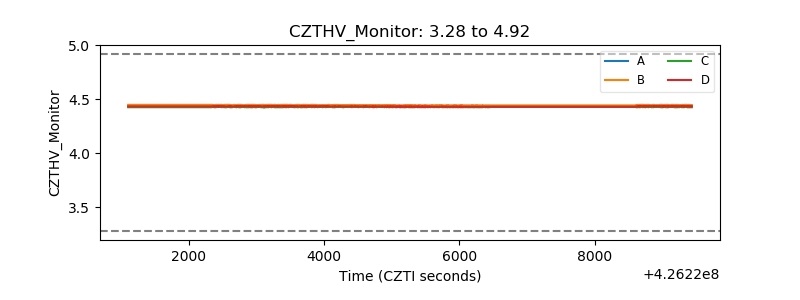 |
| D_VDD | 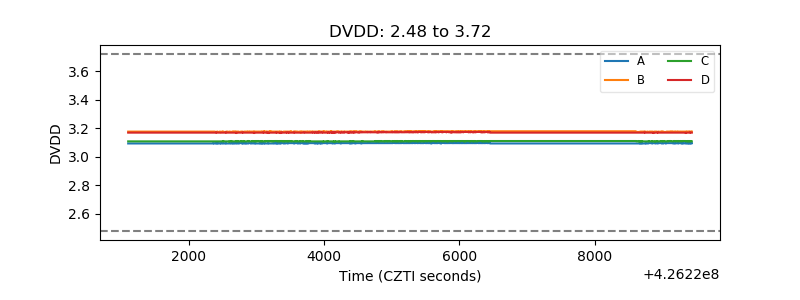 |
| Temperature 1 | 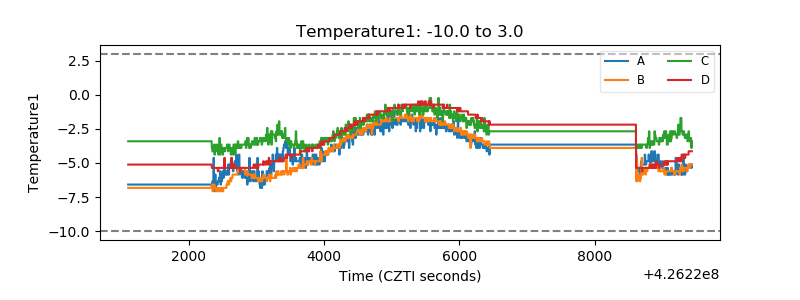 |
| Veto HV Monitor | 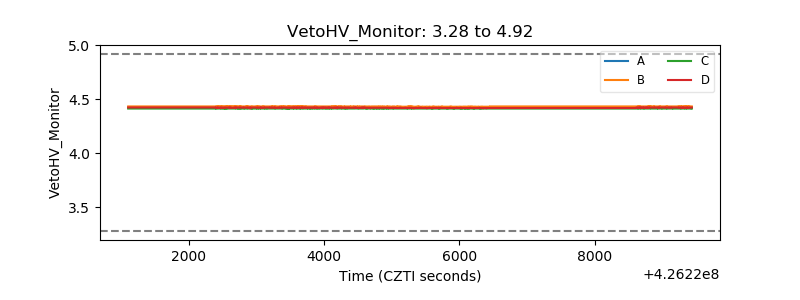 |
| Veto LLD | 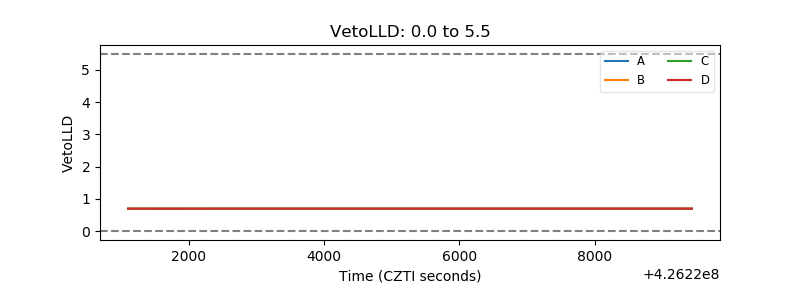 |
| Alpha Counter |  |
| _CPM_Rate | 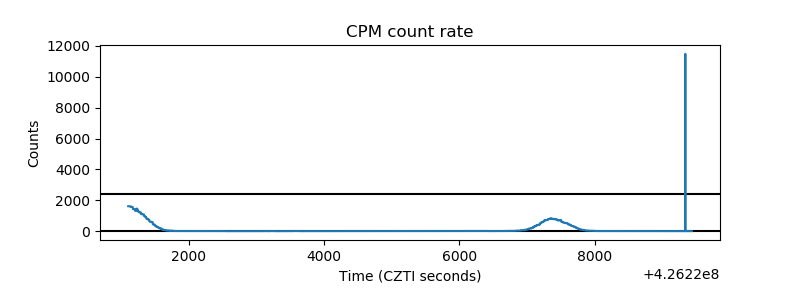 |
| CZT Counter | 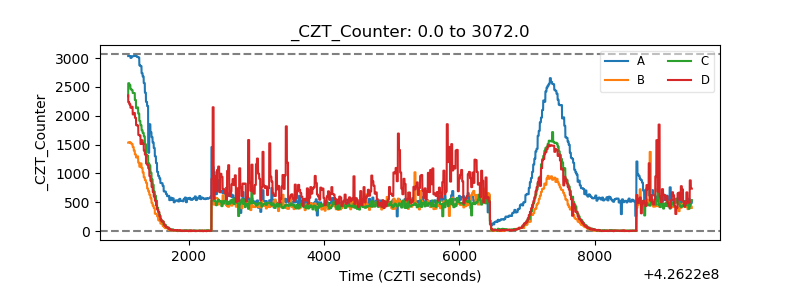 |
| +2.5 Volts monitor | 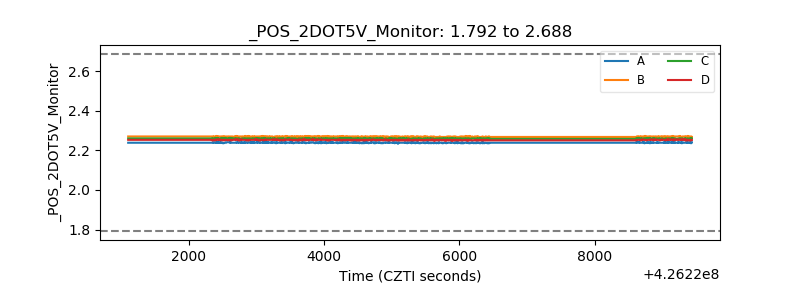 |
| +5 Volts monitor | 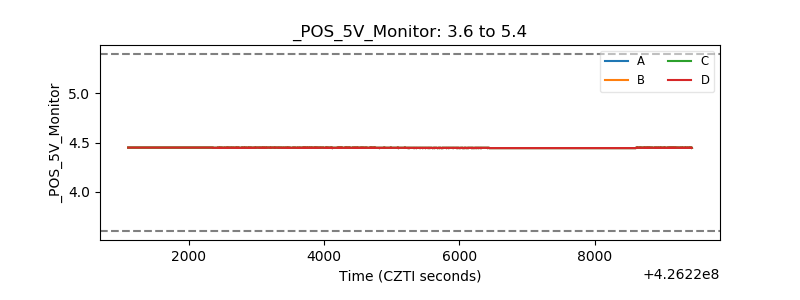 |
| _ROLL_ROT | 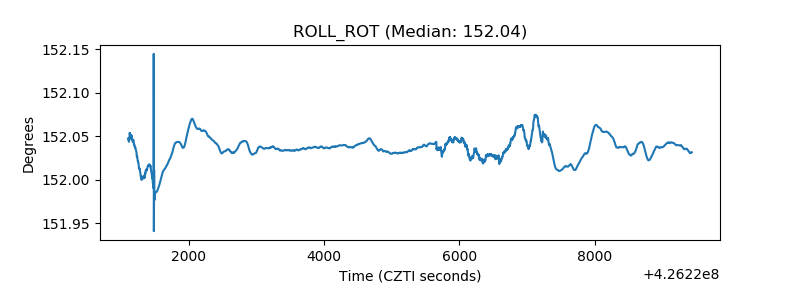 |
| _Roll_DEC | 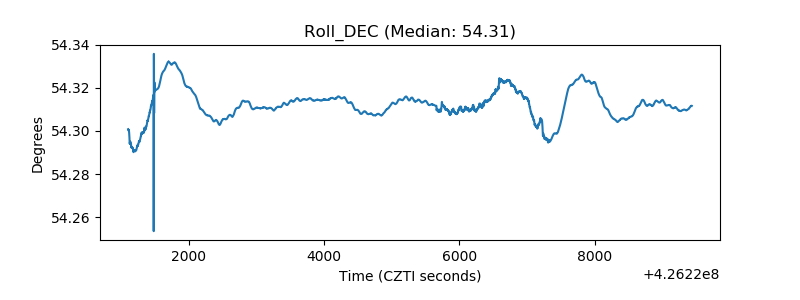 |
| _Roll_RA |  |
| Veto Counter | 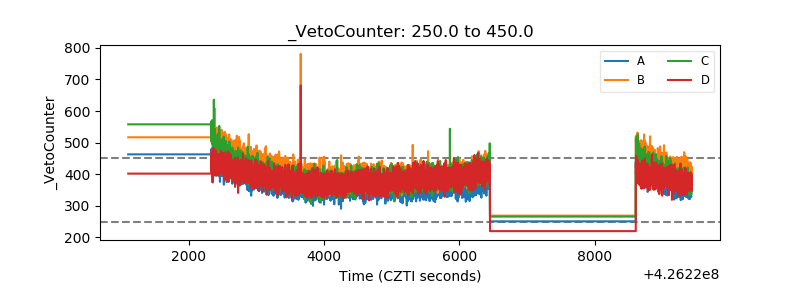 |