| Param | Original file | Final file |
|---|---|---|
| Filename | modeM0/AS1T05_132T01_9000005730_41999cztM0_level2.fits | modeM0/AS1T05_132T01_9000005730_41999cztM0_level2_quad_clean.evt |
| Size (bytes) | 395,861,760 | 84,481,920 |
| Size | 377.5 MB | 80.6 MB |
| Events in quadrant A | 2,737,946 | 571,132 |
| Events in quadrant B | 2,466,412 | 586,701 |
| Events in quadrant C | 2,361,976 | 560,068 |
| Events in quadrant D | 6,686,024 | 478,117 |
| Mode SS | |||
|---|---|---|---|
| Quadrant | BADHDUFLAG | Total packets | Discarded packets |
| A | 0 | 106 | 0 |
| B | 0 | 106 | 0 |
| C | 0 | 106 | 0 |
| D | 0 | 106 | 0 |
| Mode M0 | |||
|---|---|---|---|
| Quadrant | BADHDUFLAG | Total packets | Discarded packets |
| A | 0 | 11133 | 2 |
| B | 0 | 10941 | 2 |
| C | 0 | 10352 | 2 |
| D | 0 | 23538 | 3 |
| Mode M9 | |||
|---|---|---|---|
| Quadrant | BADHDUFLAG | Total packets | Discarded packets |
| A | 0 | 29 | 0 |
| B | 0 | 30 | 0 |
| C | 0 | 30 | 0 |
| D | 0 | 30 | 0 |
| Quadrant | Total seconds | Saturated seconds | Saturation percentage |
|---|---|---|---|
| A | 5163 | 12 | 0.232423% |
| B | 5163 | 26 | 0.503583% |
| C | 5163 | 3 | 0.058106% |
| D | 5162 | 467 | 9.046881% |
Noise dominated data is calculated using 1-second bins in cleaned event files. If a bin has >2000 counts, and if more than 50% of those come from <1% of pixels, then it is considered to be noise-dominated and hence unusable.
| Quadrant | # 1 sec bins | Bins with >0 counts | Bins with >2000 counts | High rate bins dominated by noise | Noise dominated (total time) | Noise dominated (detector-on time) | Marked lightcurve |
|---|---|---|---|---|---|---|---|
| A | 7047 | 5164 | 2 | 2 | 0.03% | 0.04% | 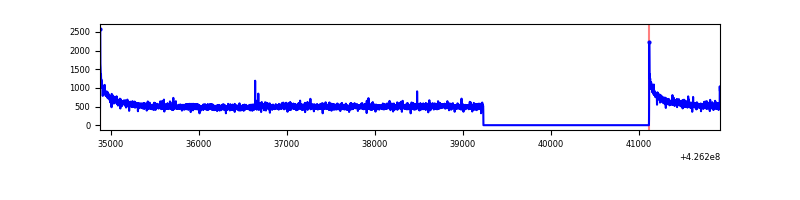 |
| B | 7047 | 5164 | 17 | 17 | 0.24% | 0.33% | 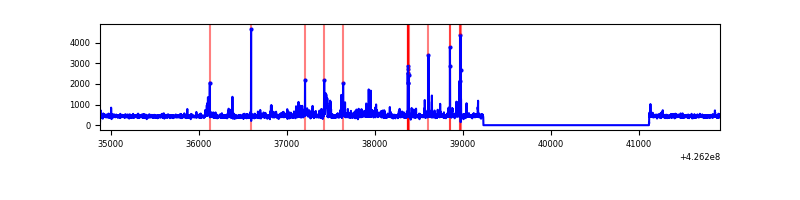 |
| C | 7047 | 5164 | 0 | 0 | 0.00% | 0.00% | 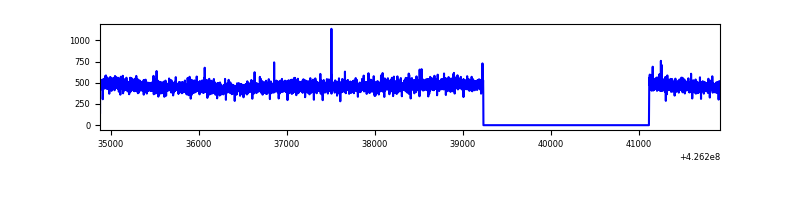 |
| D | 7046 | 5163 | 500 | 500 | 7.10% | 9.68% | 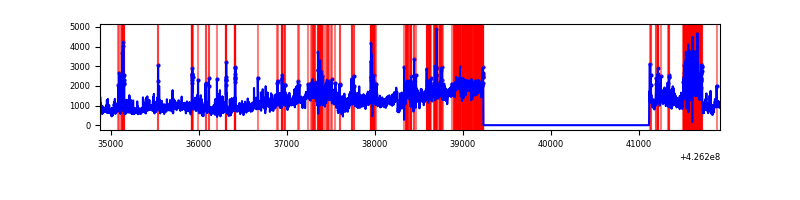 |
Top three noisy pixels from each quadrant. If the there are fewer than three noisy pixels in the level2.evt file, extra rows are filled as -1
| Pixel properties | Quadrant properties | ||||||
|---|---|---|---|---|---|---|---|
| Quadrant | DetID | PixID | Counts | Sigma | Mean | Median | Sigma |
| A | 10 | 83 | 556600 | 4859.05 | 558 | 548 | 114.4 |
| A | 15 | 222 | 11084 | 92.07 | 558 | 548 | 114.4 |
| A | 13 | 6 | 7464 | 60.44 | 558 | 548 | 114.4 |
| B | 0 | 190 | 111518 | 1041.94 | 554 | 539 | 106.5 |
| B | 5 | 255 | 71401 | 665.3 | 554 | 539 | 106.5 |
| B | 0 | 186 | 35961 | 332.56 | 554 | 539 | 106.5 |
| C | 15 | 214 | 220162 | 1729.69 | 544 | 547 | 127.0 |
| C | 8 | 229 | 11256 | 84.34 | 544 | 547 | 127.0 |
| C | 3 | 233 | 4065 | 27.71 | 544 | 547 | 127.0 |
| D | 1 | 52 | 3508222 | 27119.91 | 524 | 509 | 129.3 |
| D | 13 | 249 | 687214 | 5309.27 | 524 | 509 | 129.3 |
| D | 2 | 249 | 229970 | 1774.08 | 524 | 509 | 129.3 |
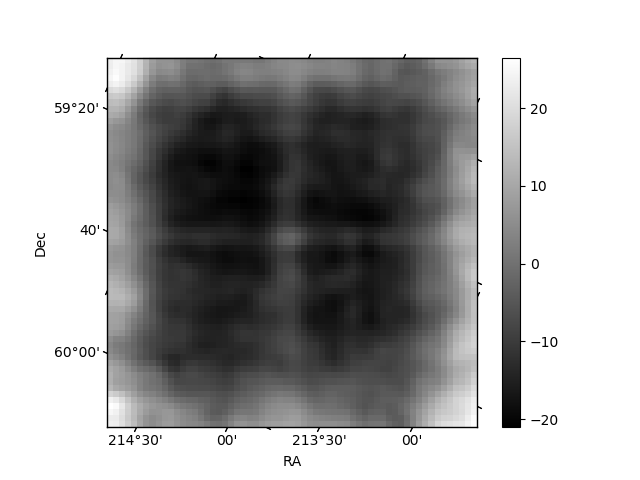
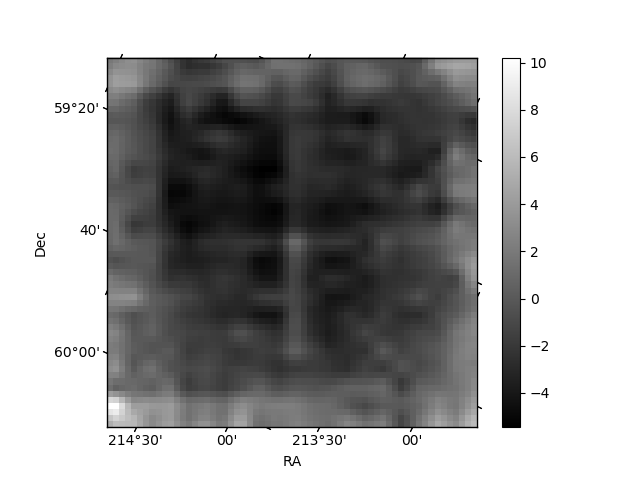
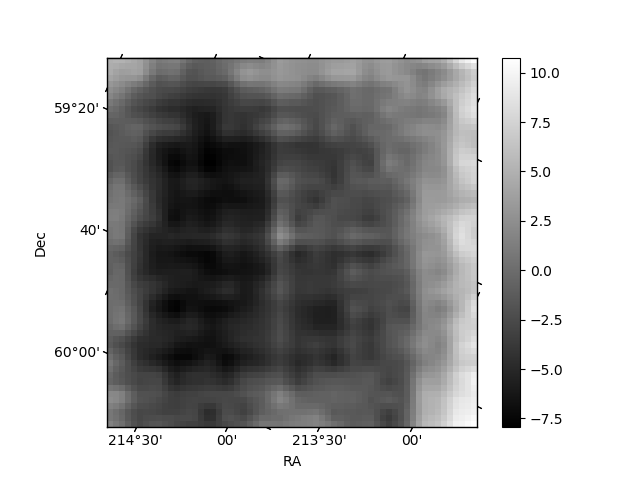
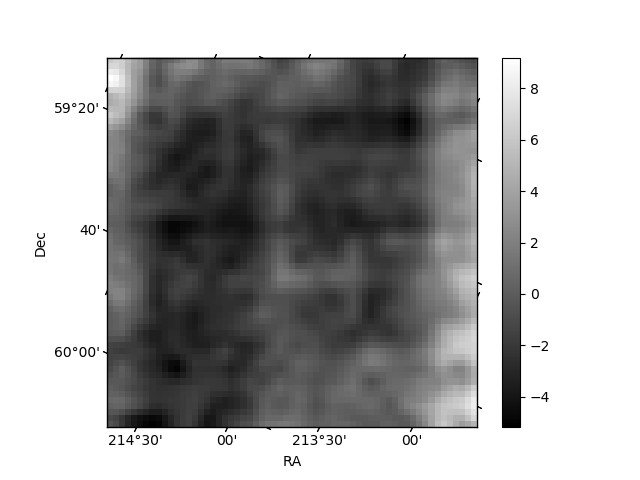
Histogram calculated using DETX and DETY for each event in the final _common_clean file
| Quadrant A | 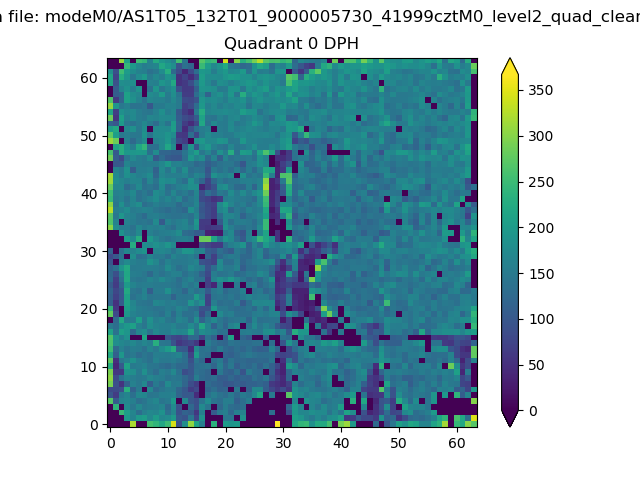 |
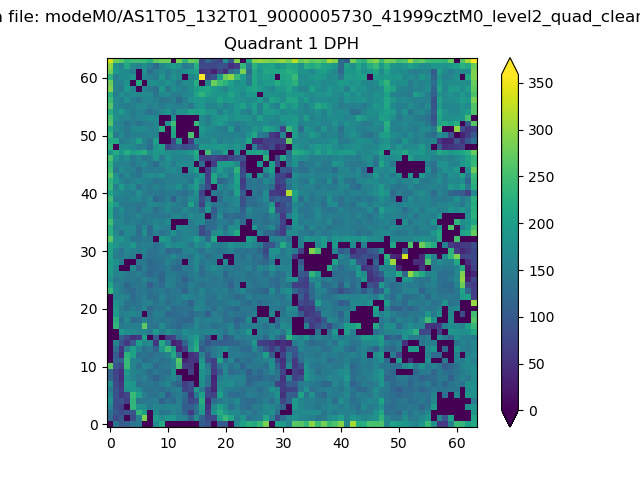 |
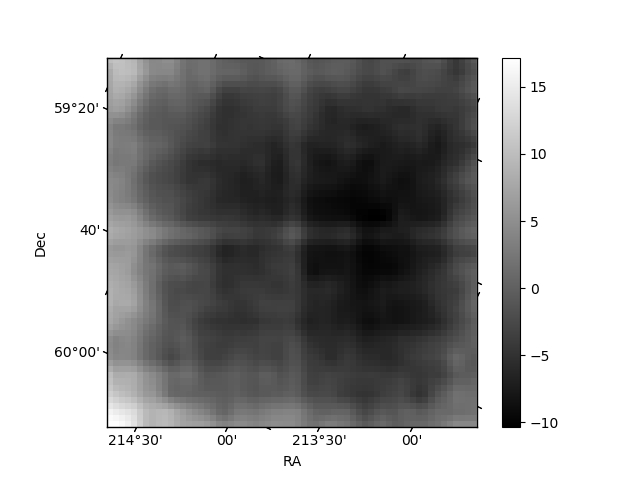
Quadrant B |
|---|---|---|---|
| Quadrant D | 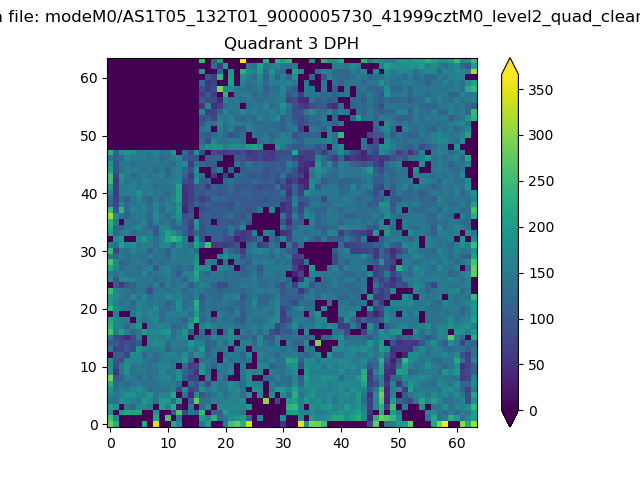 |
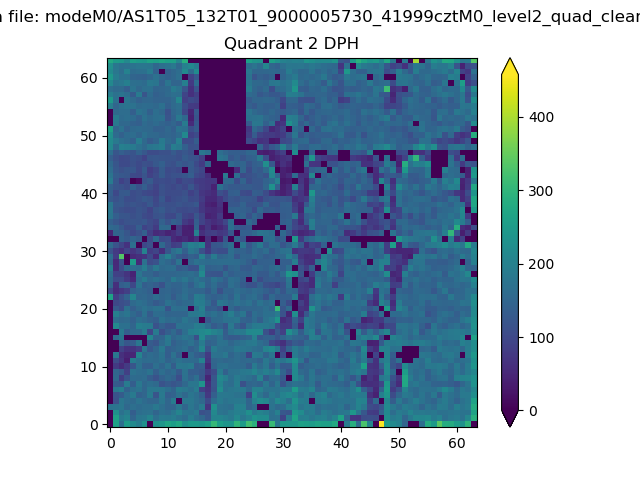 |
Quadrant C |
| Plot type | Count rate plots | Images |
|---|---|---|
| Comparison with Poisson distribution Blue bars denote a histogram of data divided into 1 sec bins. Red curve is a Poisson curve with rate = median count rate of data. |
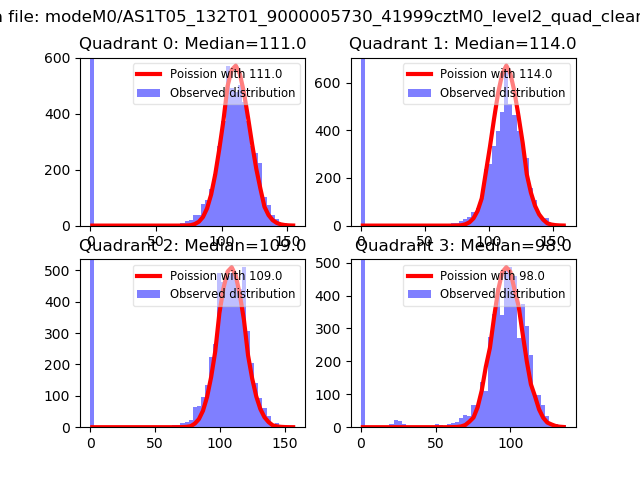 |
 |
| Quadrant-wise count rates Data is divided into 100 sec bins |
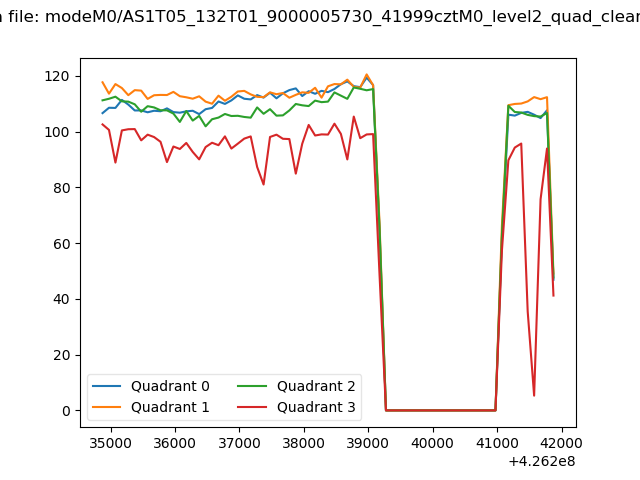 |
|
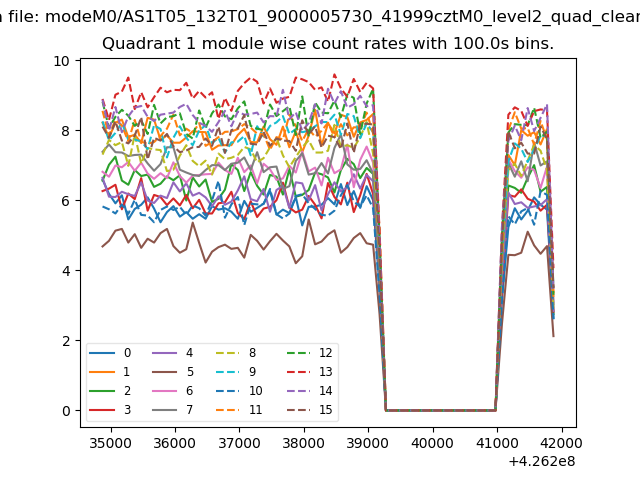
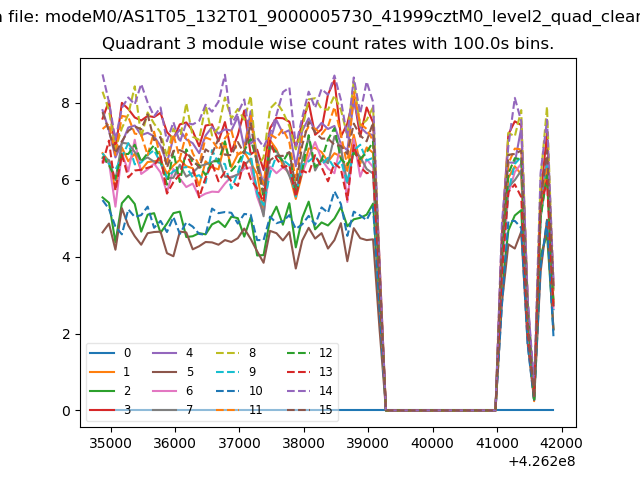
| Module-wise count rates for Quadrant A Data is divided into 100 sec bins |
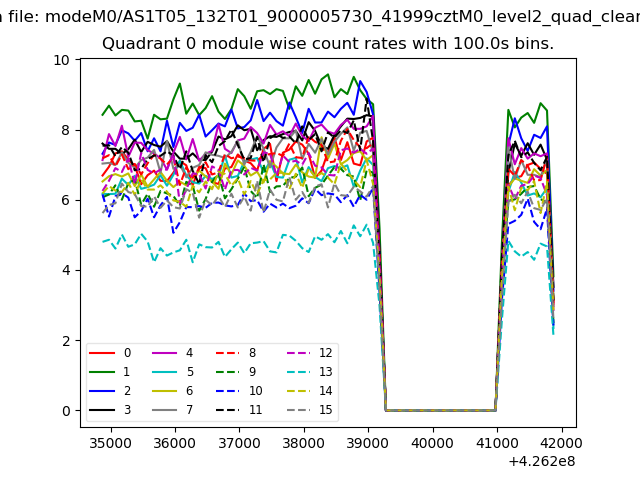 |
 |
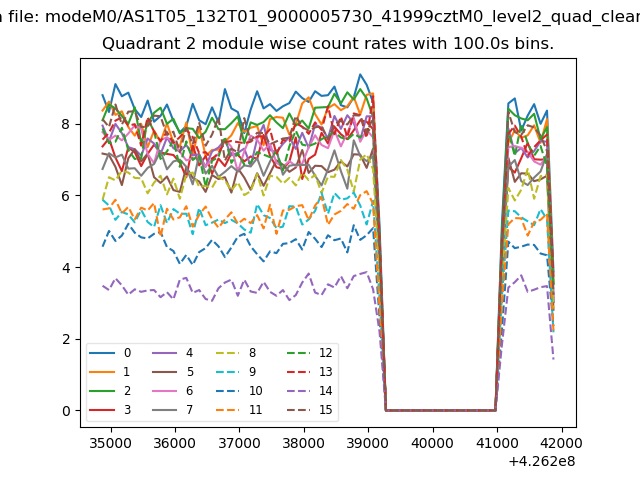
| Module-wise count rates for Quadrant B Data is divided into 100 sec bins |
 |
 |
| Module-wise count rates for Quadrant C Data is divided into 100 sec bins |
 |
 |
| Module-wise count rates for Quadrant D Data is divided into 100 sec bins |
 |
 |
| Parameter | Plot |
|---|---|
| CZT HV Monitor | 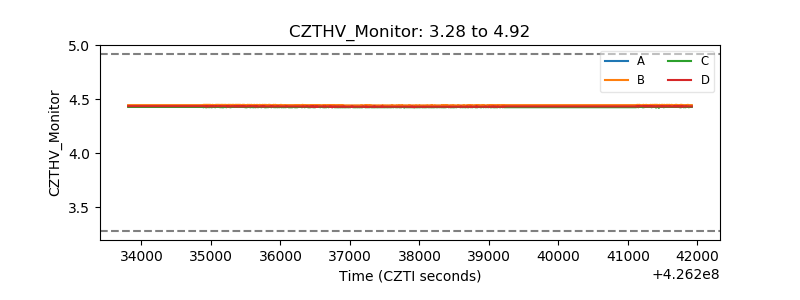 |
| D_VDD | 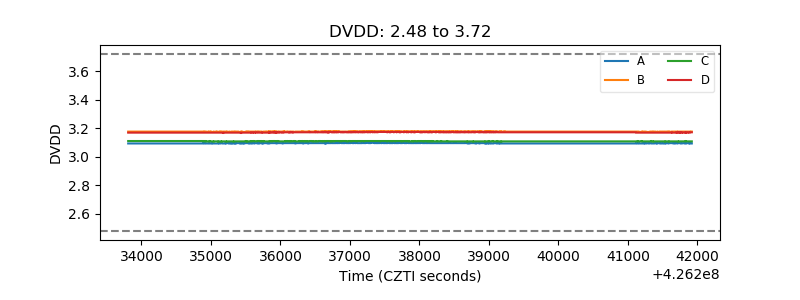 |
| Temperature 1 | 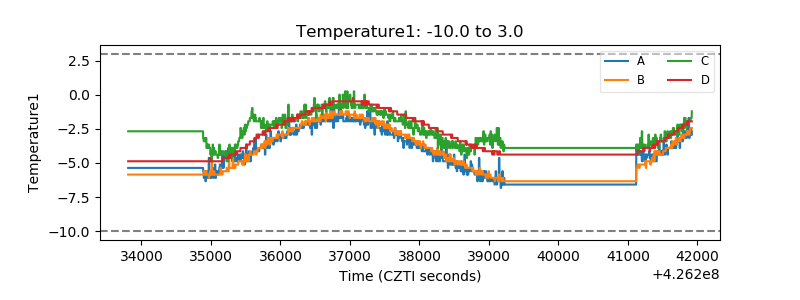 |
| Veto HV Monitor | 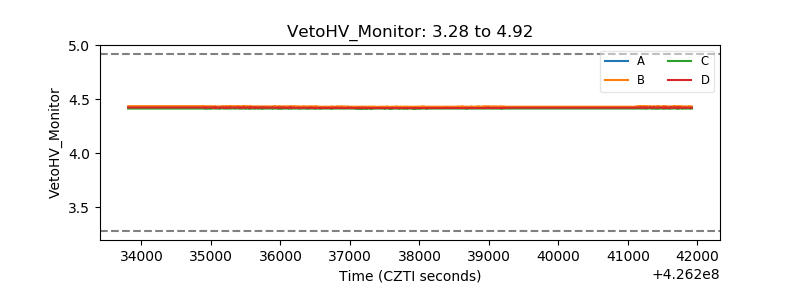 |
| Veto LLD | 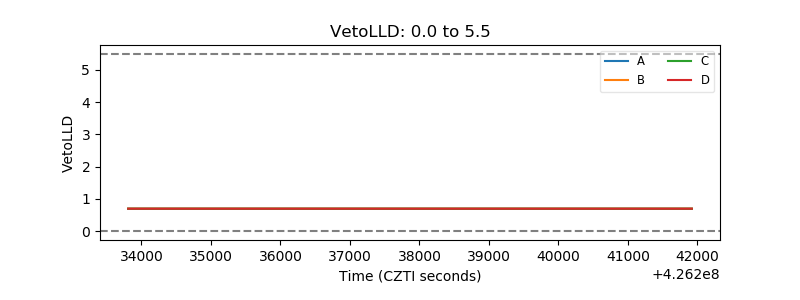 |
| Alpha Counter | 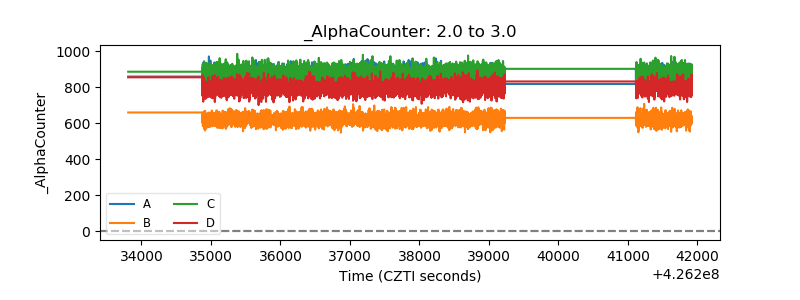 |
| _CPM_Rate | 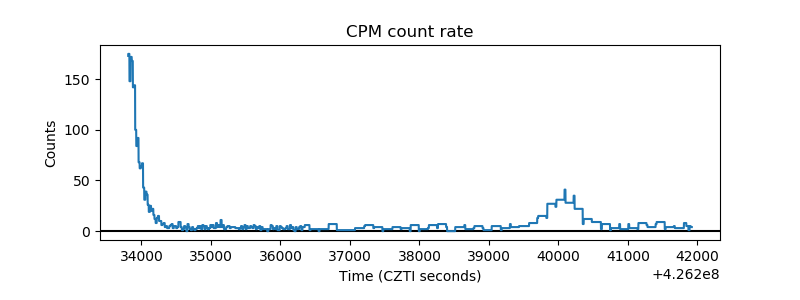 |
| CZT Counter | 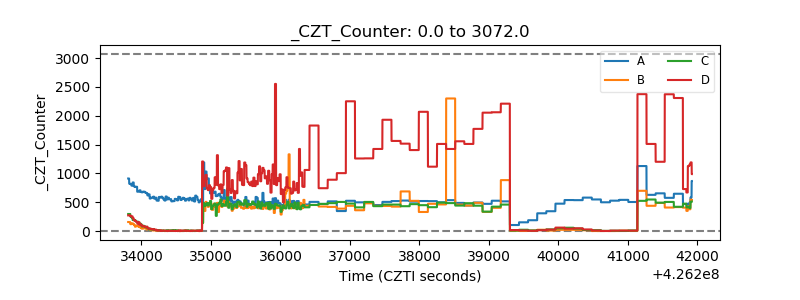 |
| +2.5 Volts monitor | 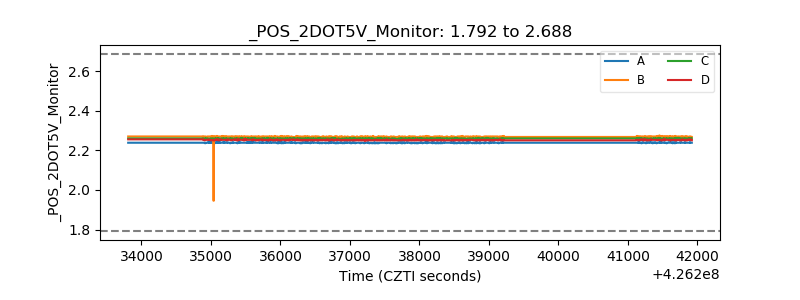 |
| +5 Volts monitor |  |
| _ROLL_ROT | 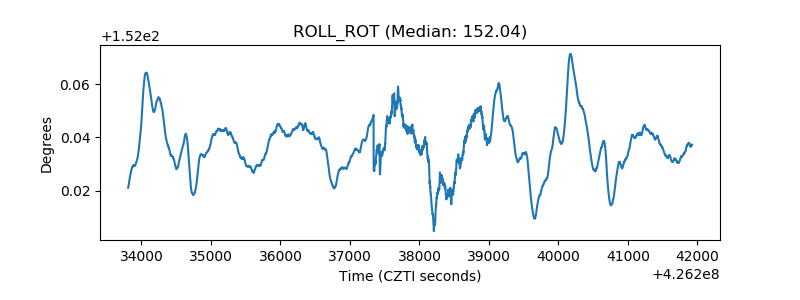 |
| _Roll_DEC | 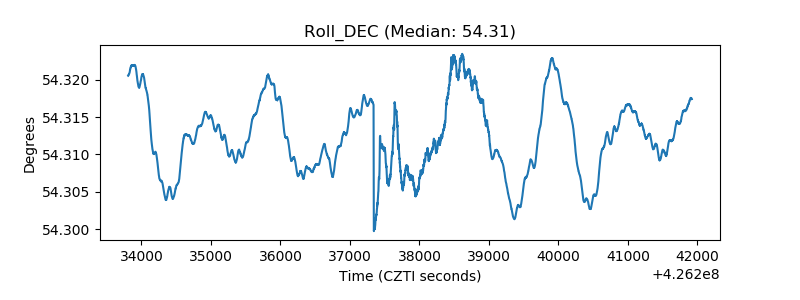 |
| _Roll_RA | 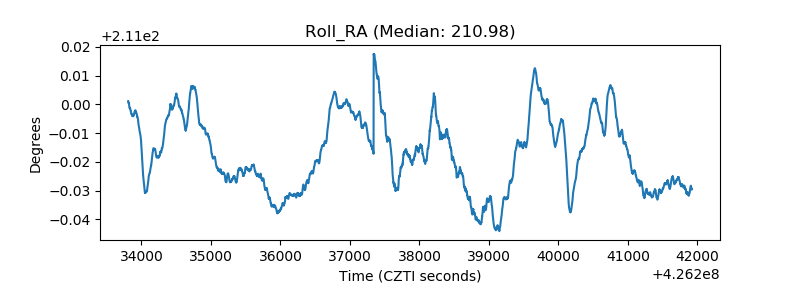 |
| Veto Counter | 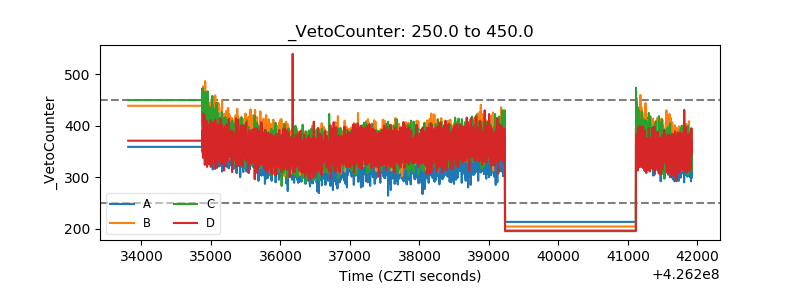 |