| Param | Original file | Final file |
|---|---|---|
| Filename | modeM0/AS1T05_132T01_9000005730_42000cztM0_level2.fits | modeM0/AS1T05_132T01_9000005730_42000cztM0_level2_quad_clean.evt |
| Size (bytes) | 448,378,560 | 89,631,360 |
| Size | 427.6 MB | 85.5 MB |
| Events in quadrant A | 2,994,375 | 610,192 |
| Events in quadrant B | 2,556,332 | 627,568 |
| Events in quadrant C | 2,554,189 | 597,900 |
| Events in quadrant D | 8,055,571 | 484,796 |
| Mode SS | |||
|---|---|---|---|
| Quadrant | BADHDUFLAG | Total packets | Discarded packets |
| A | 0 | 114 | 0 |
| B | 0 | 114 | 0 |
| C | 0 | 114 | 0 |
| D | 0 | 114 | 0 |
| Mode M0 | |||
|---|---|---|---|
| Quadrant | BADHDUFLAG | Total packets | Discarded packets |
| A | 0 | 12240 | 2 |
| B | 0 | 11573 | 2 |
| C | 0 | 11279 | 2 |
| D | 0 | 27855 | 9 |
| Mode M9 | |||
|---|---|---|---|
| Quadrant | BADHDUFLAG | Total packets | Discarded packets |
| A | 0 | 18 | 0 |
| B | 0 | 18 | 0 |
| C | 0 | 19 | 0 |
| D | 0 | 19 | 0 |
| Quadrant | Total seconds | Saturated seconds | Saturation percentage |
|---|---|---|---|
| A | 5629 | 12 | 0.213182% |
| B | 5629 | 9 | 0.159886% |
| C | 5629 | 3 | 0.053295% |
| D | 5628 | 865 | 15.369581% |
Noise dominated data is calculated using 1-second bins in cleaned event files. If a bin has >2000 counts, and if more than 50% of those come from <1% of pixels, then it is considered to be noise-dominated and hence unusable.
| Quadrant | # 1 sec bins | Bins with >0 counts | Bins with >2000 counts | High rate bins dominated by noise | Noise dominated (total time) | Noise dominated (detector-on time) | Marked lightcurve |
|---|---|---|---|---|---|---|---|
| A | 7151 | 5630 | 5 | 5 | 0.07% | 0.09% | 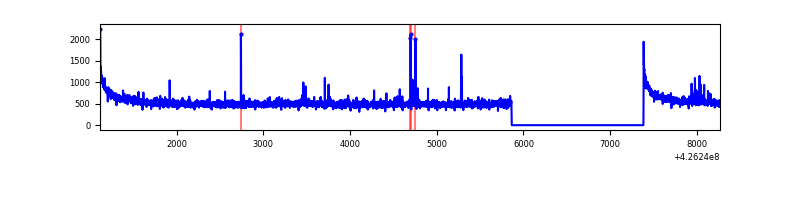 |
| B | 7151 | 5630 | 5 | 5 | 0.07% | 0.09% | 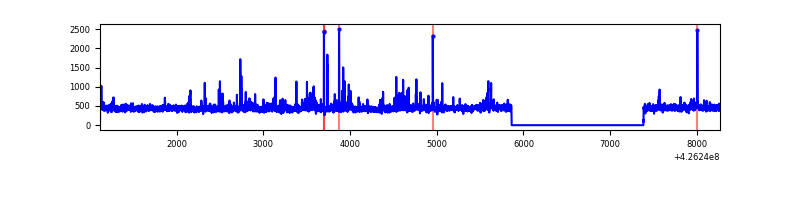 |
| C | 7151 | 5630 | 0 | 0 | 0.00% | 0.00% | 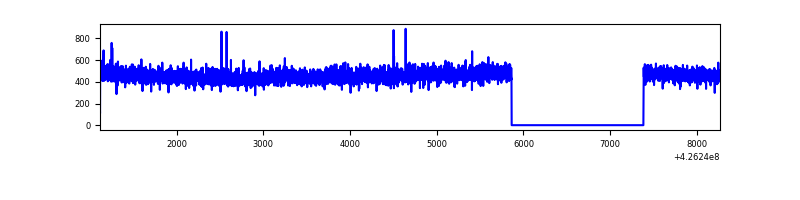 |
| D | 7150 | 5629 | 1006 | 1006 | 14.07% | 17.87% | 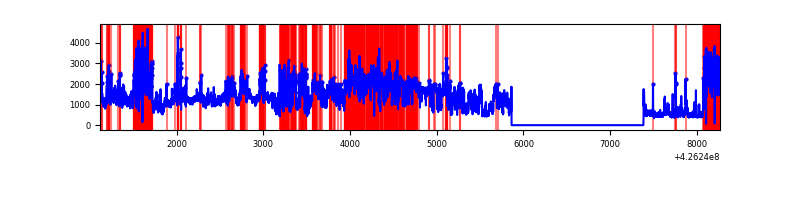 |
Top three noisy pixels from each quadrant. If the there are fewer than three noisy pixels in the level2.evt file, extra rows are filled as -1
| Pixel properties | Quadrant properties | ||||||
|---|---|---|---|---|---|---|---|
| Quadrant | DetID | PixID | Counts | Sigma | Mean | Median | Sigma |
| A | 10 | 83 | 591378 | 4788.91 | 604 | 592 | 123.4 |
| A | 15 | 222 | 28265 | 224.32 | 604 | 592 | 123.4 |
| A | 2 | 79 | 15166 | 118.14 | 604 | 592 | 123.4 |
| B | 0 | 190 | 93980 | 803.06 | 601 | 585 | 116.3 |
| B | 5 | 255 | 28905 | 243.51 | 601 | 585 | 116.3 |
| B | 15 | 85 | 18490 | 153.96 | 601 | 585 | 116.3 |
| C | 15 | 214 | 235561 | 1703.26 | 591 | 597 | 137.9 |
| C | 3 | 233 | 4969 | 31.69 | 591 | 597 | 137.9 |
| C | 13 | 61 | 3973 | 24.47 | 591 | 597 | 137.9 |
| D | 1 | 52 | 4272821 | 31404.78 | 552 | 536 | 136.0 |
| D | 12 | 233 | 716124 | 5260.16 | 552 | 536 | 136.0 |
| D | 13 | 249 | 647537 | 4755.99 | 552 | 536 | 136.0 |
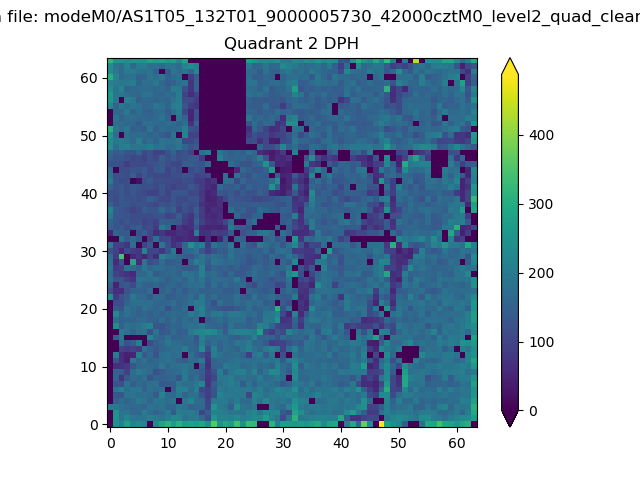
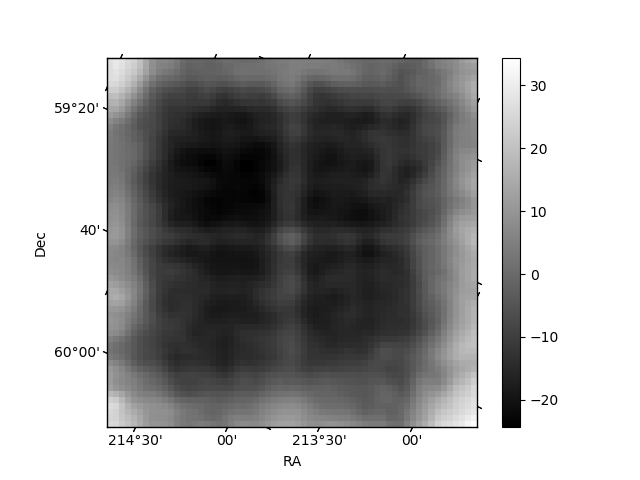
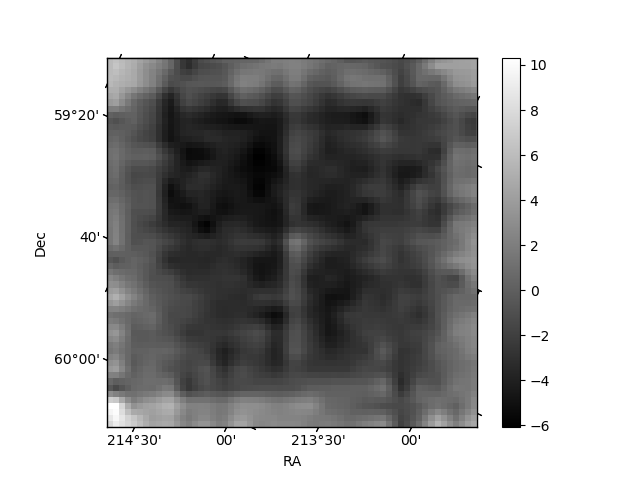
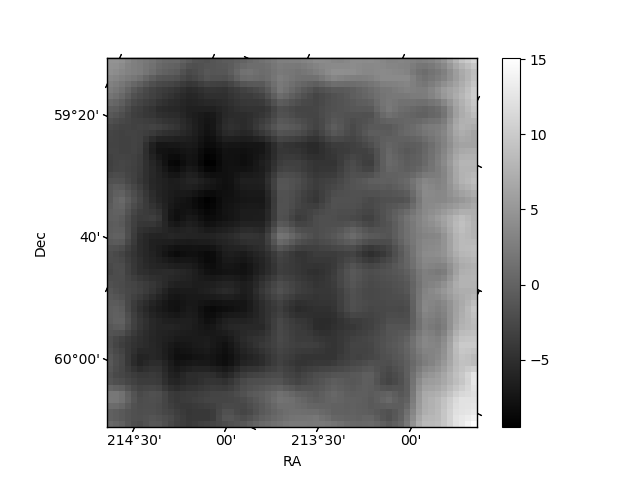
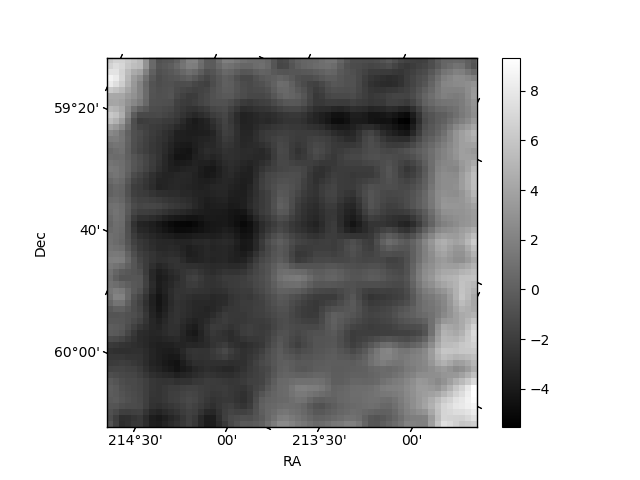
Histogram calculated using DETX and DETY for each event in the final _common_clean file
| Quadrant A | 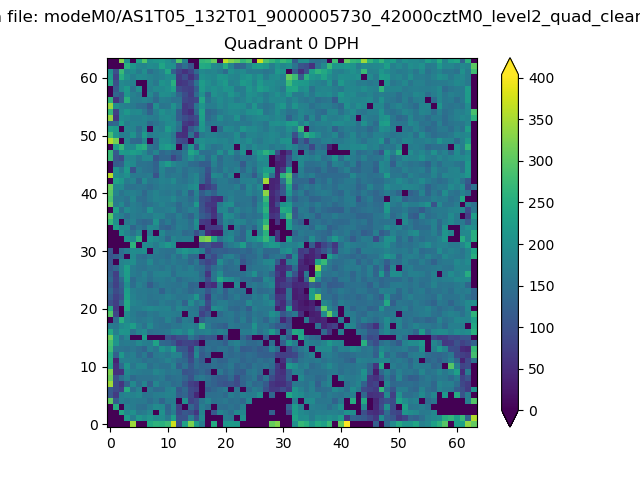 |
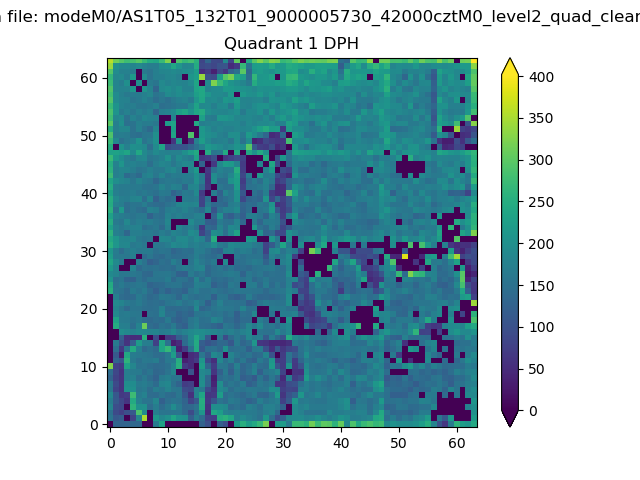 |
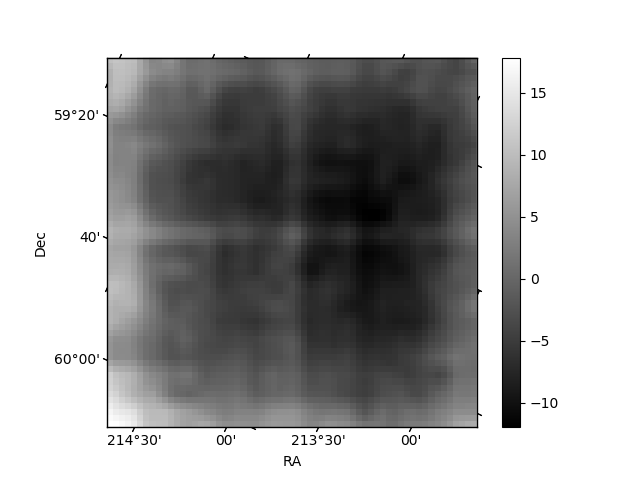
Quadrant B |
|---|---|---|---|
| Quadrant D | 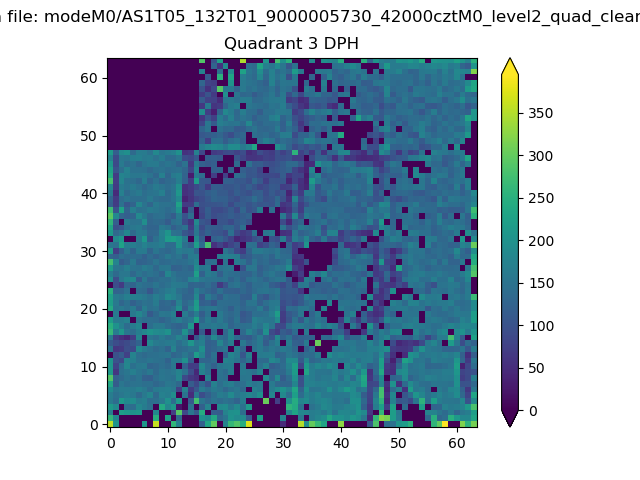 |
 |
Quadrant C |
| Plot type | Count rate plots | Images |
|---|---|---|
| Comparison with Poisson distribution Blue bars denote a histogram of data divided into 1 sec bins. Red curve is a Poisson curve with rate = median count rate of data. |
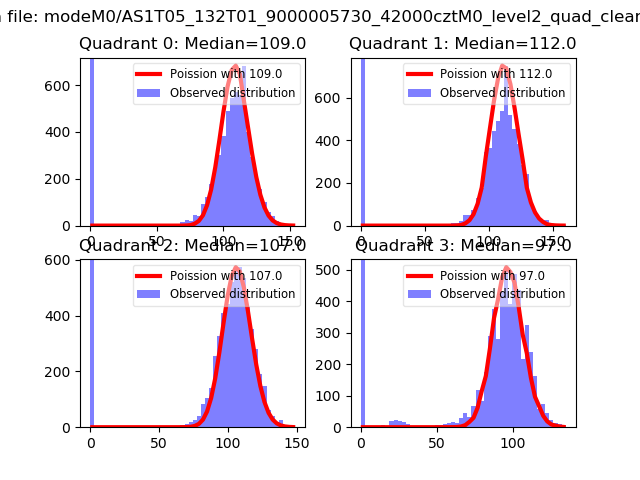 |
 |
| Quadrant-wise count rates Data is divided into 100 sec bins |
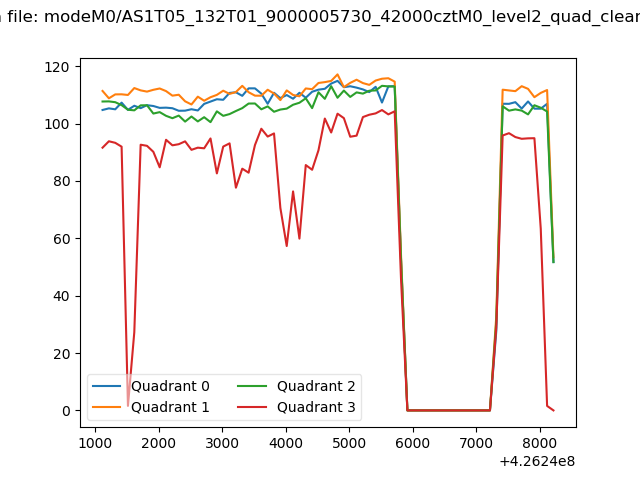 |
|
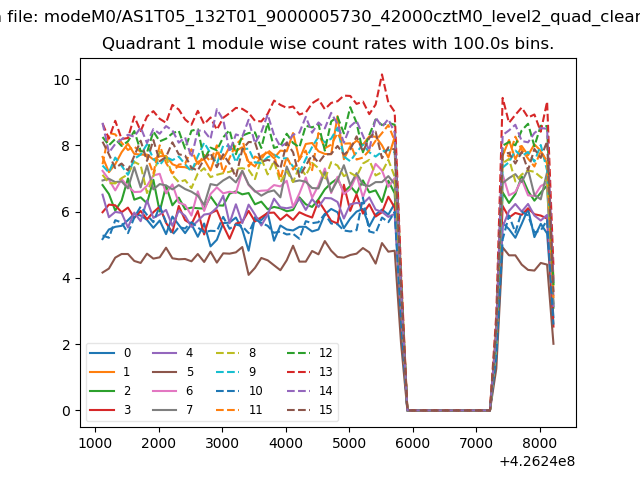
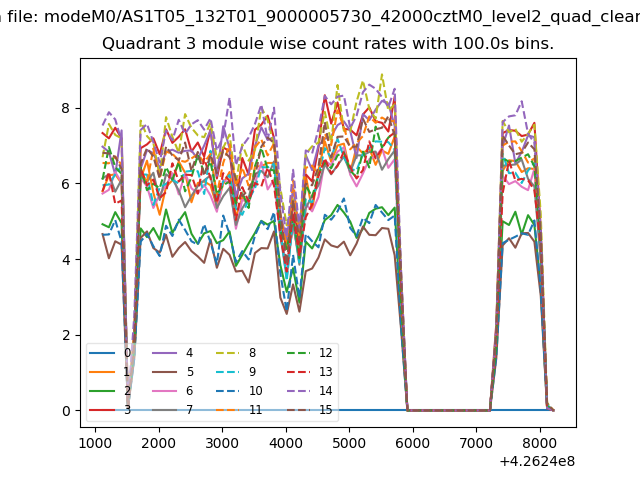
| Module-wise count rates for Quadrant A Data is divided into 100 sec bins |
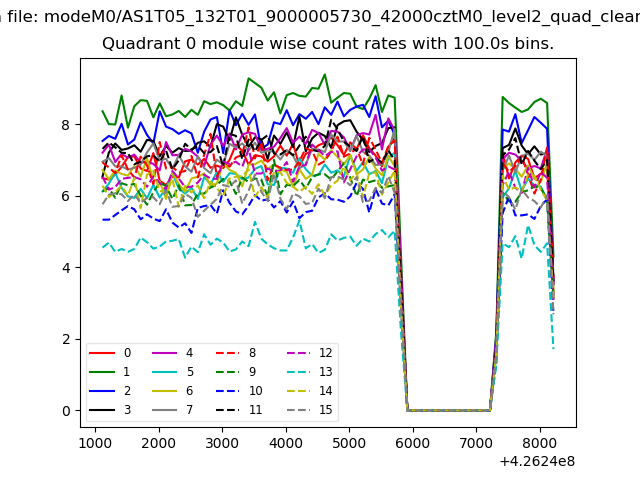 |
 |
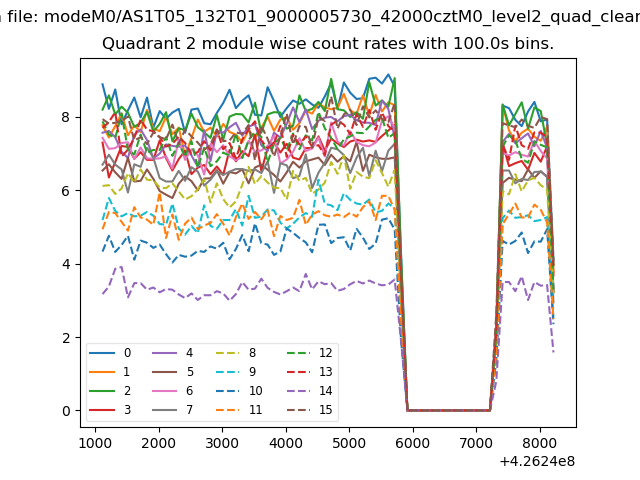
| Module-wise count rates for Quadrant B Data is divided into 100 sec bins |
 |
 |
| Module-wise count rates for Quadrant C Data is divided into 100 sec bins |
 |
 |
| Module-wise count rates for Quadrant D Data is divided into 100 sec bins |
 |
 |
| Parameter | Plot |
|---|---|
| CZT HV Monitor |  |
| D_VDD |  |
| Temperature 1 | 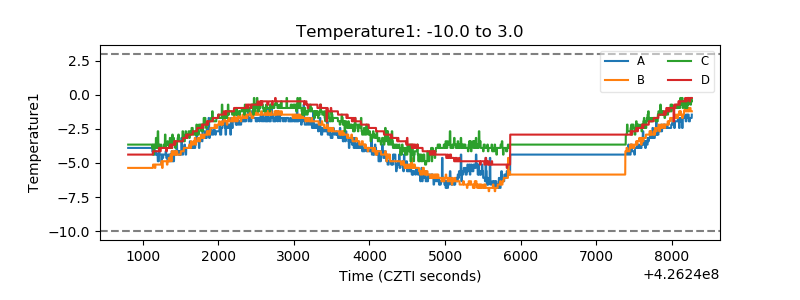 |
| Veto HV Monitor | 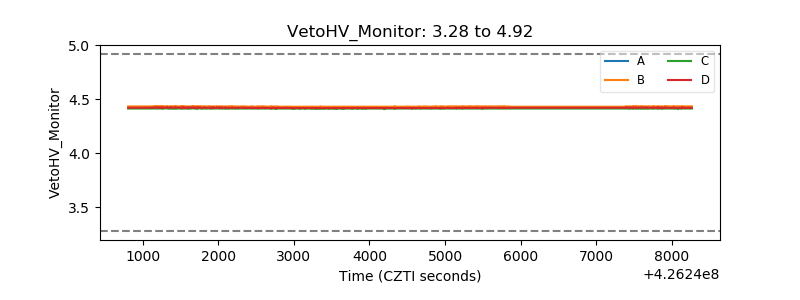 |
| Veto LLD | 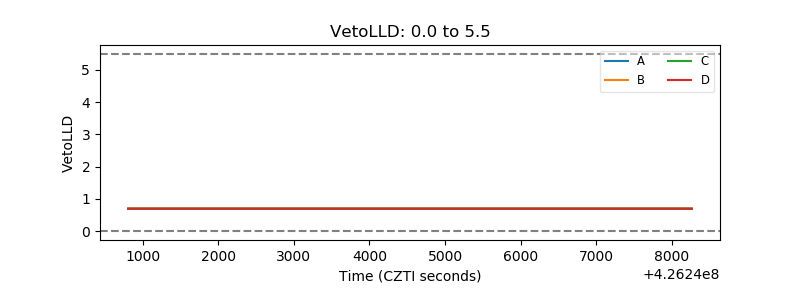 |
| Alpha Counter | 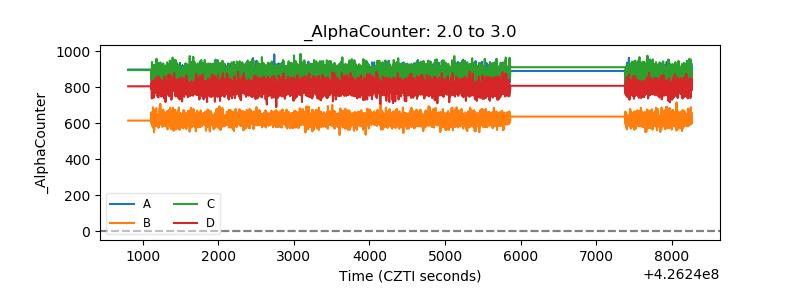 |
| _CPM_Rate | 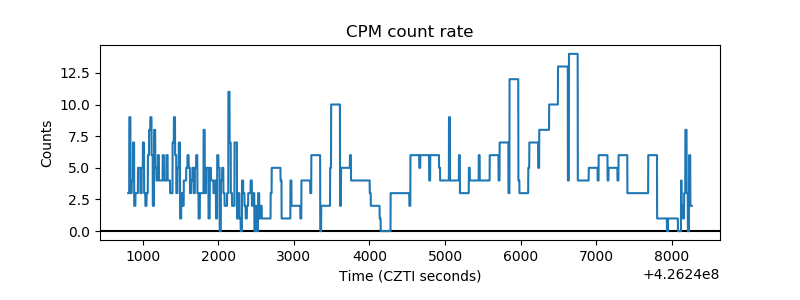 |
| CZT Counter | 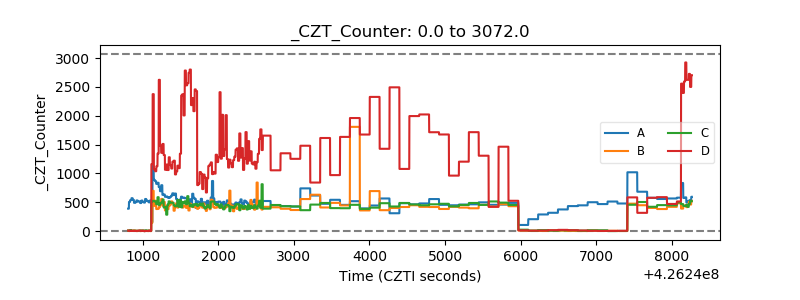 |
| +2.5 Volts monitor | 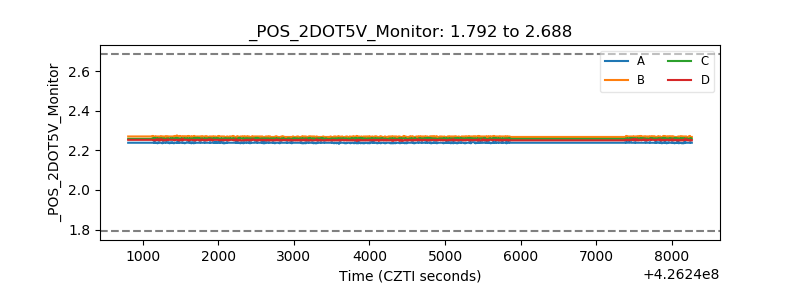 |
| +5 Volts monitor |  |
| _ROLL_ROT | 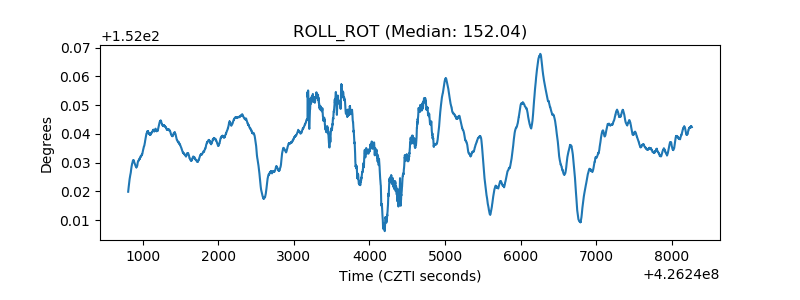 |
| _Roll_DEC | 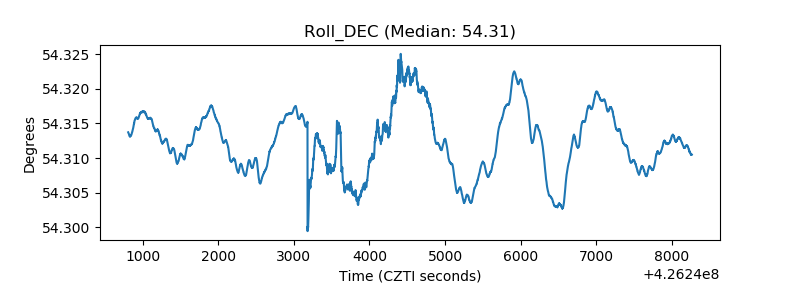 |
| _Roll_RA | 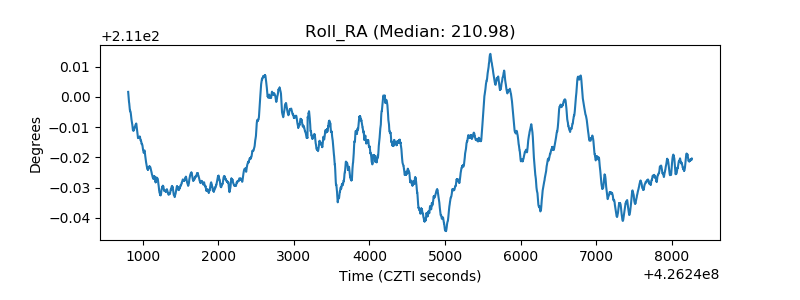 |
| Veto Counter | 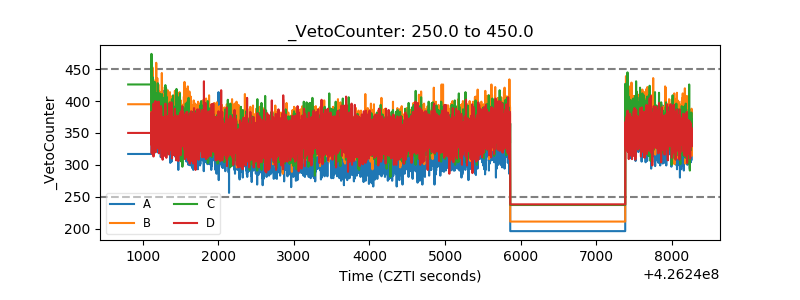 |