| Param | Original file | Final file |
|---|---|---|
| Filename | modeM0/AS1T05_132T01_9000005730_42001cztM0_level2.fits | modeM0/AS1T05_132T01_9000005730_42001cztM0_level2_quad_clean.evt |
| Size (bytes) | 323,608,320 | 54,866,880 |
| Size | 308.6 MB | 52.3 MB |
| Events in quadrant A | 1,967,485 | 398,396 |
| Events in quadrant B | 1,826,323 | 406,473 |
| Events in quadrant C | 1,670,336 | 388,729 |
| Events in quadrant D | 6,223,836 | 204,568 |
| Mode SS | |||
|---|---|---|---|
| Quadrant | BADHDUFLAG | Total packets | Discarded packets |
| A | 0 | 74 | 0 |
| B | 0 | 74 | 0 |
| C | 0 | 74 | 0 |
| D | 0 | 74 | 0 |
| Mode M0 | |||
|---|---|---|---|
| Quadrant | BADHDUFLAG | Total packets | Discarded packets |
| A | 0 | 8067 | 1 |
| B | 0 | 8098 | 1 |
| C | 0 | 7488 | 1 |
| D | 0 | 21066 | 1 |
| Quadrant | Total seconds | Saturated seconds | Saturation percentage |
|---|---|---|---|
| A | 3720 | 20 | 0.537634% |
| B | 3721 | 38 | 1.021231% |
| C | 3721 | 1 | 0.026874% |
| D | 3721 | 1728 | 46.439129% |
Noise dominated data is calculated using 1-second bins in cleaned event files. If a bin has >2000 counts, and if more than 50% of those come from <1% of pixels, then it is considered to be noise-dominated and hence unusable.
| Quadrant | # 1 sec bins | Bins with >0 counts | Bins with >2000 counts | High rate bins dominated by noise | Noise dominated (total time) | Noise dominated (detector-on time) | Marked lightcurve |
|---|---|---|---|---|---|---|---|
| A | 3720 | 3720 | 12 | 12 | 0.32% | 0.32% | 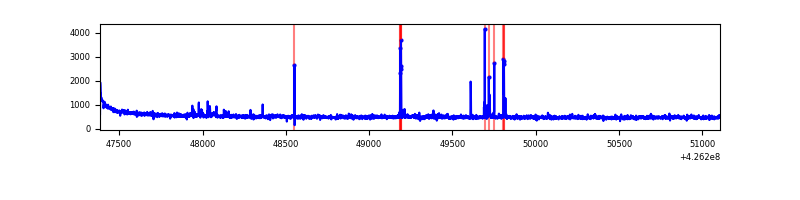 |
| B | 3721 | 3721 | 29 | 29 | 0.78% | 0.78% | 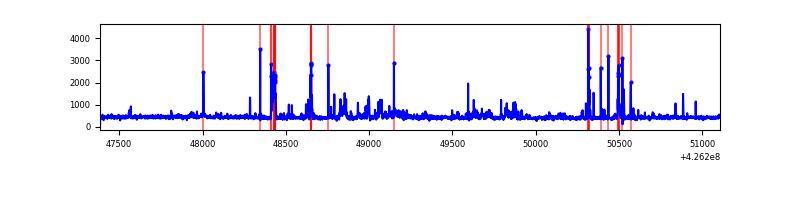 |
| C | 3721 | 3721 | 0 | 0 | 0.00% | 0.00% | 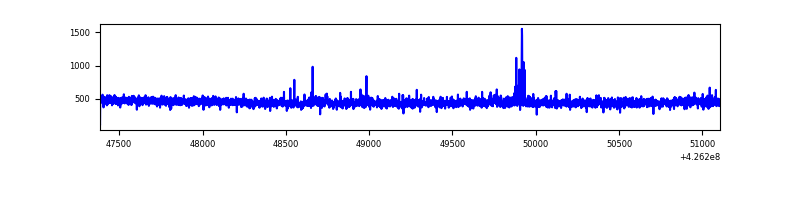 |
| D | 3721 | 3721 | 1685 | 1685 | 45.28% | 45.28% | 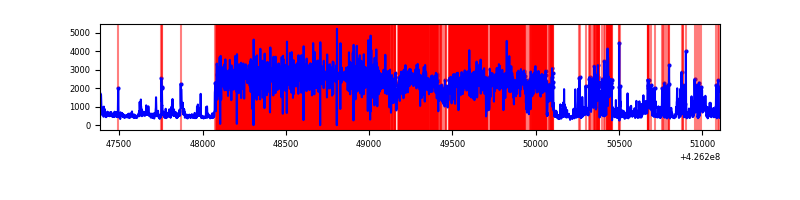 |
Top three noisy pixels from each quadrant. If the there are fewer than three noisy pixels in the level2.evt file, extra rows are filled as -1
| Pixel properties | Quadrant properties | ||||||
|---|---|---|---|---|---|---|---|
| Quadrant | DetID | PixID | Counts | Sigma | Mean | Median | Sigma |
| A | 10 | 83 | 372323 | 4613.32 | 389 | 381 | 80.6 |
| A | 15 | 222 | 53944 | 664.36 | 389 | 381 | 80.6 |
| A | 15 | 223 | 20762 | 252.79 | 389 | 381 | 80.6 |
| B | 5 | 255 | 90337 | 1204.77 | 385 | 375 | 74.7 |
| B | 3 | 112 | 85300 | 1137.32 | 385 | 375 | 74.7 |
| B | 0 | 190 | 79961 | 1065.82 | 385 | 375 | 74.7 |
| C | 15 | 214 | 157177 | 1743.8 | 381 | 384 | 89.9 |
| C | 15 | 111 | 18393 | 200.29 | 381 | 384 | 89.9 |
| C | 12 | 249 | 3500 | 34.66 | 381 | 384 | 89.9 |
| D | 12 | 233 | 4281586 | 57830.8 | 288 | 279 | 74.0 |
| D | 1 | 52 | 247930 | 3345.21 | 288 | 279 | 74.0 |
| D | 13 | 249 | 203976 | 2751.49 | 288 | 279 | 74.0 |
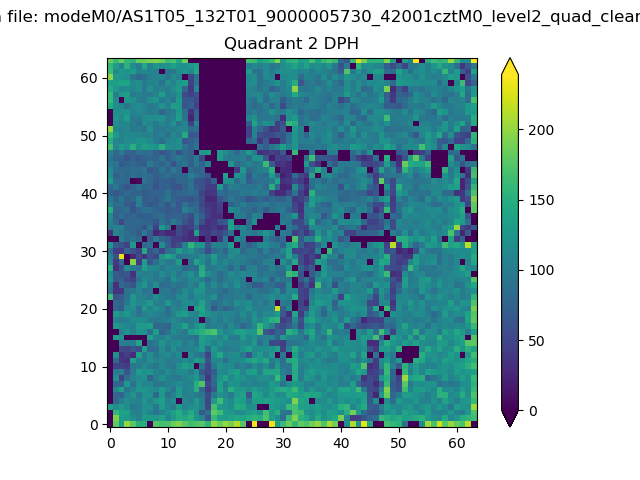
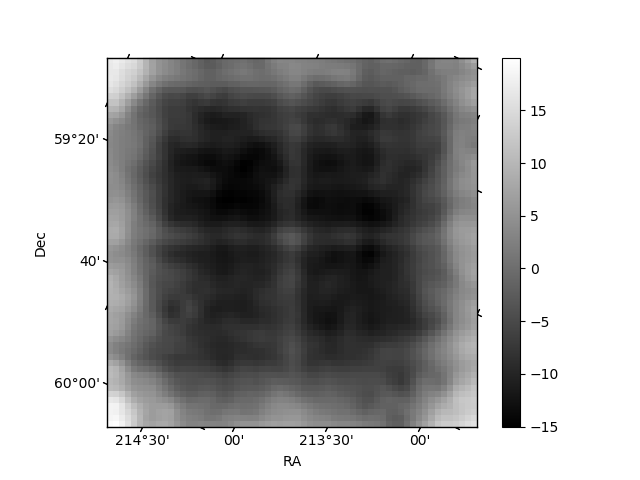
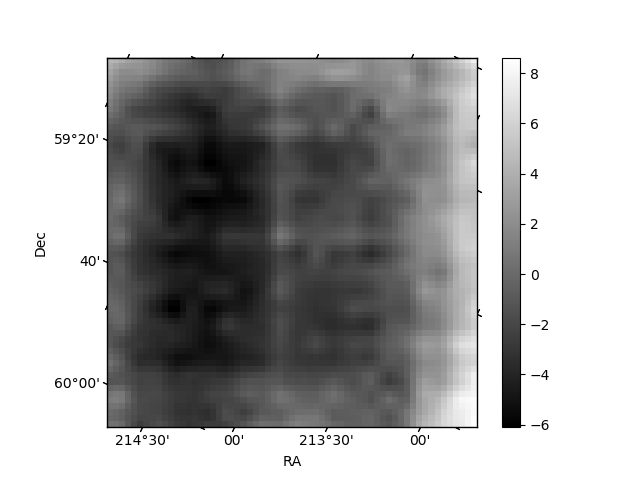
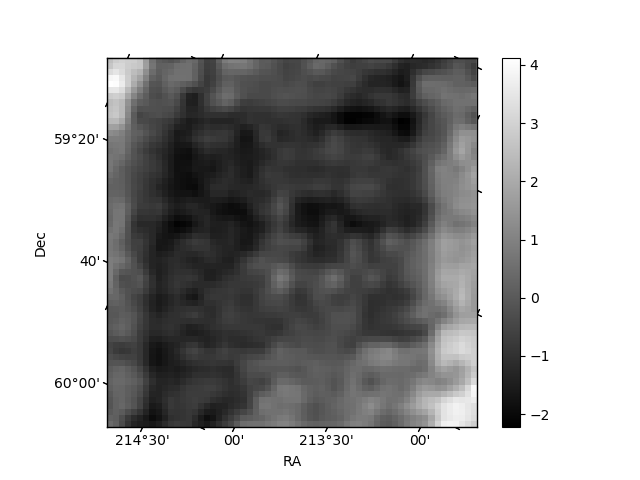
Histogram calculated using DETX and DETY for each event in the final _common_clean file
| Quadrant A | 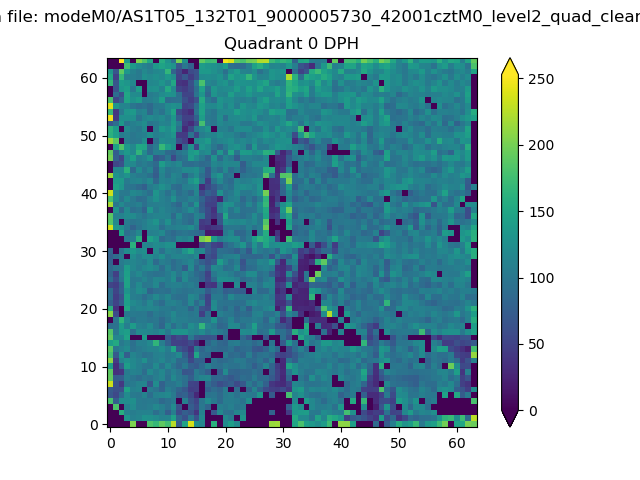 |
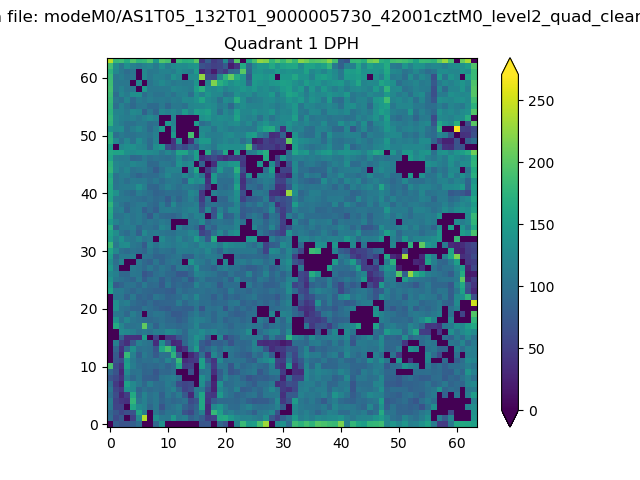 |
Quadrant B |
|---|---|---|---|
| Quadrant D | 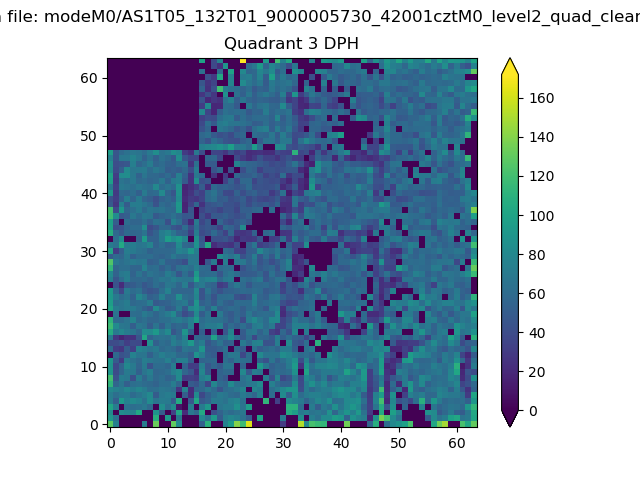 |
 |
Quadrant C |
| Plot type | Count rate plots | Images |
|---|---|---|
| Comparison with Poisson distribution Blue bars denote a histogram of data divided into 1 sec bins. Red curve is a Poisson curve with rate = median count rate of data. |
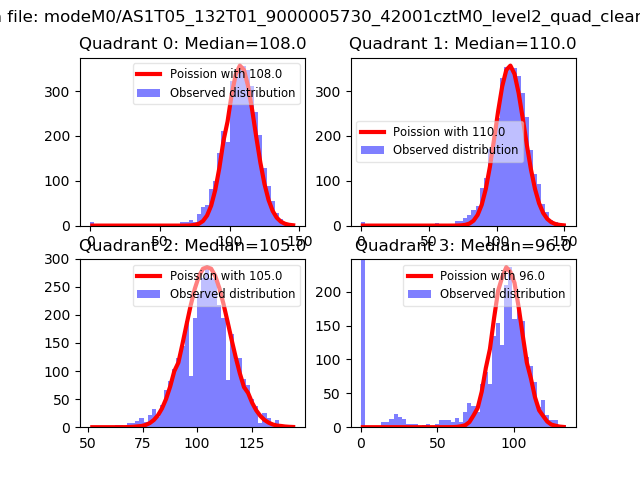 |
 |
| Quadrant-wise count rates Data is divided into 100 sec bins |
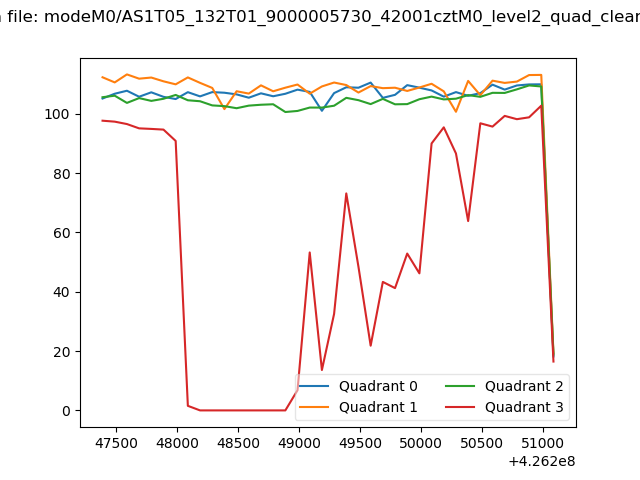 |
|
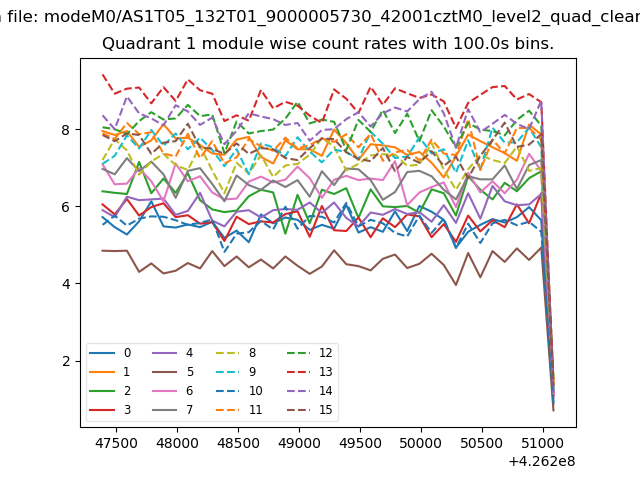
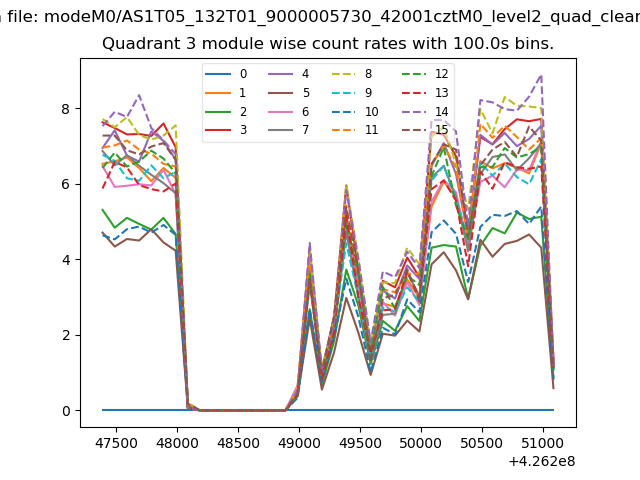
| Module-wise count rates for Quadrant A Data is divided into 100 sec bins |
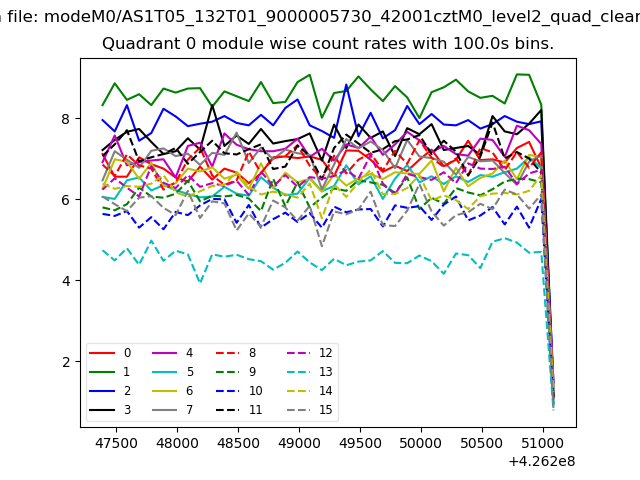 |
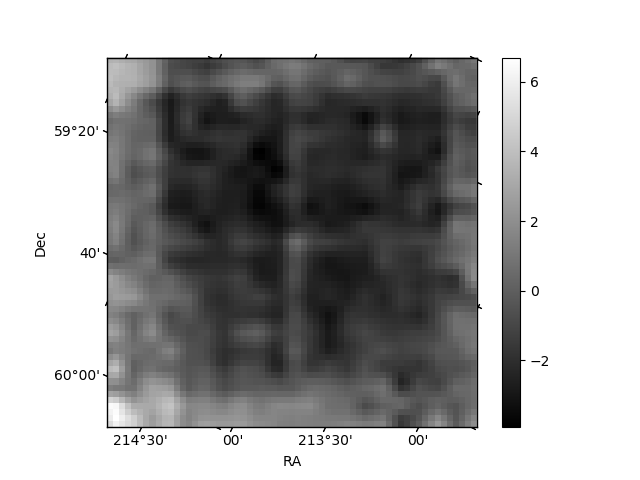 |
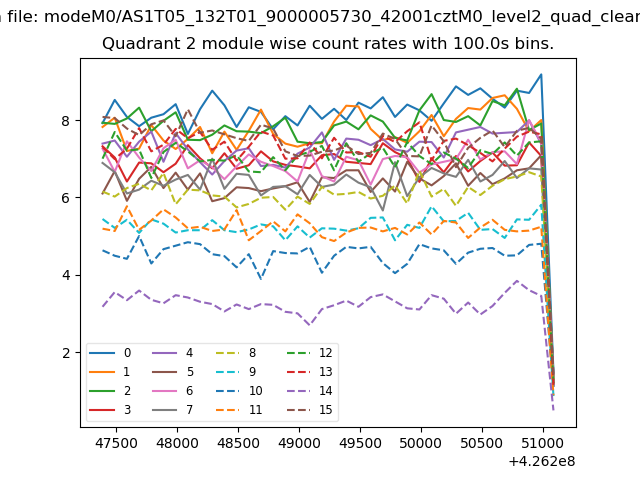
| Module-wise count rates for Quadrant B Data is divided into 100 sec bins |
 |
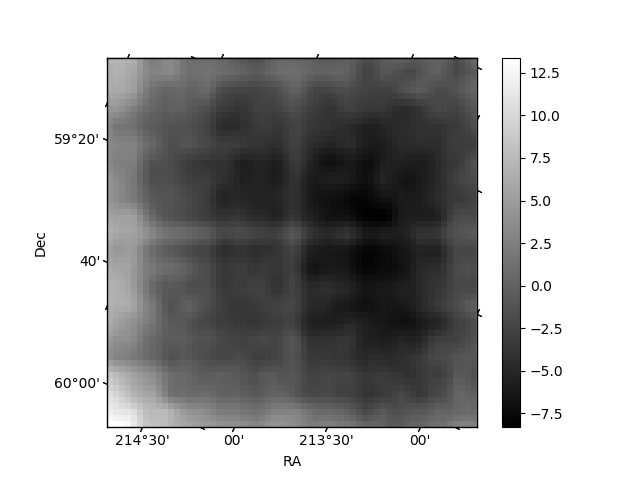 |
| Module-wise count rates for Quadrant C Data is divided into 100 sec bins |
 |
 |
| Module-wise count rates for Quadrant D Data is divided into 100 sec bins |
 |
 |
| Parameter | Plot |
|---|---|
| CZT HV Monitor | 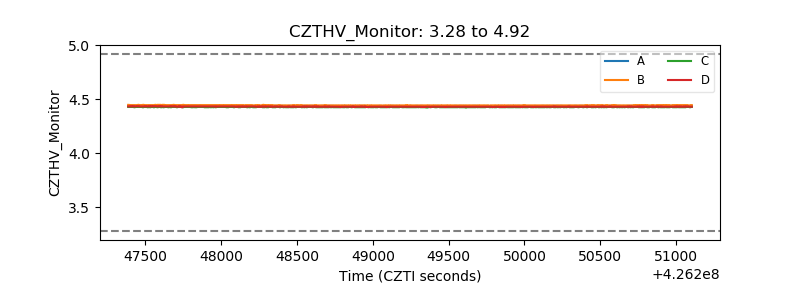 |
| D_VDD | 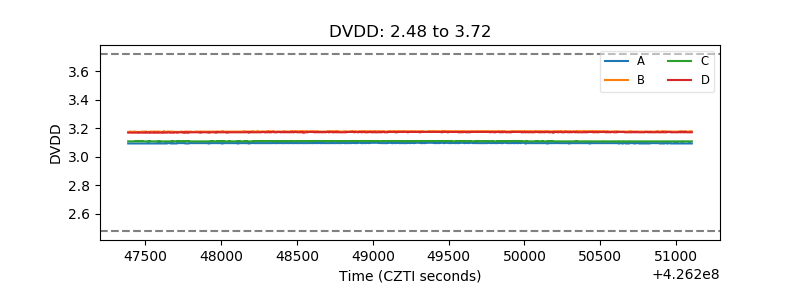 |
| Temperature 1 | 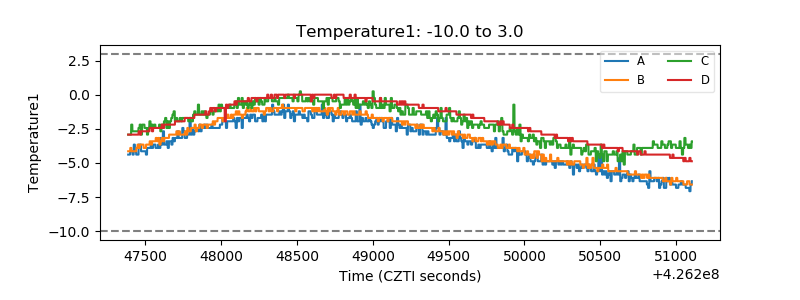 |
| Veto HV Monitor | 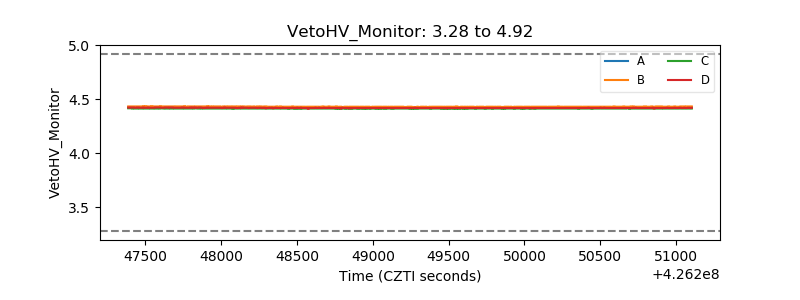 |
| Veto LLD | 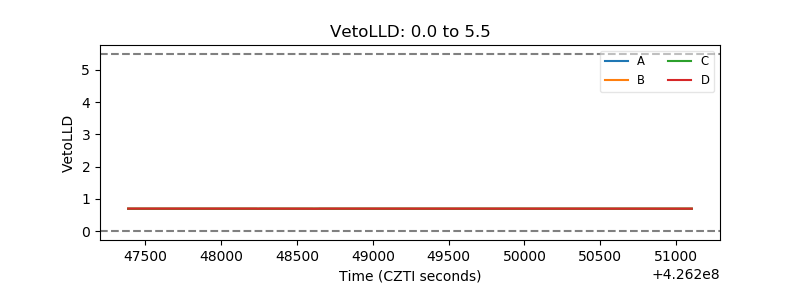 |
| Alpha Counter | 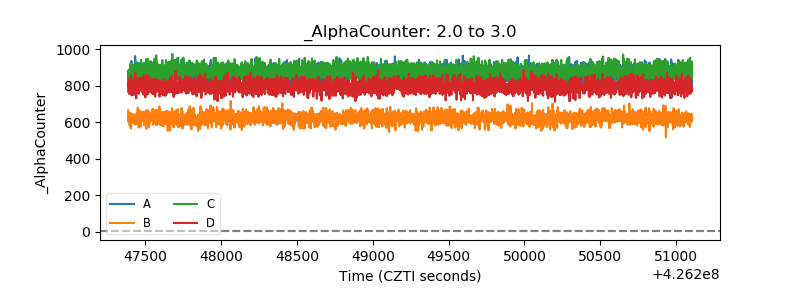 |
| _CPM_Rate | 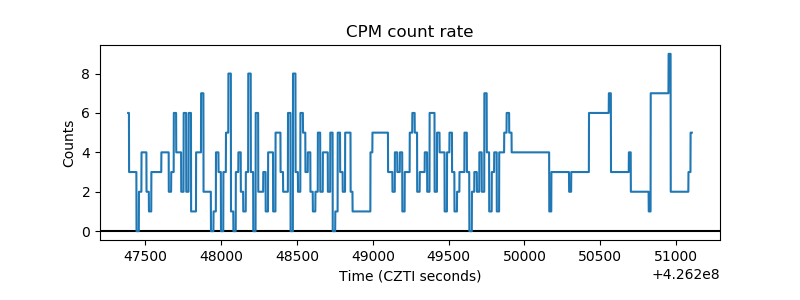 |
| CZT Counter | 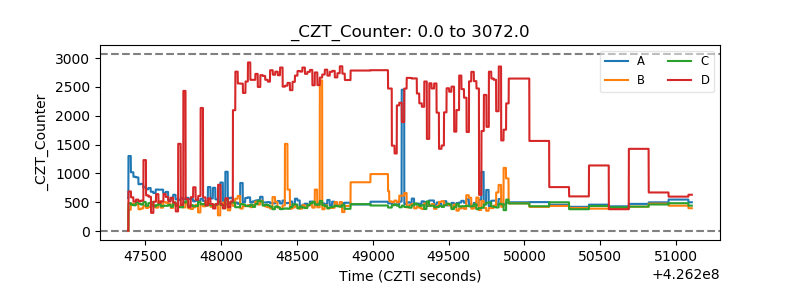 |
| +2.5 Volts monitor | 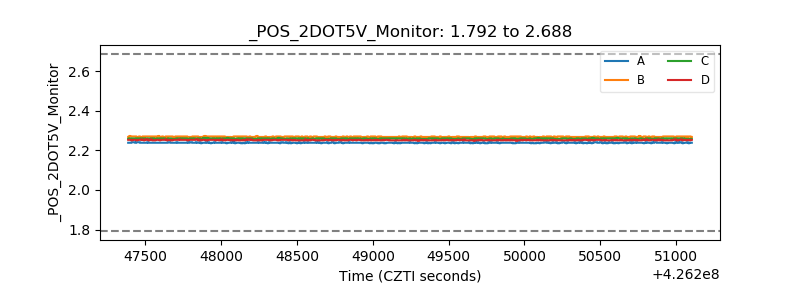 |
| +5 Volts monitor |  |
| _ROLL_ROT | 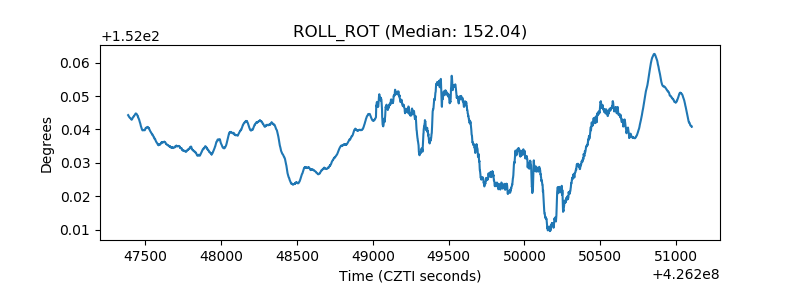 |
| _Roll_DEC | 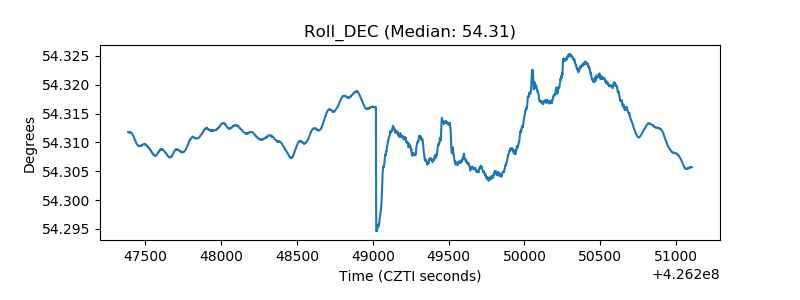 |
| _Roll_RA | 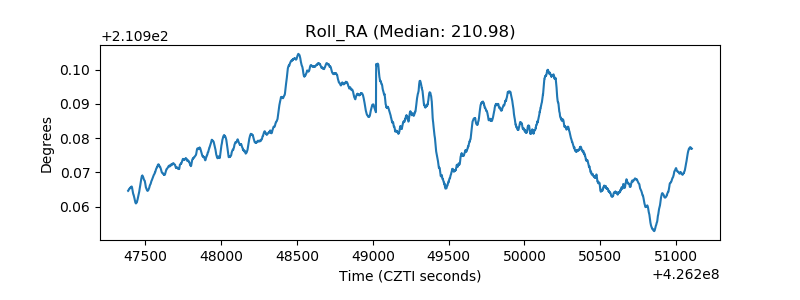 |
| Veto Counter | 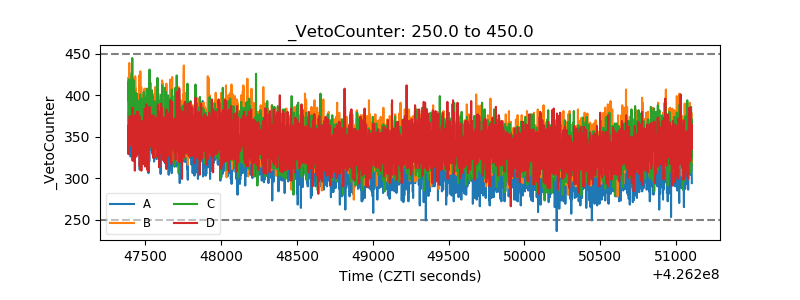 |