| Param | Original file | Final file |
|---|---|---|
| Filename | modeM0/AS1A12_011T26_9000005732_42001cztM0_level2.fits | modeM0/AS1A12_011T26_9000005732_42001cztM0_level2_quad_clean.evt |
| Size (bytes) | 134,470,080 | 28,630,080 |
| Size | 128.2 MB | 27.3 MB |
| Events in quadrant A | 1,026,959 | 194,330 |
| Events in quadrant B | 1,597,995 | 180,105 |
| Events in quadrant C | 849,419 | 189,986 |
| Events in quadrant D | 1,362,895 | 172,850 |
| Mode M0 | |||
|---|---|---|---|
| Quadrant | BADHDUFLAG | Total packets | Discarded packets |
| A | 0 | 4066 | 1 |
| B | 0 | 5919 | 1 |
| C | 0 | 3596 | 1 |
| D | 0 | 5280 | 1 |
| Mode M9 | |||
|---|---|---|---|
| Quadrant | BADHDUFLAG | Total packets | Discarded packets |
| A | 0 | 13 | 0 |
| B | 0 | 13 | 0 |
| C | 0 | 13 | 0 |
| D | 0 | 13 | 0 |
| Mode SS | |||
|---|---|---|---|
| Quadrant | BADHDUFLAG | Total packets | Discarded packets |
| A | 0 | 38 | 0 |
| B | 0 | 38 | 0 |
| C | 0 | 38 | 0 |
| D | 0 | 38 | 0 |
| Quadrant | Total seconds | Saturated seconds | Saturation percentage |
|---|---|---|---|
| A | 1772 | 10 | 0.564334% |
| B | 1772 | 228 | 12.866817% |
| C | 1772 | 1 | 0.056433% |
| D | 1772 | 59 | 3.329571% |
Noise dominated data is calculated using 1-second bins in cleaned event files. If a bin has >2000 counts, and if more than 50% of those come from <1% of pixels, then it is considered to be noise-dominated and hence unusable.
| Quadrant | # 1 sec bins | Bins with >0 counts | Bins with >2000 counts | High rate bins dominated by noise | Noise dominated (total time) | Noise dominated (detector-on time) | Marked lightcurve |
|---|---|---|---|---|---|---|---|
| A | 3115 | 1773 | 3 | 3 | 0.10% | 0.17% | 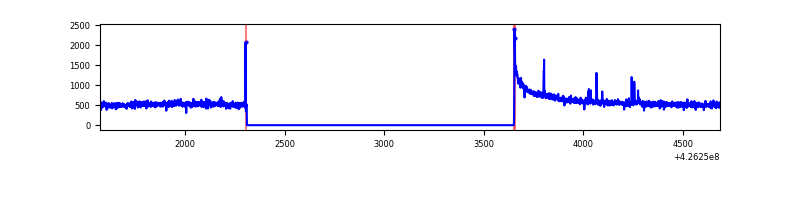 |
| B | 3115 | 1773 | 164 | 164 | 5.26% | 9.25% | 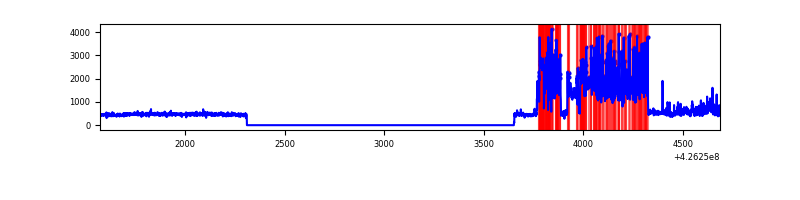 |
| C | 3115 | 1773 | 0 | 0 | 0.00% | 0.00% | 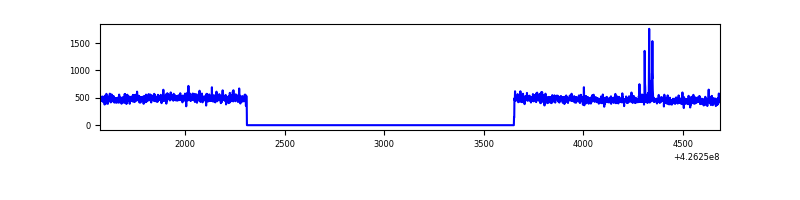 |
| D | 3115 | 1773 | 51 | 51 | 1.64% | 2.88% | 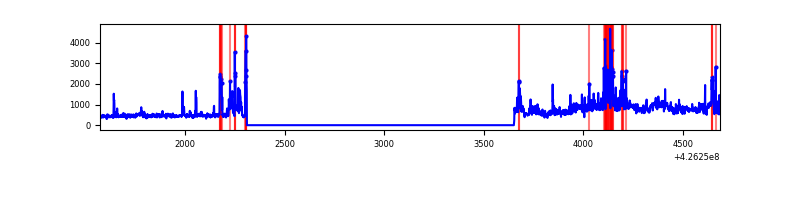 |
Top three noisy pixels from each quadrant. If the there are fewer than three noisy pixels in the level2.evt file, extra rows are filled as -1
| Pixel properties | Quadrant properties | ||||||
|---|---|---|---|---|---|---|---|
| Quadrant | DetID | PixID | Counts | Sigma | Mean | Median | Sigma |
| A | 10 | 83 | 231049 | 5394.57 | 200 | 195 | 42.8 |
| A | 15 | 223 | 9888 | 226.5 | 200 | 195 | 42.8 |
| A | 13 | 6 | 5018 | 112.7 | 200 | 195 | 42.8 |
| B | 0 | 186 | 797084 | 21168.43 | 187 | 182 | 37.6 |
| B | 0 | 190 | 46755 | 1237.14 | 187 | 182 | 37.6 |
| B | 5 | 255 | 6799 | 175.77 | 187 | 182 | 37.6 |
| C | 15 | 214 | 75951 | 1605.0 | 194 | 195 | 47.2 |
| C | 15 | 111 | 9839 | 204.32 | 194 | 195 | 47.2 |
| C | 8 | 229 | 3027 | 60.0 | 194 | 195 | 47.2 |
| D | 1 | 52 | 317357 | 6542.82 | 192 | 187 | 48.5 |
| D | 12 | 218 | 107880 | 2221.57 | 192 | 187 | 48.5 |
| D | 13 | 249 | 70568 | 1451.87 | 192 | 187 | 48.5 |
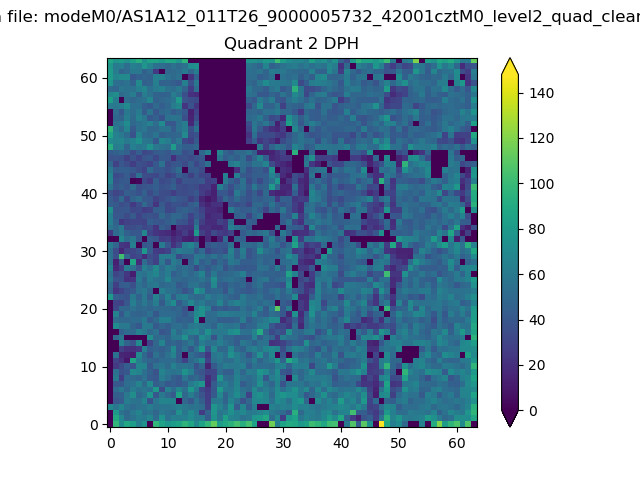
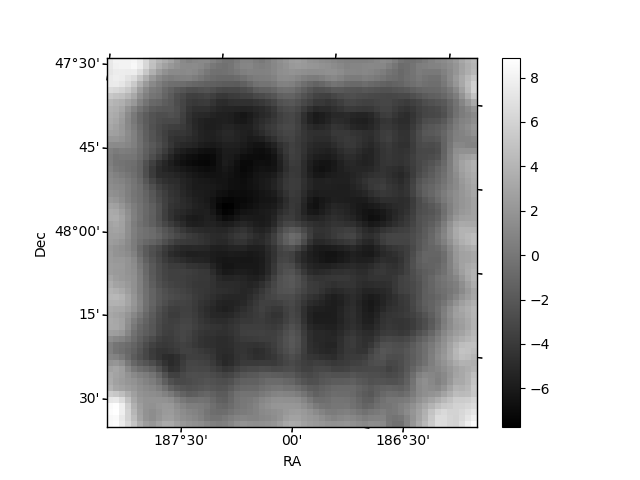
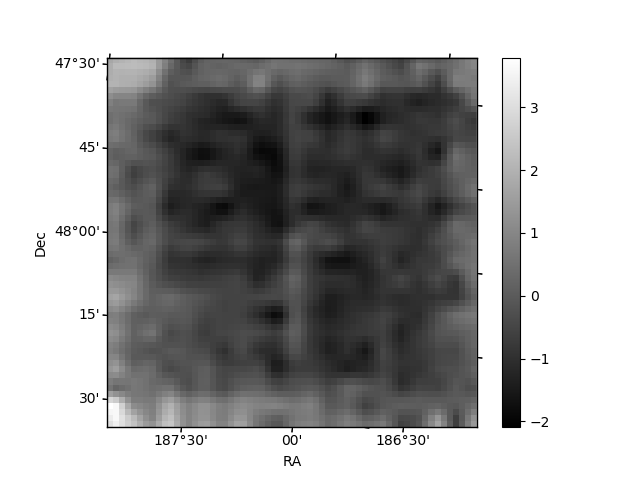
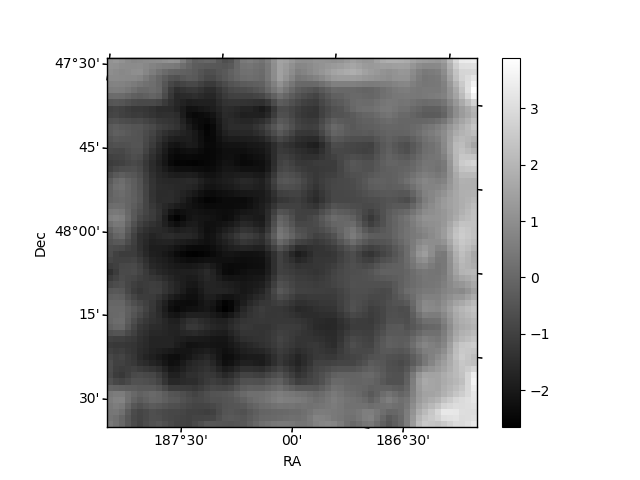
Histogram calculated using DETX and DETY for each event in the final _common_clean file
| Quadrant A | 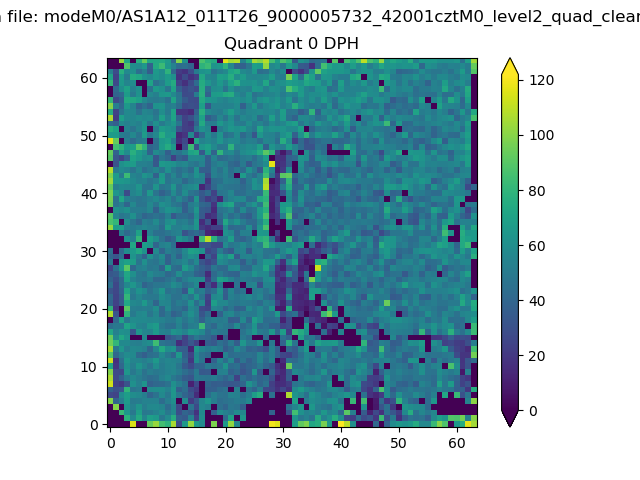 |
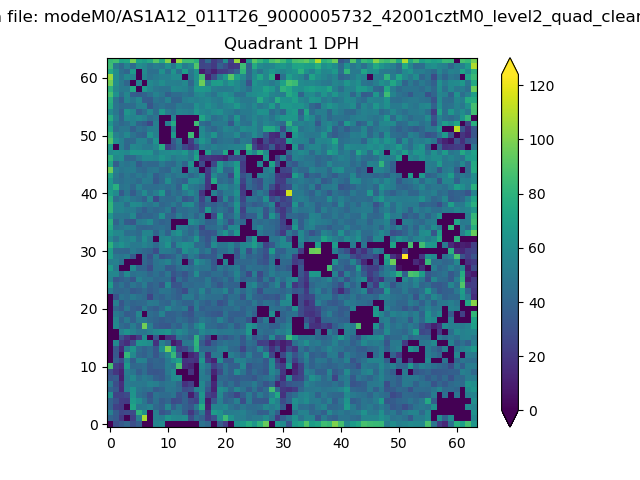 |
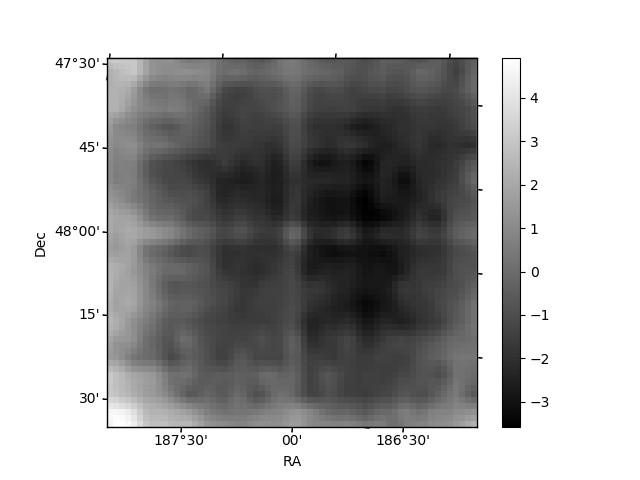
Quadrant B |
|---|---|---|---|
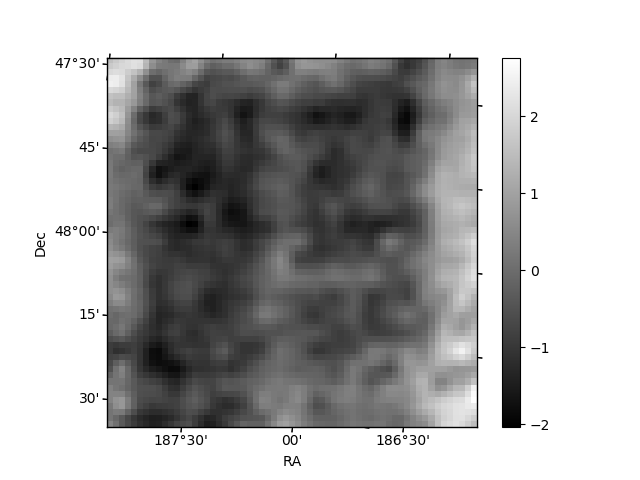
| Quadrant D | 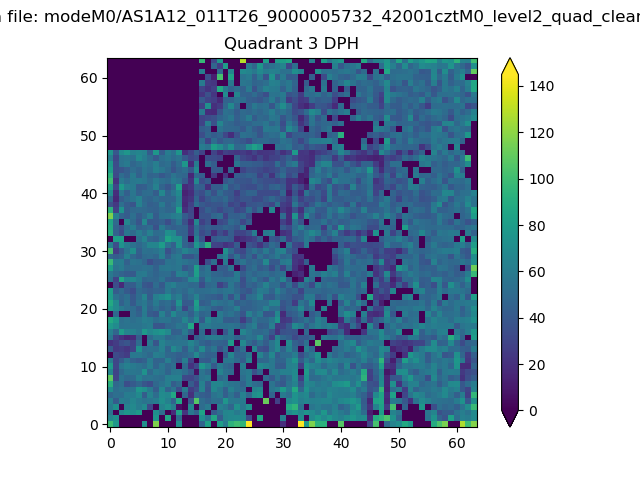 |
 |
Quadrant C |
| Plot type | Count rate plots | Images |
|---|---|---|
| Comparison with Poisson distribution Blue bars denote a histogram of data divided into 1 sec bins. Red curve is a Poisson curve with rate = median count rate of data. |
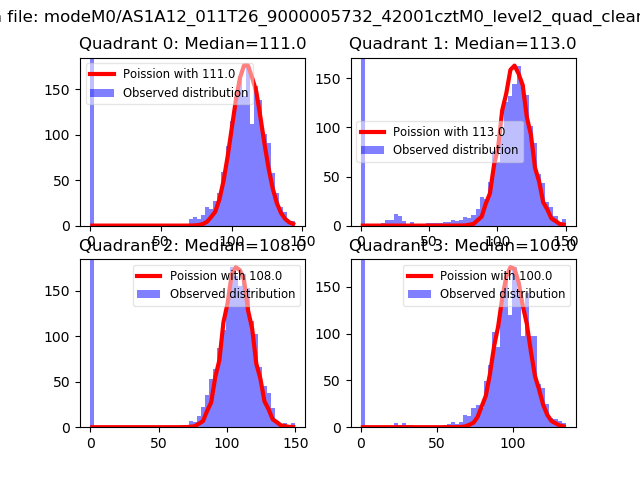 |
 |
| Quadrant-wise count rates Data is divided into 100 sec bins |
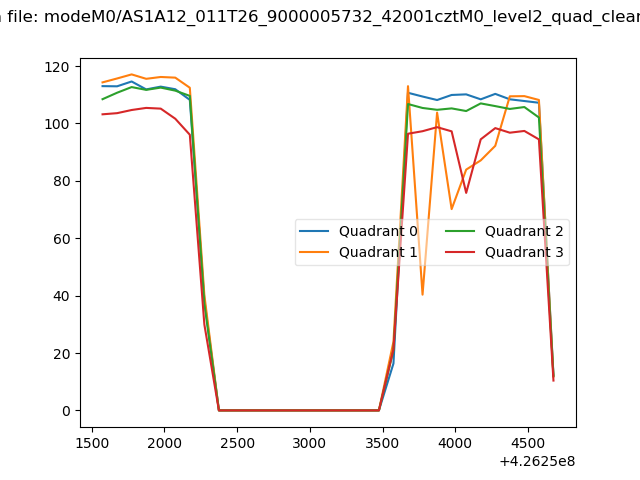 |
|
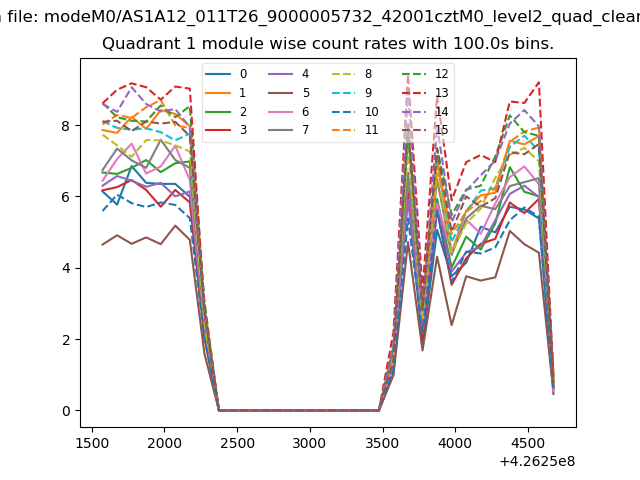
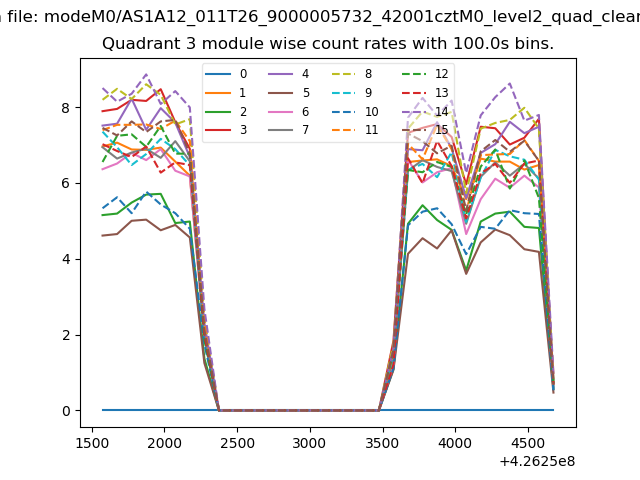
| Module-wise count rates for Quadrant A Data is divided into 100 sec bins |
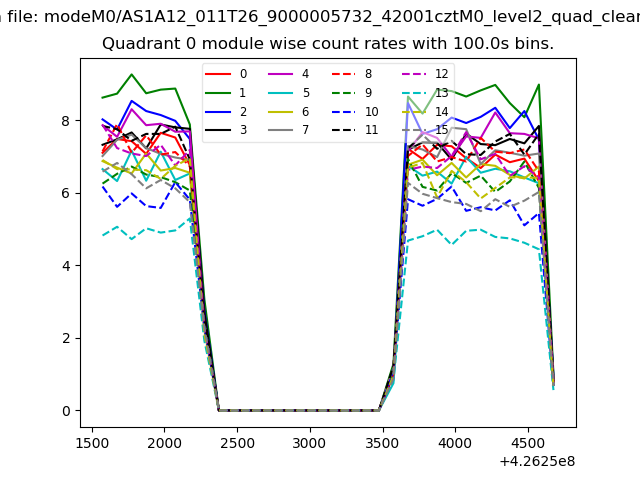 |
 |
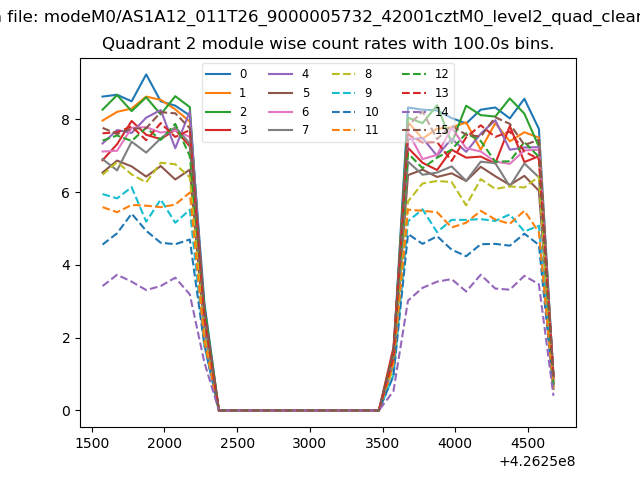
| Module-wise count rates for Quadrant B Data is divided into 100 sec bins |
 |
 |
| Module-wise count rates for Quadrant C Data is divided into 100 sec bins |
 |
 |
| Module-wise count rates for Quadrant D Data is divided into 100 sec bins |
 |
 |
| Parameter | Plot |
|---|---|
| CZT HV Monitor | 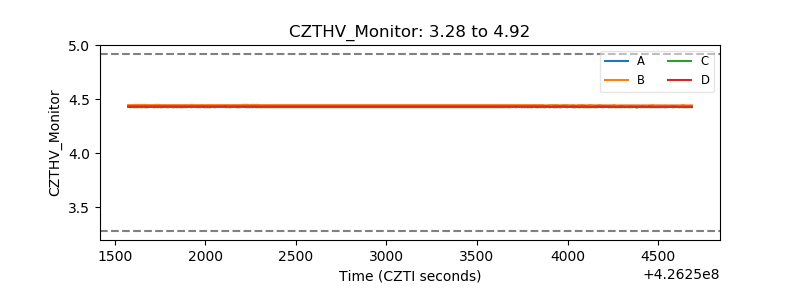 |
| D_VDD | 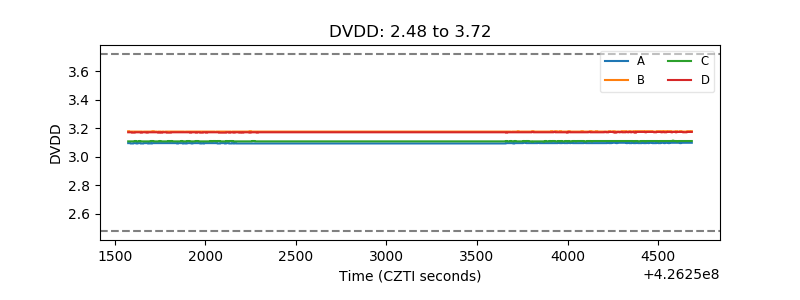 |
| Temperature 1 | 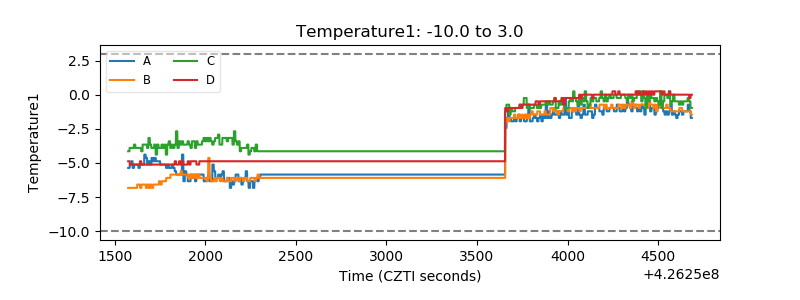 |
| Veto HV Monitor | 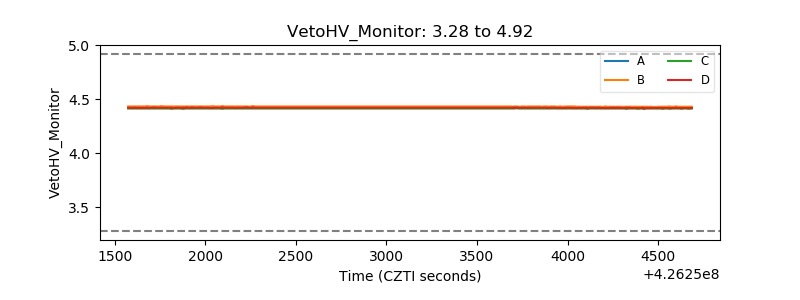 |
| Veto LLD | 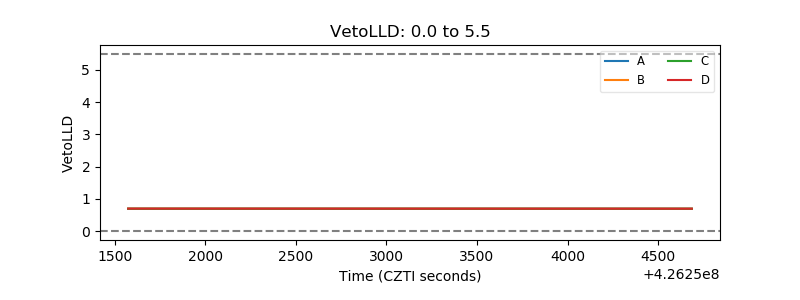 |
| Alpha Counter | 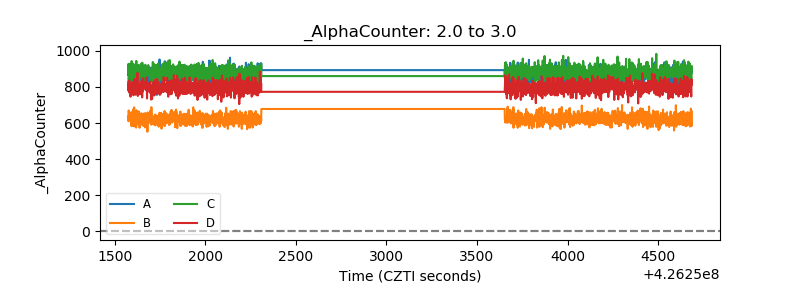 |
| _CPM_Rate | 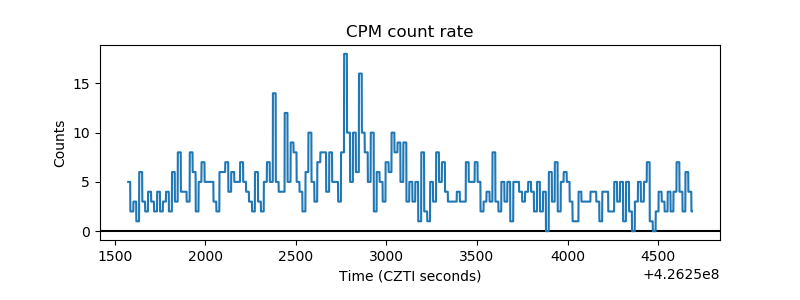 |
| CZT Counter | 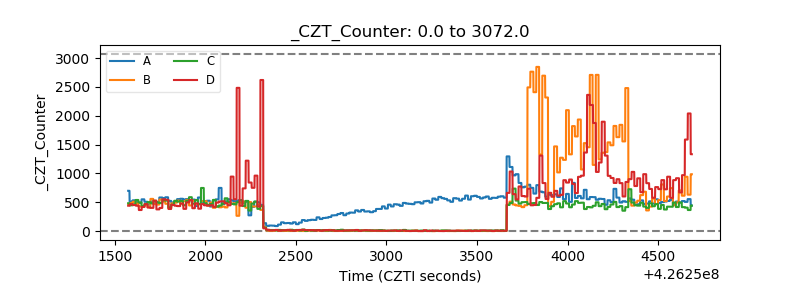 |
| +2.5 Volts monitor | 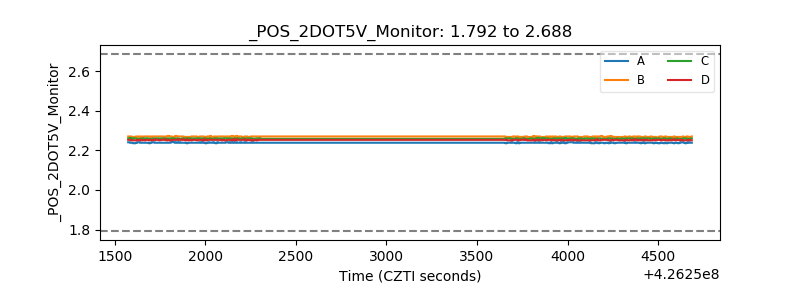 |
| +5 Volts monitor | 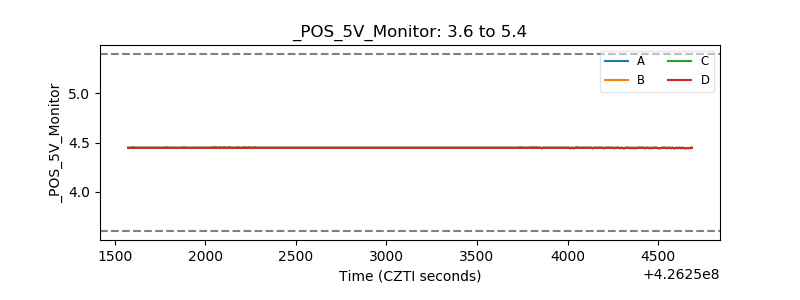 |
| _ROLL_ROT | 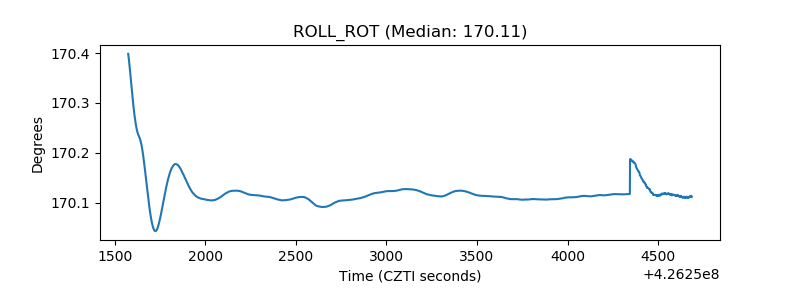 |
| _Roll_DEC | 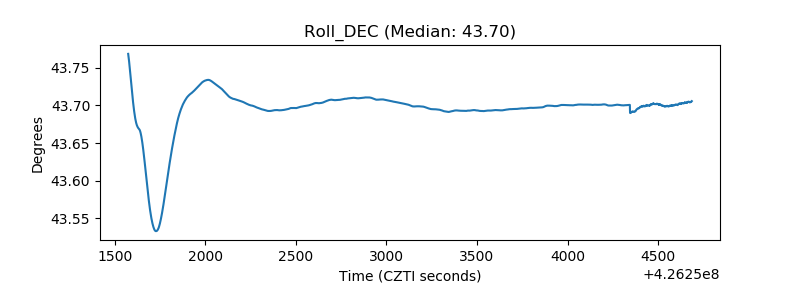 |
| _Roll_RA | 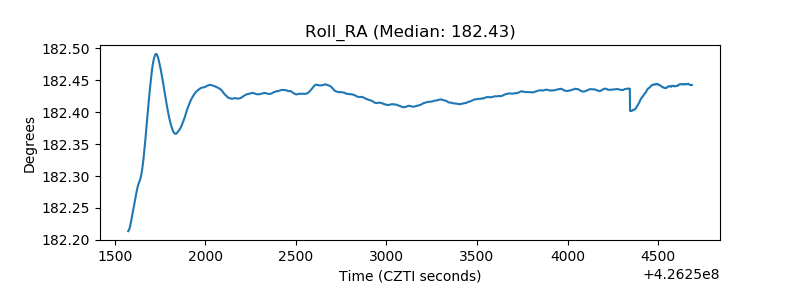 |
| Veto Counter | 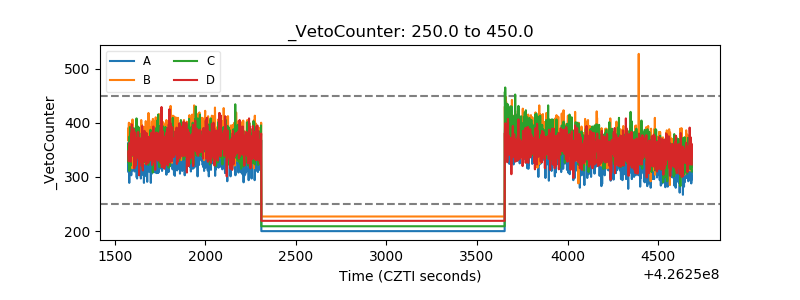 |