| Param | Original file | Final file |
|---|---|---|
| Filename | modeM0/AS1A12_011T26_9000005732_42002cztM0_level2.fits | modeM0/AS1A12_011T26_9000005732_42002cztM0_level2_quad_clean.evt |
| Size (bytes) | 396,875,520 | 94,141,440 |
| Size | 378.5 MB | 89.8 MB |
| Events in quadrant A | 3,241,357 | 638,735 |
| Events in quadrant B | 4,078,514 | 623,769 |
| Events in quadrant C | 2,719,875 | 624,500 |
| Events in quadrant D | 4,187,874 | 547,078 |
| Mode M0 | |||
|---|---|---|---|
| Quadrant | BADHDUFLAG | Total packets | Discarded packets |
| A | 0 | 13346 | 2 |
| B | 0 | 16273 | 2 |
| C | 0 | 12000 | 2 |
| D | 0 | 16599 | 2 |
| Mode M9 | |||
|---|---|---|---|
| Quadrant | BADHDUFLAG | Total packets | Discarded packets |
| A | 0 | 16 | 0 |
| B | 0 | 17 | 0 |
| C | 0 | 17 | 0 |
| D | 0 | 17 | 0 |
| Mode SS | |||
|---|---|---|---|
| Quadrant | BADHDUFLAG | Total packets | Discarded packets |
| A | 0 | 122 | 0 |
| B | 0 | 122 | 0 |
| C | 0 | 122 | 0 |
| D | 0 | 122 | 0 |
| Quadrant | Total seconds | Saturated seconds | Saturation percentage |
|---|---|---|---|
| A | 5954 | 23 | 0.386295% |
| B | 5954 | 323 | 5.424924% |
| C | 5954 | 3 | 0.050386% |
| D | 5954 | 368 | 6.180719% |
Noise dominated data is calculated using 1-second bins in cleaned event files. If a bin has >2000 counts, and if more than 50% of those come from <1% of pixels, then it is considered to be noise-dominated and hence unusable.
| Quadrant | # 1 sec bins | Bins with >0 counts | Bins with >2000 counts | High rate bins dominated by noise | Noise dominated (total time) | Noise dominated (detector-on time) | Marked lightcurve |
|---|---|---|---|---|---|---|---|
| A | 7266 | 5955 | 7 | 7 | 0.10% | 0.12% | 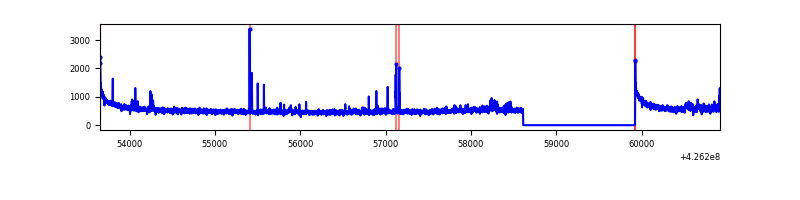 |
| B | 7266 | 5955 | 222 | 222 | 3.06% | 3.73% | 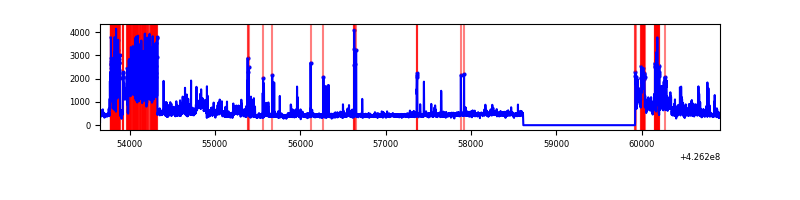 |
| C | 7266 | 5955 | 0 | 0 | 0.00% | 0.00% | 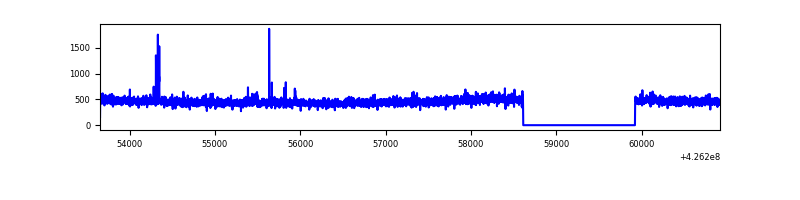 |
| D | 7266 | 5955 | 340 | 340 | 4.68% | 5.71% | 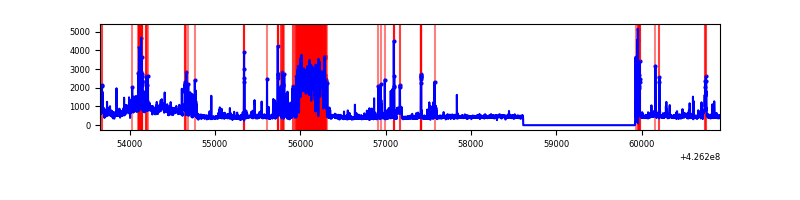 |
Top three noisy pixels from each quadrant. If the there are fewer than three noisy pixels in the level2.evt file, extra rows are filled as -1
| Pixel properties | Quadrant properties | ||||||
|---|---|---|---|---|---|---|---|
| Quadrant | DetID | PixID | Counts | Sigma | Mean | Median | Sigma |
| A | 10 | 83 | 650841 | 4961.65 | 635 | 619 | 131.0 |
| A | 15 | 223 | 49193 | 370.65 | 635 | 619 | 131.0 |
| A | 2 | 79 | 42685 | 320.99 | 635 | 619 | 131.0 |
| B | 0 | 186 | 1267158 | 10595.06 | 620 | 604 | 119.5 |
| B | 0 | 190 | 212548 | 1772.97 | 620 | 604 | 119.5 |
| B | 5 | 255 | 101268 | 842.08 | 620 | 604 | 119.5 |
| C | 15 | 214 | 249465 | 1697.61 | 622 | 624 | 146.6 |
| C | 15 | 111 | 17549 | 115.46 | 622 | 624 | 146.6 |
| C | 8 | 229 | 9461 | 60.29 | 622 | 624 | 146.6 |
| D | 12 | 2 | 506731 | 3324.83 | 611 | 593 | 152.2 |
| D | 1 | 52 | 446339 | 2928.12 | 611 | 593 | 152.2 |
| D | 13 | 249 | 224091 | 1468.16 | 611 | 593 | 152.2 |
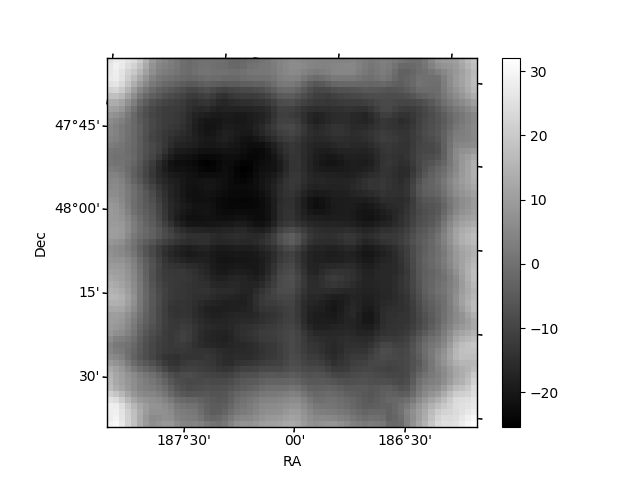
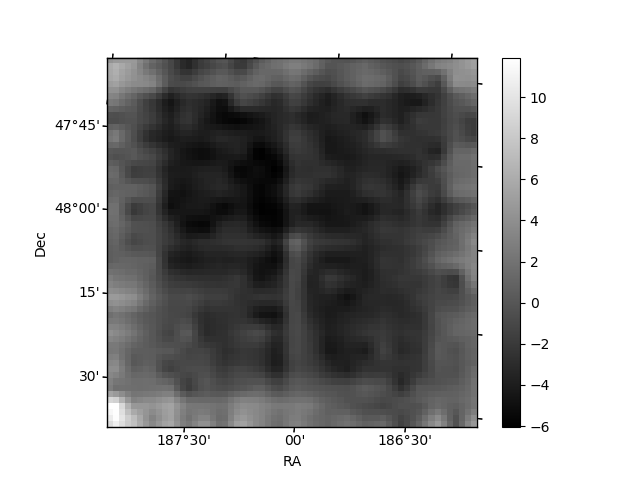
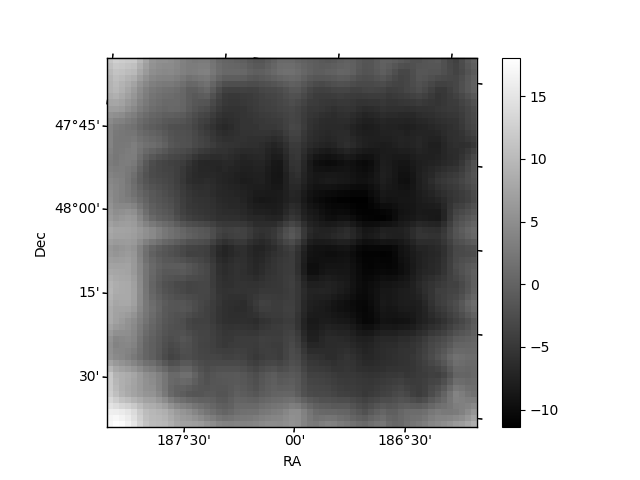
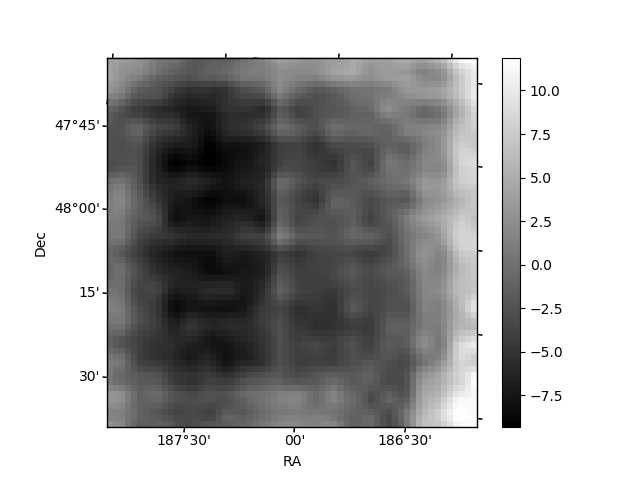
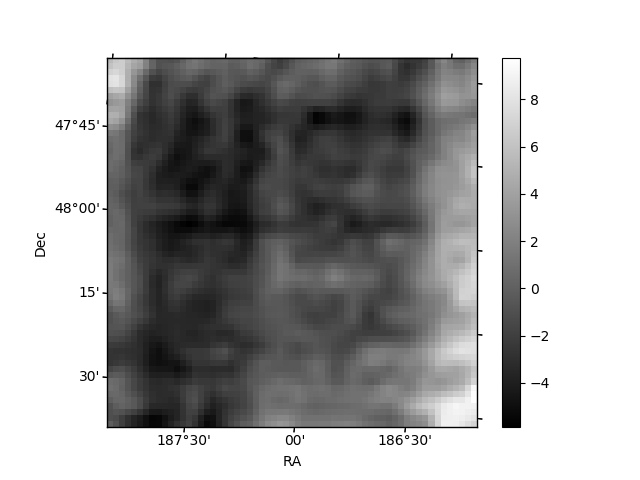
Histogram calculated using DETX and DETY for each event in the final _common_clean file
| Quadrant A | 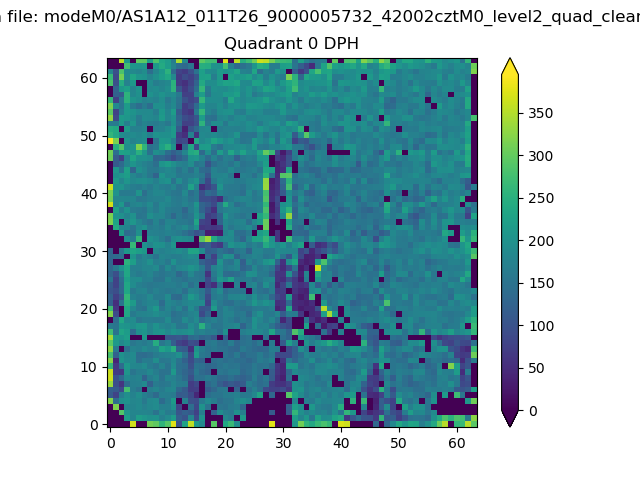 |
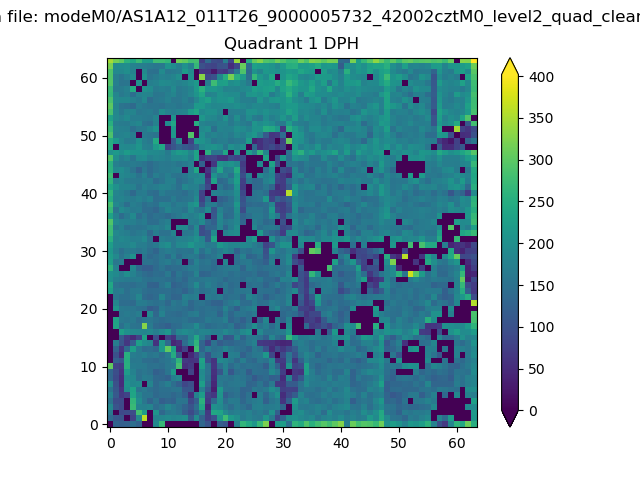 |
Quadrant B |
|---|---|---|---|
| Quadrant D | 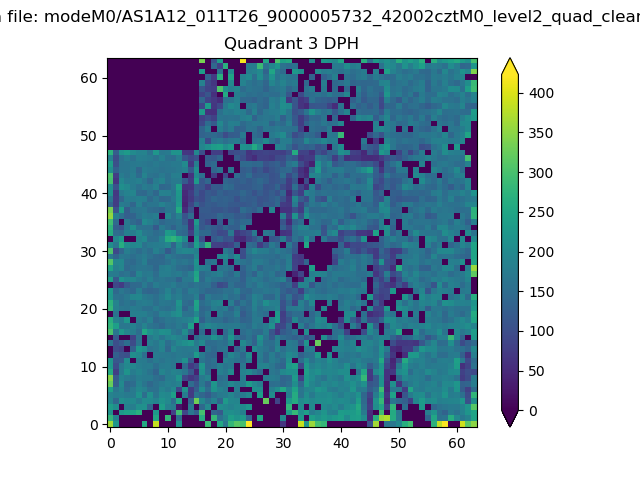 |
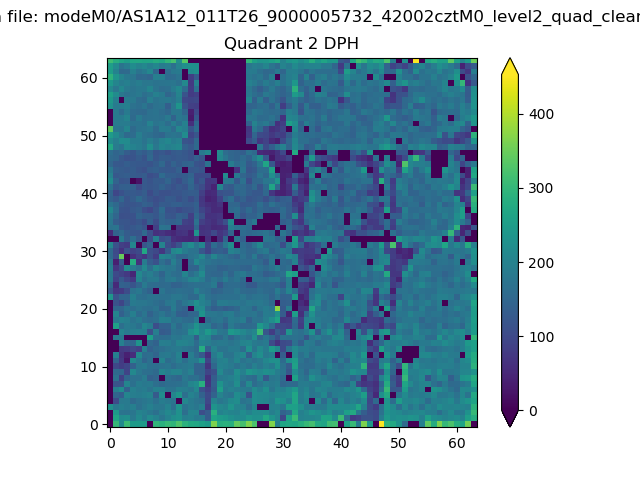 |
Quadrant C |
| Plot type | Count rate plots | Images |
|---|---|---|
| Comparison with Poisson distribution Blue bars denote a histogram of data divided into 1 sec bins. Red curve is a Poisson curve with rate = median count rate of data. |
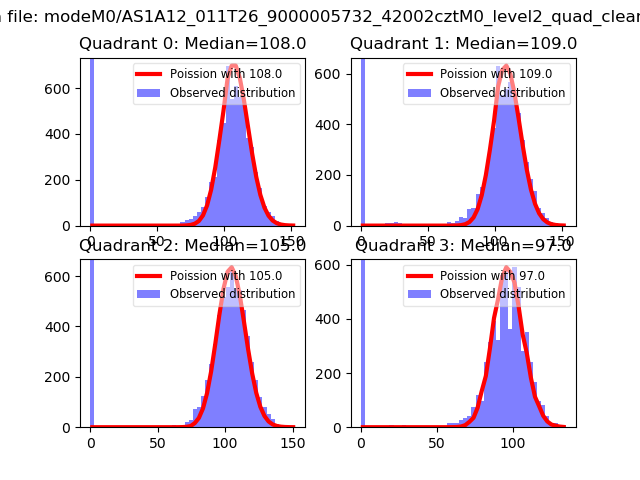 |
 |
| Quadrant-wise count rates Data is divided into 100 sec bins |
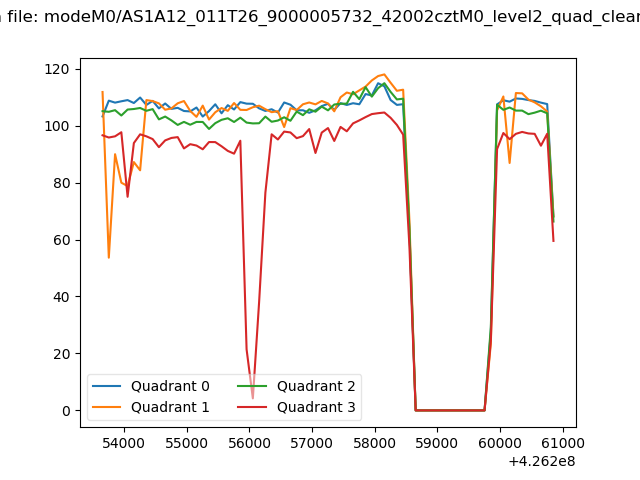 |
|
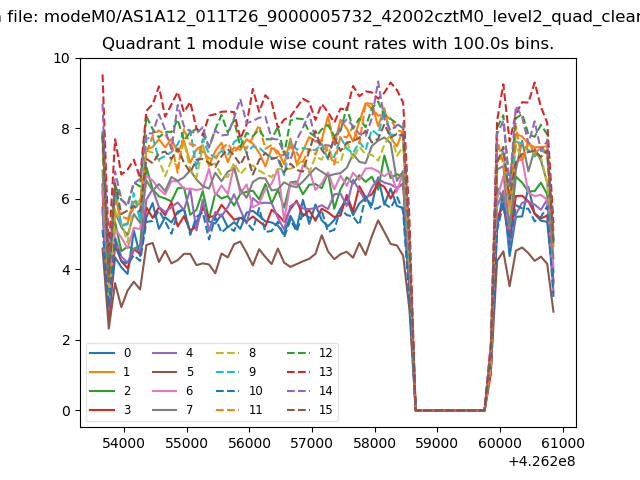
| Module-wise count rates for Quadrant A Data is divided into 100 sec bins |
 |
 |
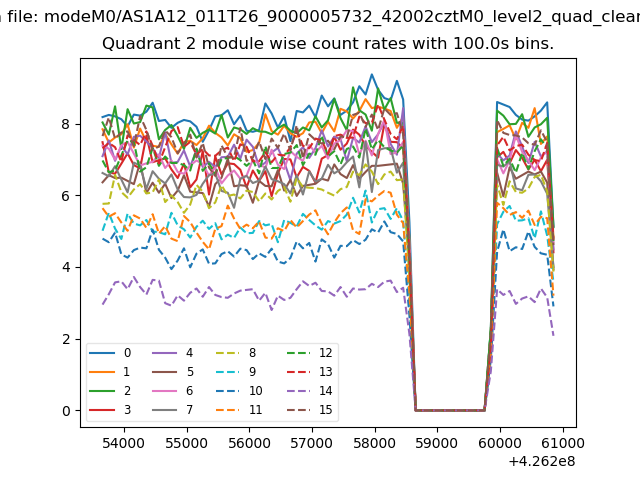
| Module-wise count rates for Quadrant B Data is divided into 100 sec bins |
 |
 |
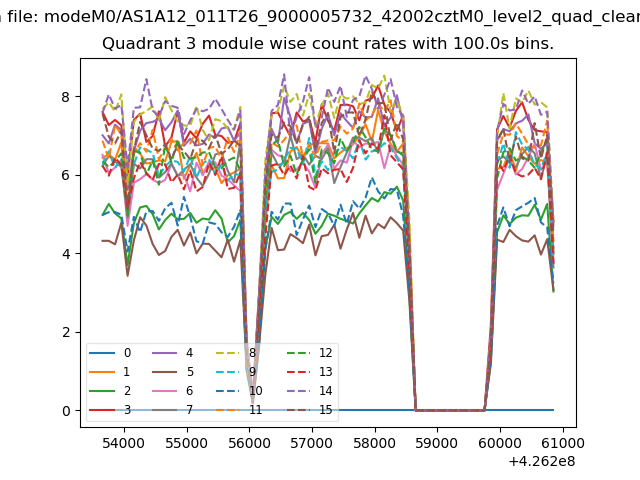
| Module-wise count rates for Quadrant C Data is divided into 100 sec bins |
 |
 |
| Module-wise count rates for Quadrant D Data is divided into 100 sec bins |
 |
 |
| Parameter | Plot |
|---|---|
| CZT HV Monitor | 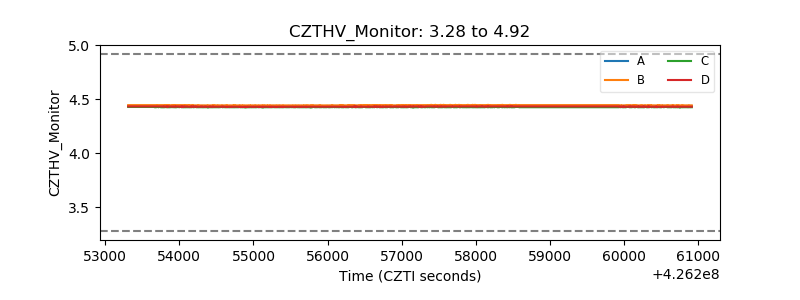 |
| D_VDD | 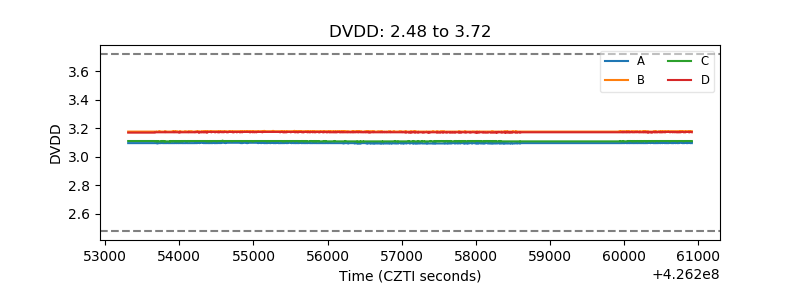 |
| Temperature 1 | 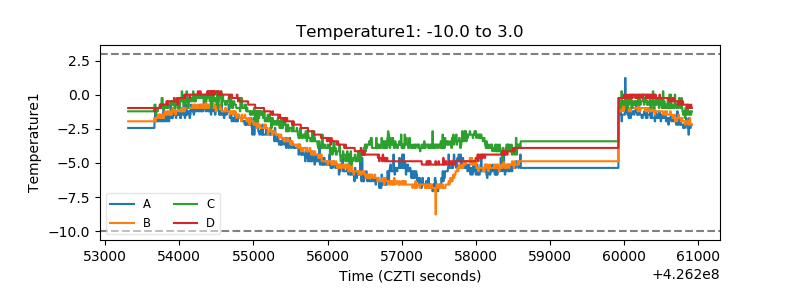 |
| Veto HV Monitor | 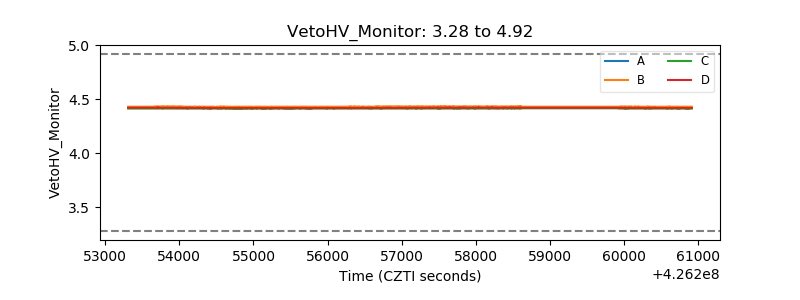 |
| Veto LLD | 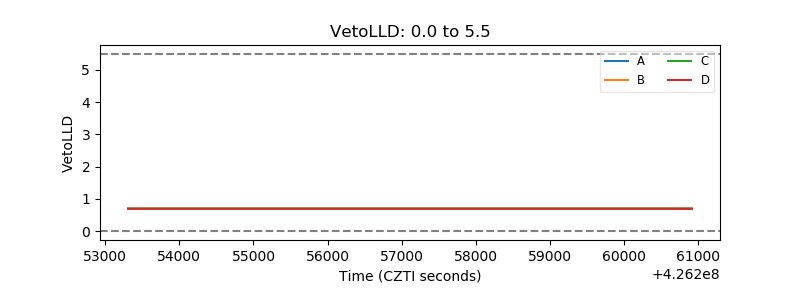 |
| Alpha Counter | 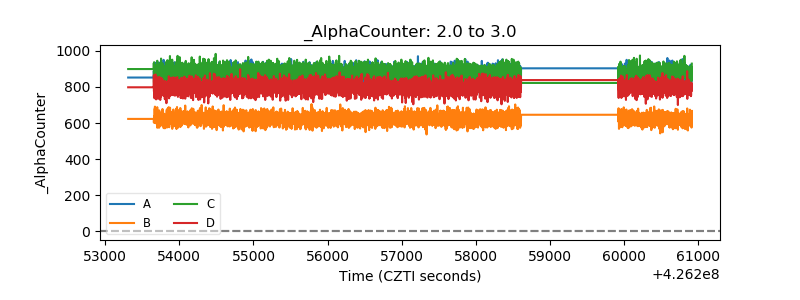 |
| _CPM_Rate | 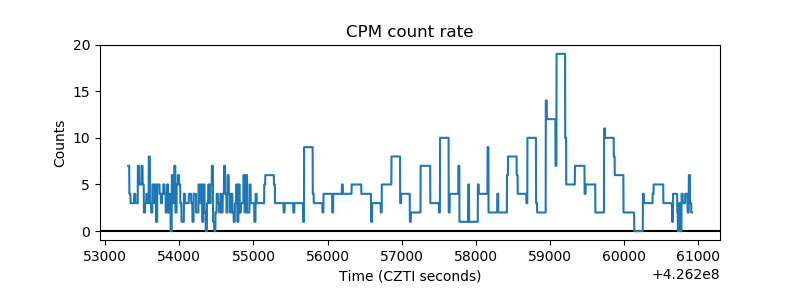 |
| CZT Counter | 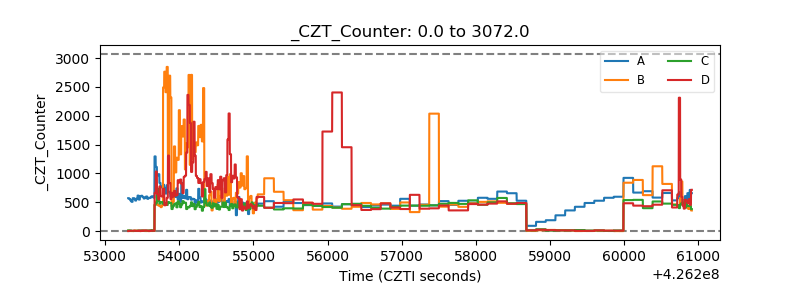 |
| +2.5 Volts monitor | 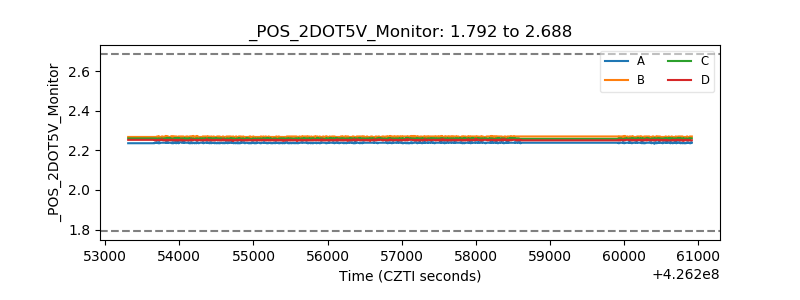 |
| +5 Volts monitor | 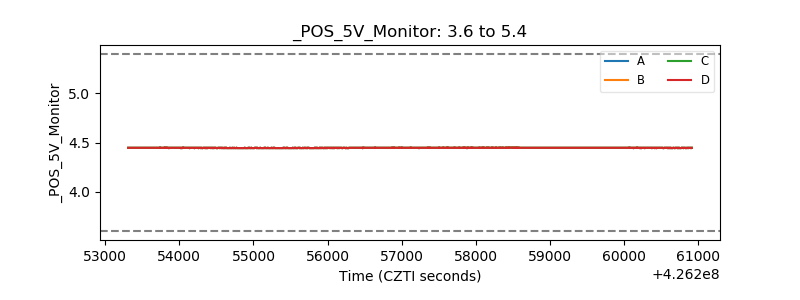 |
| _ROLL_ROT | 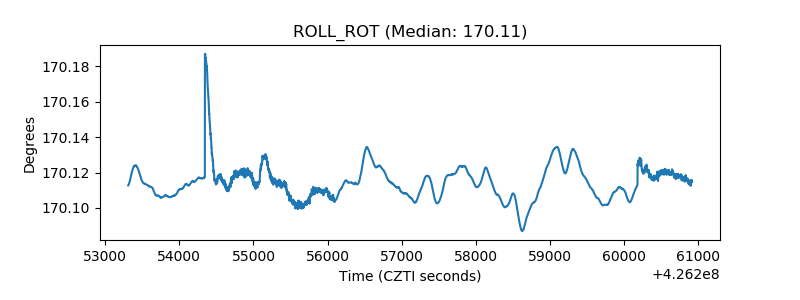 |
| _Roll_DEC | 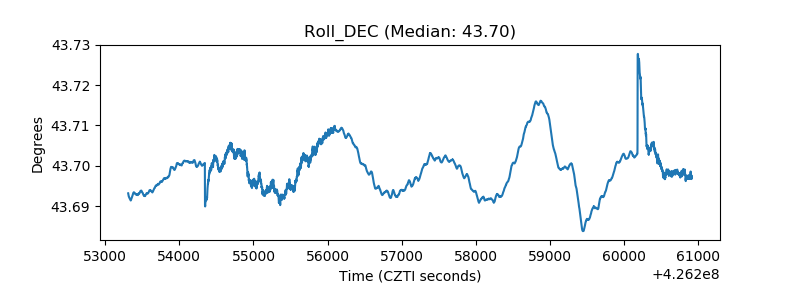 |
| _Roll_RA | 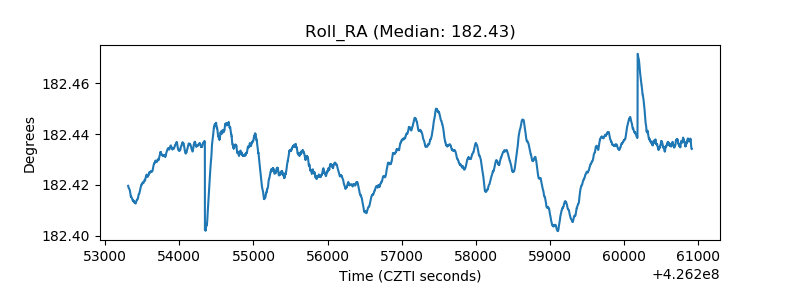 |
| Veto Counter | 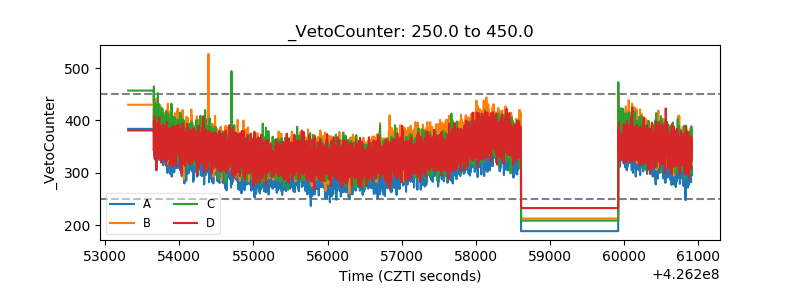 |