| Param | Original file | Final file |
|---|---|---|
| Filename | modeM0/AS1A12_011T26_9000005732_42004cztM0_level2.fits | modeM0/AS1A12_011T26_9000005732_42004cztM0_level2_quad_clean.evt |
| Size (bytes) | 717,857,280 | 167,561,280 |
| Size | 684.6 MB | 159.8 MB |
| Events in quadrant A | 6,104,778 | 1,123,401 |
| Events in quadrant B | 5,644,194 | 1,128,378 |
| Events in quadrant C | 4,885,195 | 1,109,046 |
| Events in quadrant D | 9,110,082 | 972,005 |
| Mode M0 | |||
|---|---|---|---|
| Quadrant | BADHDUFLAG | Total packets | Discarded packets |
| A | 0 | 25124 | 3 |
| B | 0 | 24545 | 3 |
| C | 0 | 21602 | 3 |
| D | 0 | 34432 | 3 |
| Mode M9 | |||
|---|---|---|---|
| Quadrant | BADHDUFLAG | Total packets | Discarded packets |
| A | 0 | 28 | 0 |
| B | 0 | 28 | 0 |
| C | 0 | 28 | 0 |
| D | 0 | 28 | 0 |
| Mode SS | |||
|---|---|---|---|
| Quadrant | BADHDUFLAG | Total packets | Discarded packets |
| A | 0 | 218 | 0 |
| B | 0 | 218 | 0 |
| C | 0 | 218 | 0 |
| D | 0 | 218 | 0 |
| Quadrant | Total seconds | Saturated seconds | Saturation percentage |
|---|---|---|---|
| A | 10688 | 33 | 0.308757% |
| B | 10688 | 260 | 2.432635% |
| C | 10689 | 2 | 0.018711% |
| D | 10689 | 756 | 7.072692% |
Noise dominated data is calculated using 1-second bins in cleaned event files. If a bin has >2000 counts, and if more than 50% of those come from <1% of pixels, then it is considered to be noise-dominated and hence unusable.
| Quadrant | # 1 sec bins | Bins with >0 counts | Bins with >2000 counts | High rate bins dominated by noise | Noise dominated (total time) | Noise dominated (detector-on time) | Marked lightcurve |
|---|---|---|---|---|---|---|---|
| A | 13465 | 10690 | 9 | 9 | 0.07% | 0.08% | 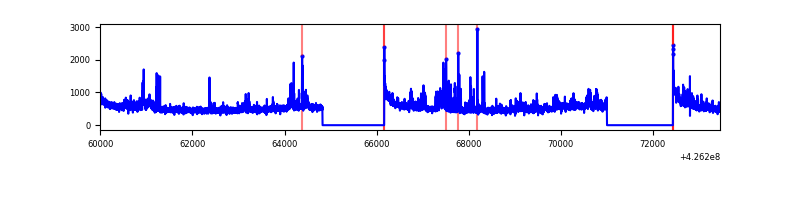 |
| B | 13465 | 10690 | 220 | 220 | 1.63% | 2.06% | 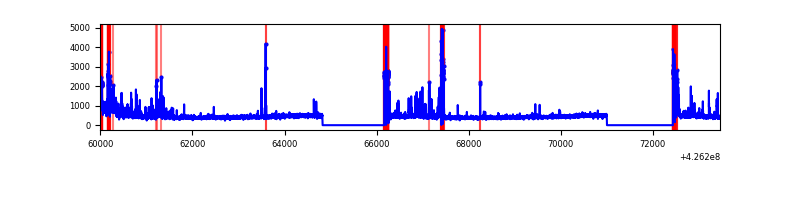 |
| C | 13466 | 10691 | 0 | 0 | 0.00% | 0.00% | 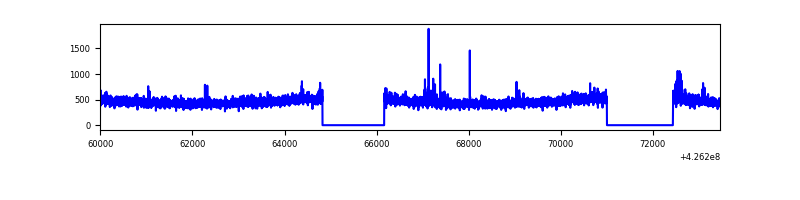 |
| D | 13466 | 10691 | 662 | 662 | 4.92% | 6.19% | 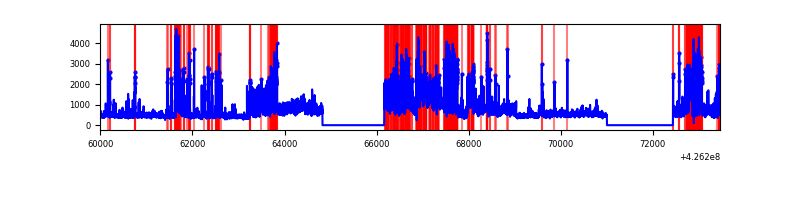 |
Top three noisy pixels from each quadrant. If the there are fewer than three noisy pixels in the level2.evt file, extra rows are filled as -1
| Pixel properties | Quadrant properties | ||||||
|---|---|---|---|---|---|---|---|
| Quadrant | DetID | PixID | Counts | Sigma | Mean | Median | Sigma |
| A | 10 | 83 | 1049533 | 4497.05 | 1138 | 1115 | 233.1 |
| A | 2 | 79 | 302421 | 1292.41 | 1138 | 1115 | 233.1 |
| A | 12 | 189 | 176168 | 750.87 | 1138 | 1115 | 233.1 |
| B | 0 | 186 | 775560 | 3627.4 | 1115 | 1086 | 213.5 |
| B | 0 | 190 | 332298 | 1551.3 | 1115 | 1086 | 213.5 |
| B | 5 | 255 | 68001 | 313.41 | 1115 | 1086 | 213.5 |
| C | 15 | 214 | 436647 | 1676.96 | 1114 | 1123 | 259.7 |
| C | 8 | 79 | 25697 | 94.62 | 1114 | 1123 | 259.7 |
| C | 12 | 249 | 22802 | 83.47 | 1114 | 1123 | 259.7 |
| D | 13 | 249 | 2054467 | 7742.68 | 1085 | 1056 | 265.2 |
| D | 1 | 52 | 1991475 | 7505.15 | 1085 | 1056 | 265.2 |
| D | 10 | 199 | 398977 | 1500.42 | 1085 | 1056 | 265.2 |
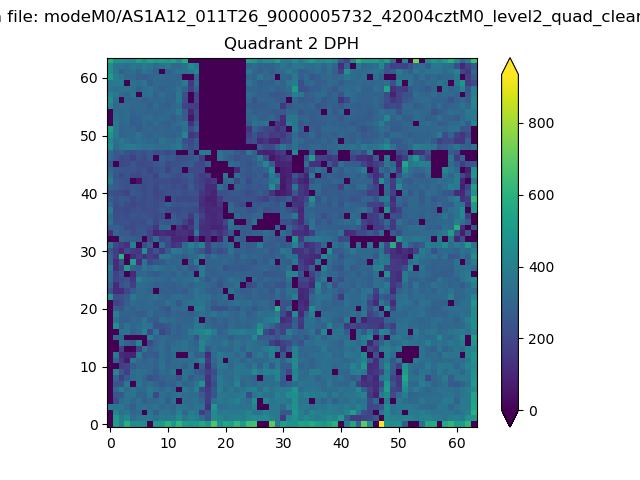
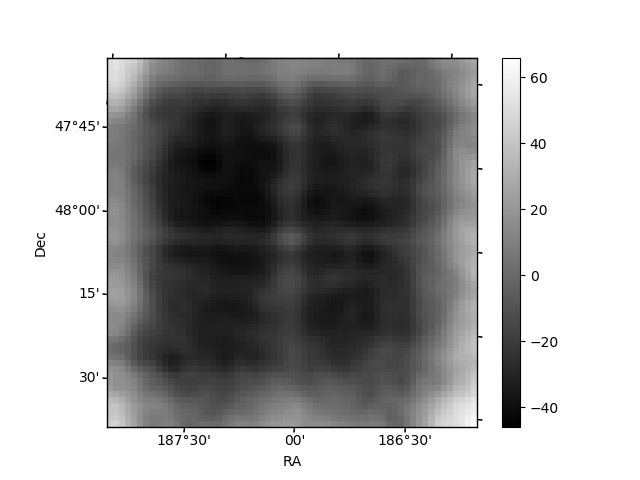
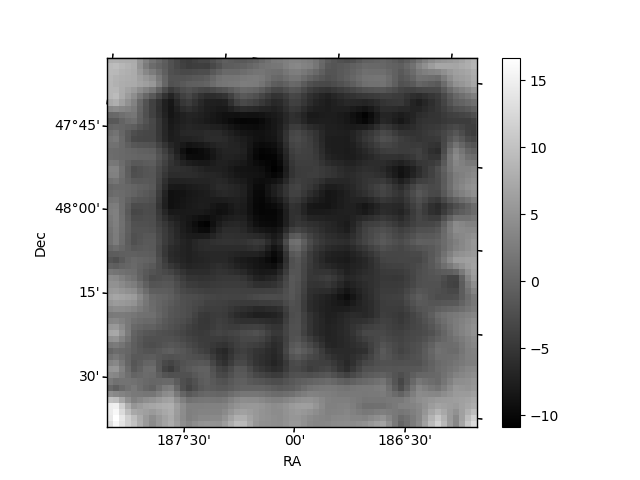
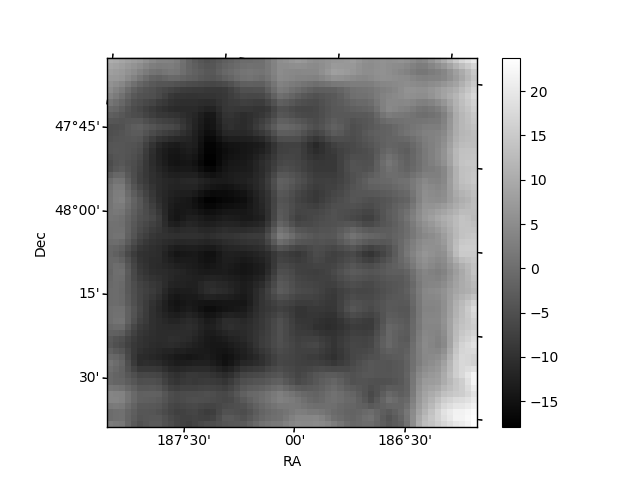
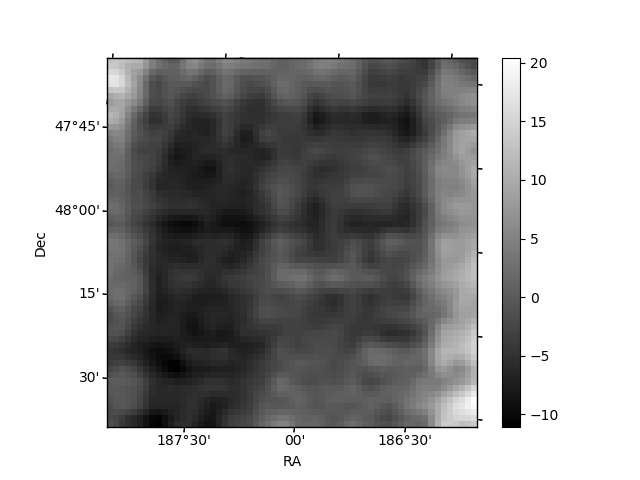
Histogram calculated using DETX and DETY for each event in the final _common_clean file
| Quadrant A | 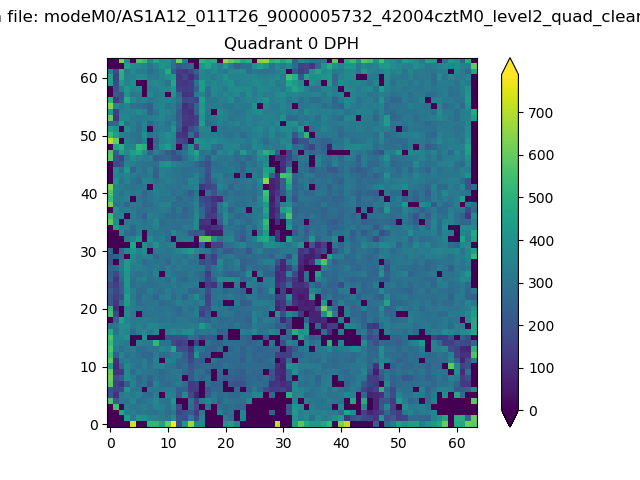 |
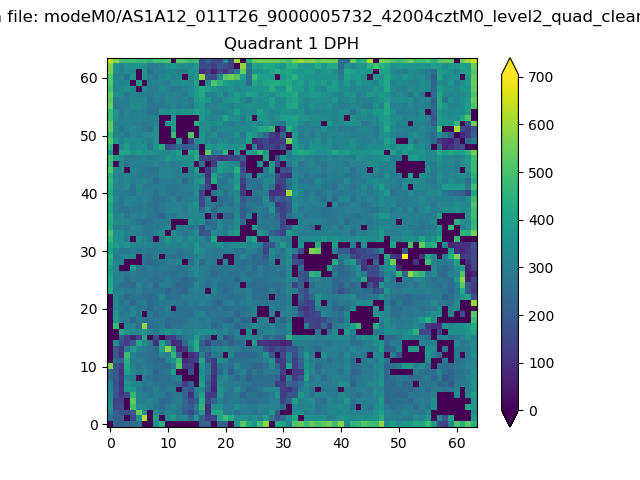 |
Quadrant B |
|---|---|---|---|
| Quadrant D | 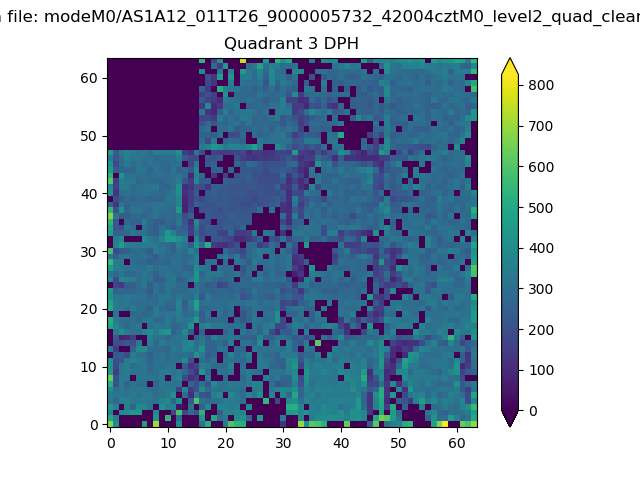 |
 |
Quadrant C |
| Plot type | Count rate plots | Images |
|---|---|---|
| Comparison with Poisson distribution Blue bars denote a histogram of data divided into 1 sec bins. Red curve is a Poisson curve with rate = median count rate of data. |
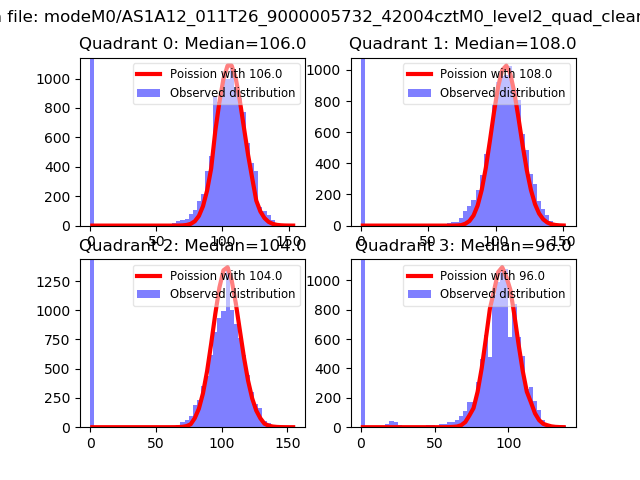 |
 |
| Quadrant-wise count rates Data is divided into 100 sec bins |
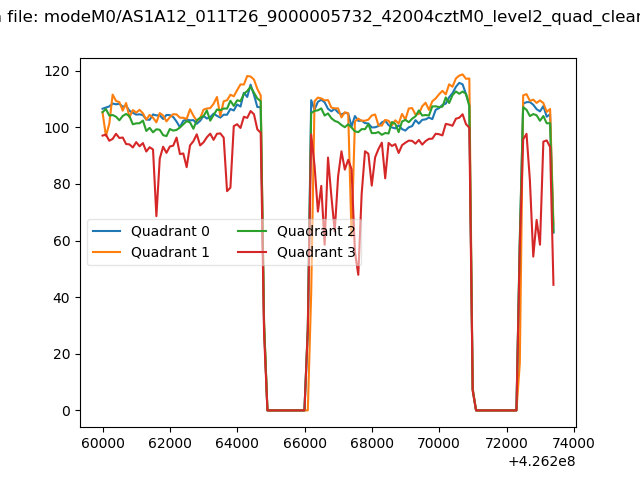 |
|
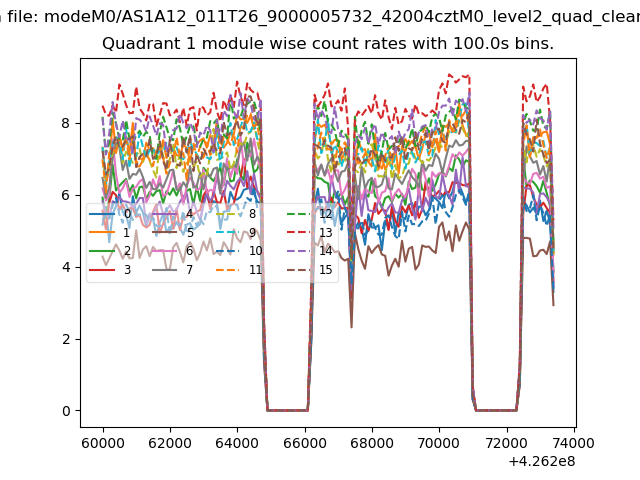
| Module-wise count rates for Quadrant A Data is divided into 100 sec bins |
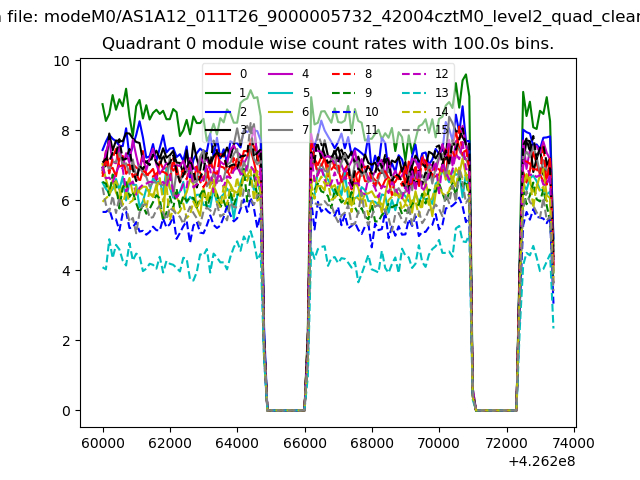 |
 |
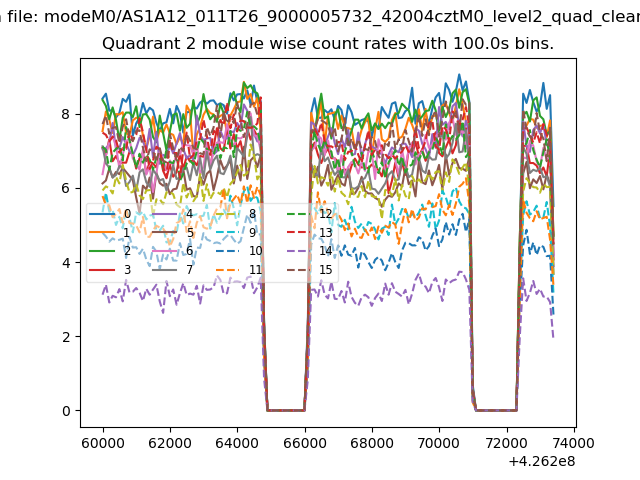
| Module-wise count rates for Quadrant B Data is divided into 100 sec bins |
 |
 |
| Module-wise count rates for Quadrant C Data is divided into 100 sec bins |
 |
 |
| Module-wise count rates for Quadrant D Data is divided into 100 sec bins |
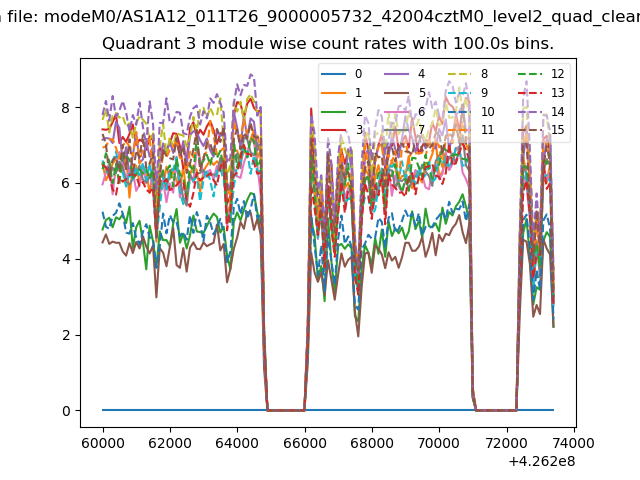 |
 |
| Parameter | Plot |
|---|---|
| CZT HV Monitor | 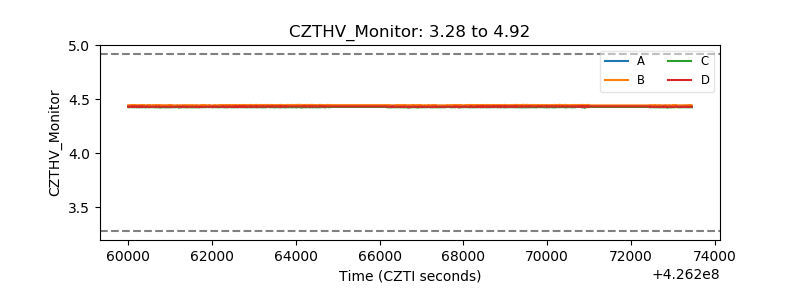 |
| D_VDD | 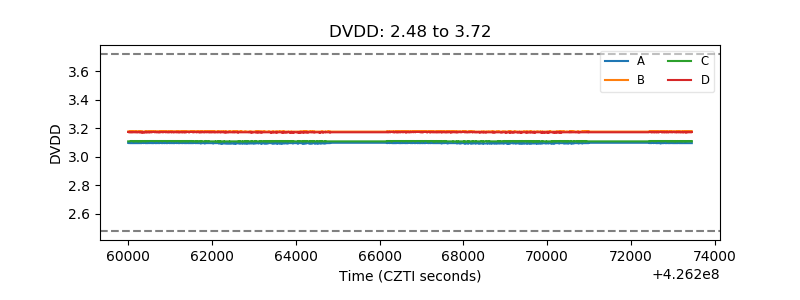 |
| Temperature 1 | 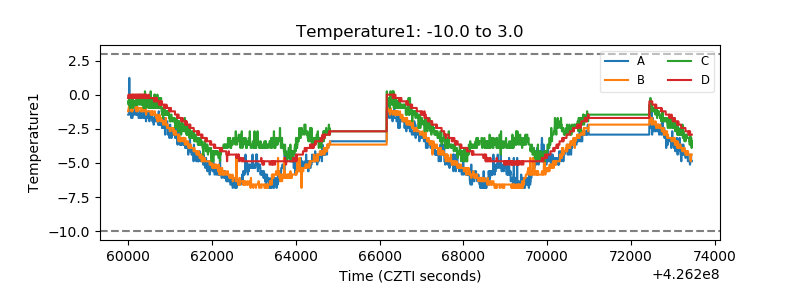 |
| Veto HV Monitor | 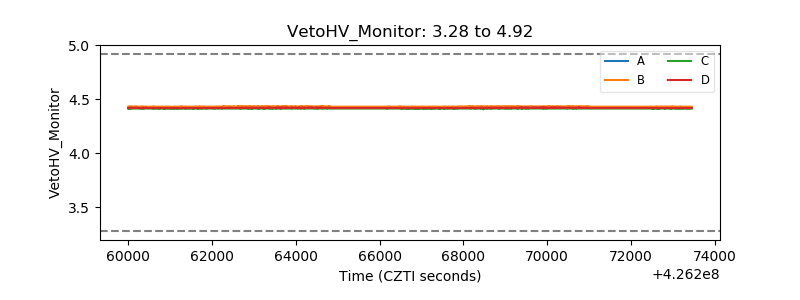 |
| Veto LLD | 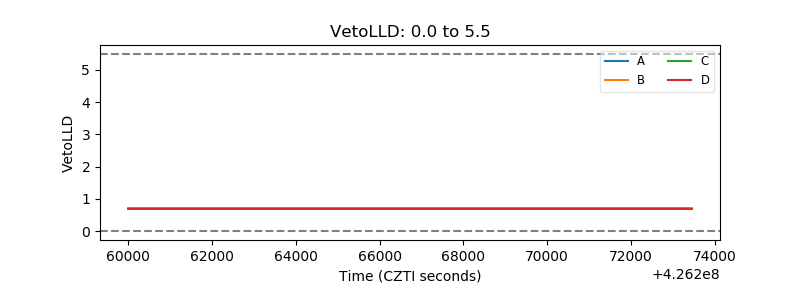 |
| Alpha Counter | 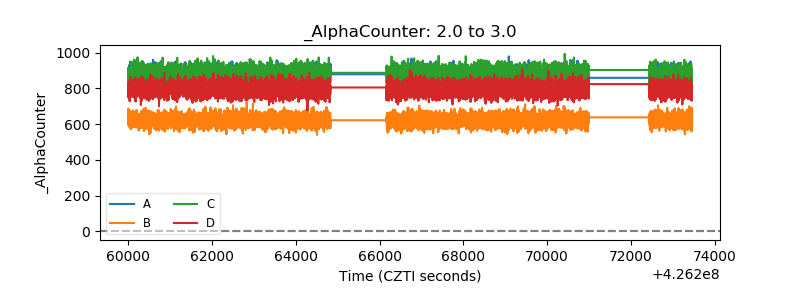 |
| _CPM_Rate | 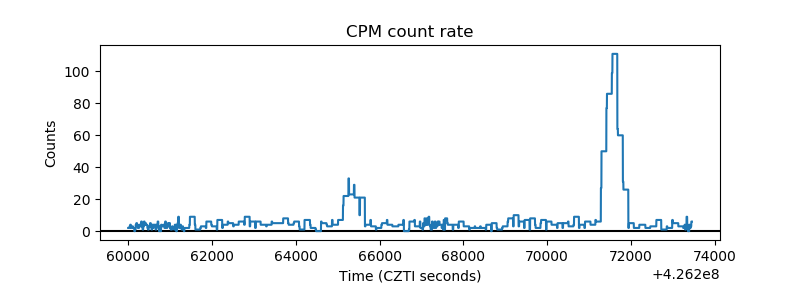 |
| CZT Counter | 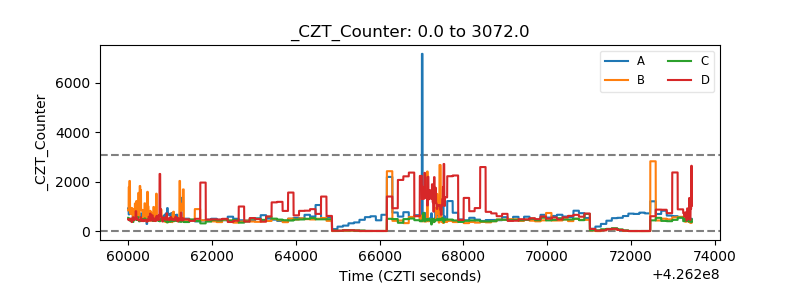 |
| +2.5 Volts monitor | 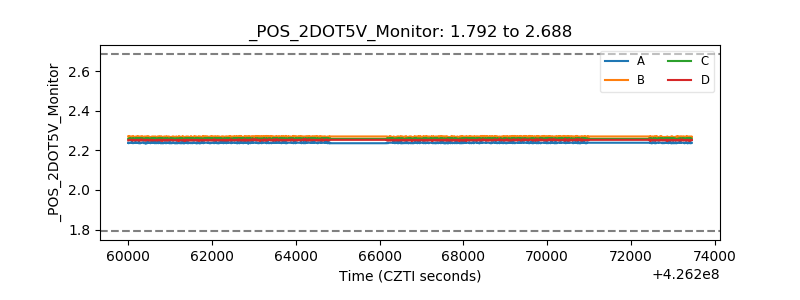 |
| +5 Volts monitor | 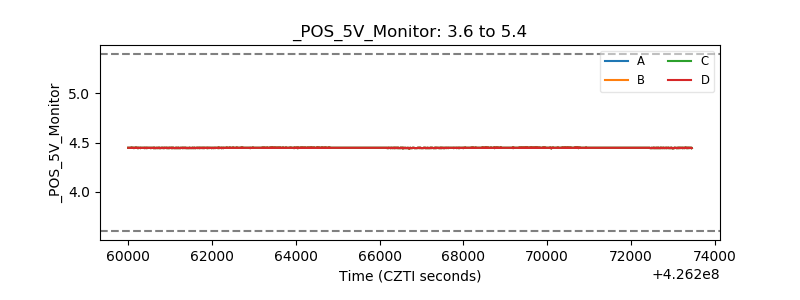 |
| _ROLL_ROT | 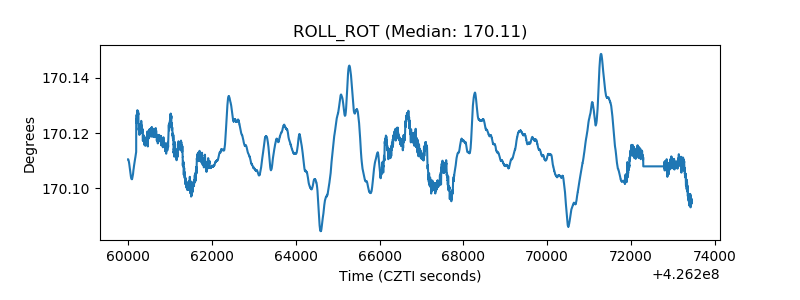 |
| _Roll_DEC | 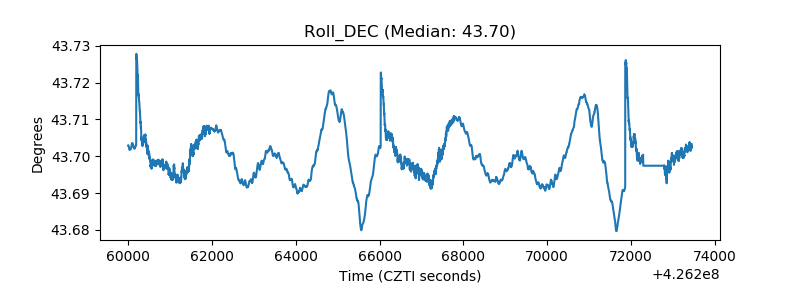 |
| _Roll_RA | 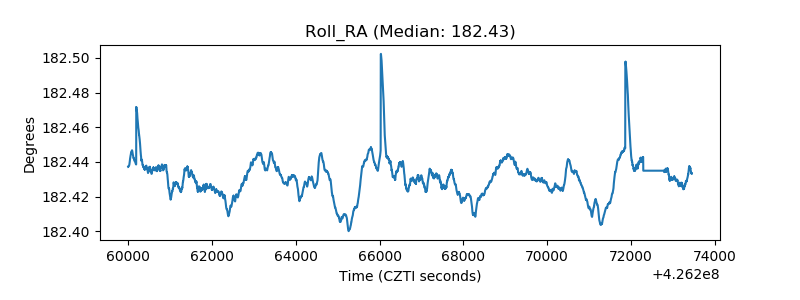 |
| Veto Counter | 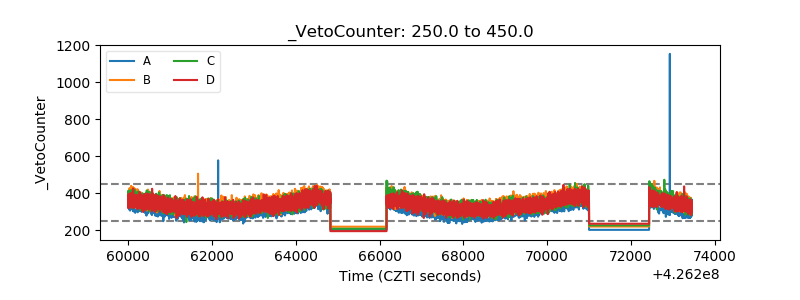 |