| Param | Original file | Final file |
|---|---|---|
| Filename | modeM0/AS1A12_011T26_9000005732_42005cztM0_level2.fits | modeM0/AS1A12_011T26_9000005732_42005cztM0_level2_quad_clean.evt |
| Size (bytes) | 356,702,400 | 90,601,920 |
| Size | 340.2 MB | 86.4 MB |
| Events in quadrant A | 3,148,640 | 607,007 |
| Events in quadrant B | 2,935,260 | 605,541 |
| Events in quadrant C | 2,625,698 | 597,852 |
| Events in quadrant D | 4,048,096 | 531,592 |
| Mode M0 | |||
|---|---|---|---|
| Quadrant | BADHDUFLAG | Total packets | Discarded packets |
| A | 0 | 12991 | 3 |
| B | 0 | 12920 | 2 |
| C | 0 | 11601 | 2 |
| D | 0 | 16130 | 2 |
| Mode M9 | |||
|---|---|---|---|
| Quadrant | BADHDUFLAG | Total packets | Discarded packets |
| A | 0 | 20 | 0 |
| B | 0 | 20 | 0 |
| C | 0 | 20 | 0 |
| D | 0 | 21 | 0 |
| Mode SS | |||
|---|---|---|---|
| Quadrant | BADHDUFLAG | Total packets | Discarded packets |
| A | 0 | 118 | 0 |
| B | 0 | 118 | 0 |
| C | 0 | 118 | 0 |
| D | 0 | 118 | 0 |
| Quadrant | Total seconds | Saturated seconds | Saturation percentage |
|---|---|---|---|
| A | 5731 | 23 | 0.401326% |
| B | 5731 | 168 | 2.931426% |
| C | 5731 | 3 | 0.052347% |
| D | 5731 | 291 | 5.077648% |
Noise dominated data is calculated using 1-second bins in cleaned event files. If a bin has >2000 counts, and if more than 50% of those come from <1% of pixels, then it is considered to be noise-dominated and hence unusable.
| Quadrant | # 1 sec bins | Bins with >0 counts | Bins with >2000 counts | High rate bins dominated by noise | Noise dominated (total time) | Noise dominated (detector-on time) | Marked lightcurve |
|---|---|---|---|---|---|---|---|
| A | 7285 | 5732 | 7 | 7 | 0.10% | 0.12% | 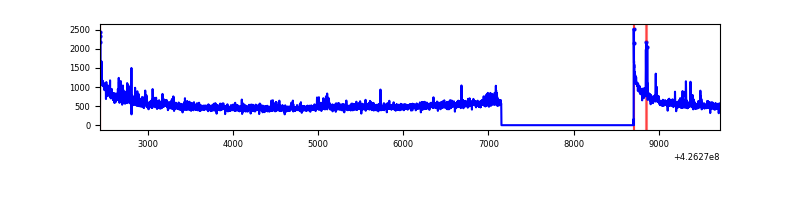 |
| B | 7285 | 5731 | 149 | 149 | 2.05% | 2.60% | 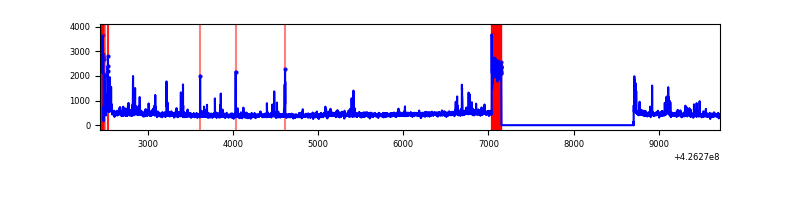 |
| C | 7285 | 5731 | 0 | 0 | 0.00% | 0.00% | 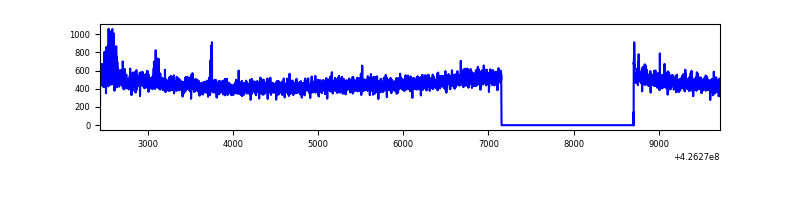 |
| D | 7285 | 5732 | 230 | 230 | 3.16% | 4.01% | 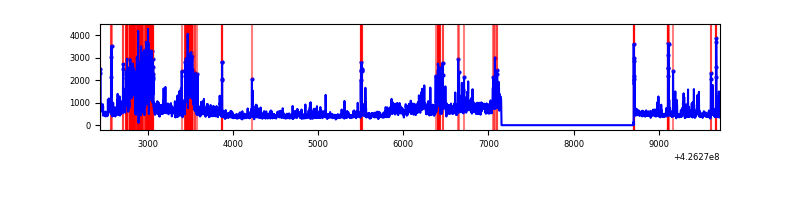 |
Top three noisy pixels from each quadrant. If the there are fewer than three noisy pixels in the level2.evt file, extra rows are filled as -1
| Pixel properties | Quadrant properties | ||||||
|---|---|---|---|---|---|---|---|
| Quadrant | DetID | PixID | Counts | Sigma | Mean | Median | Sigma |
| A | 10 | 83 | 607057 | 4850.16 | 607 | 594 | 125.0 |
| A | 12 | 189 | 109424 | 870.36 | 607 | 594 | 125.0 |
| A | 15 | 223 | 25544 | 199.54 | 607 | 594 | 125.0 |
| B | 0 | 186 | 373669 | 3194.29 | 597 | 580 | 116.8 |
| B | 5 | 255 | 116865 | 995.6 | 597 | 580 | 116.8 |
| B | 0 | 190 | 75826 | 644.24 | 597 | 580 | 116.8 |
| C | 15 | 214 | 236021 | 1668.37 | 599 | 603 | 141.1 |
| C | 7 | 220 | 18959 | 130.09 | 599 | 603 | 141.1 |
| C | 3 | 233 | 14398 | 97.76 | 599 | 603 | 141.1 |
| D | 13 | 249 | 810693 | 5646.29 | 584 | 568 | 143.5 |
| D | 1 | 52 | 649324 | 4521.6 | 584 | 568 | 143.5 |
| D | 10 | 199 | 124443 | 863.37 | 584 | 568 | 143.5 |
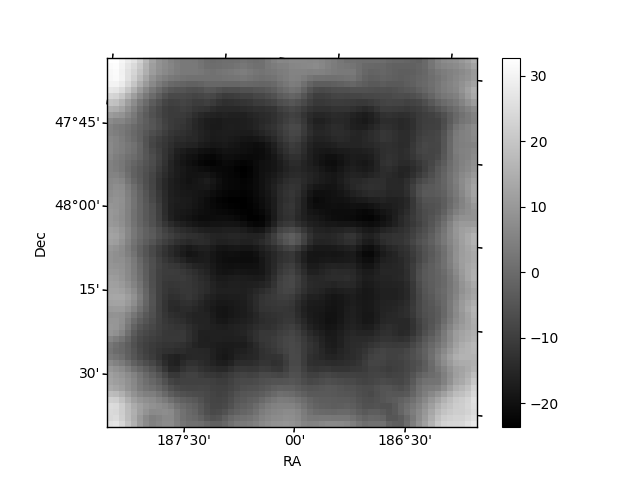
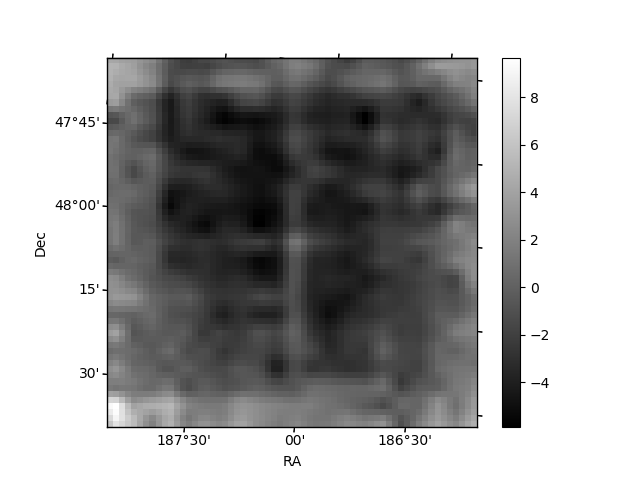
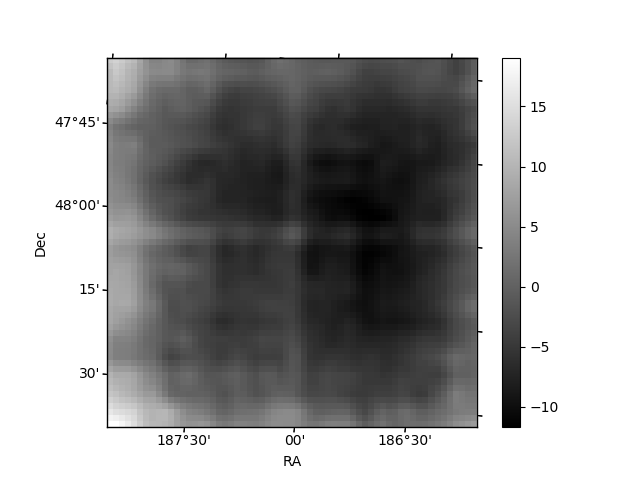
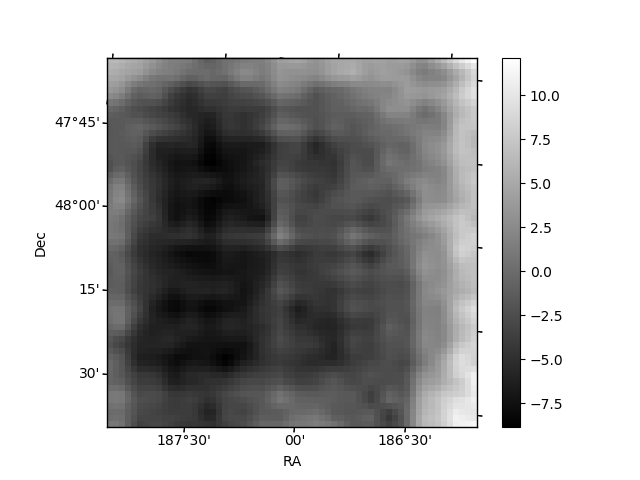
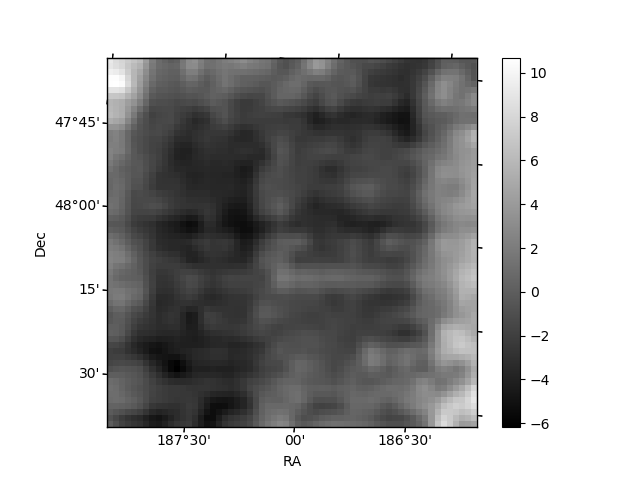
Histogram calculated using DETX and DETY for each event in the final _common_clean file
| Quadrant A | 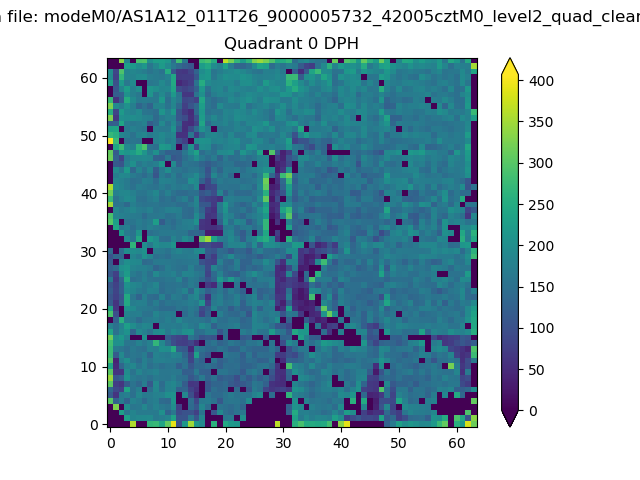 |
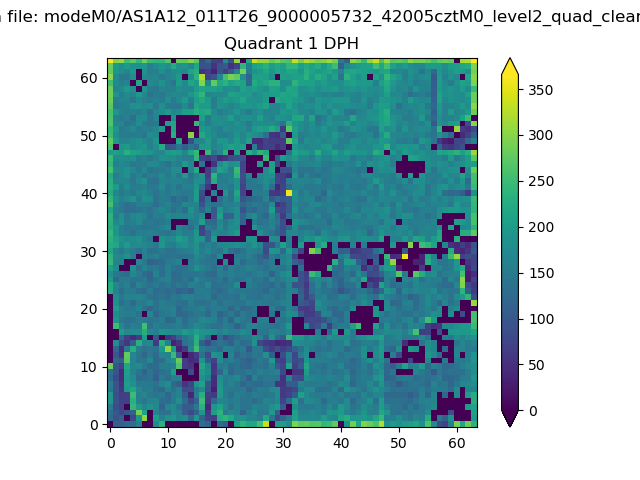 |
Quadrant B |
|---|---|---|---|
| Quadrant D | 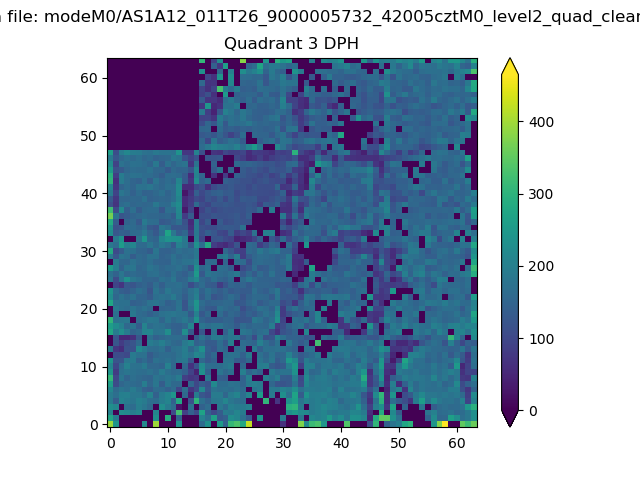 |
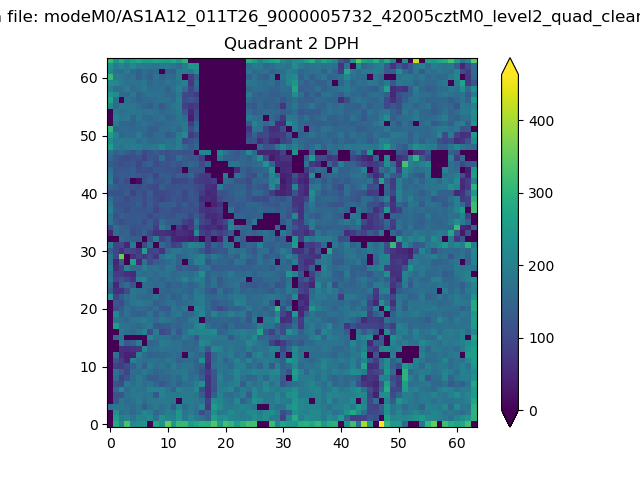 |
Quadrant C |
| Plot type | Count rate plots | Images |
|---|---|---|
| Comparison with Poisson distribution Blue bars denote a histogram of data divided into 1 sec bins. Red curve is a Poisson curve with rate = median count rate of data. |
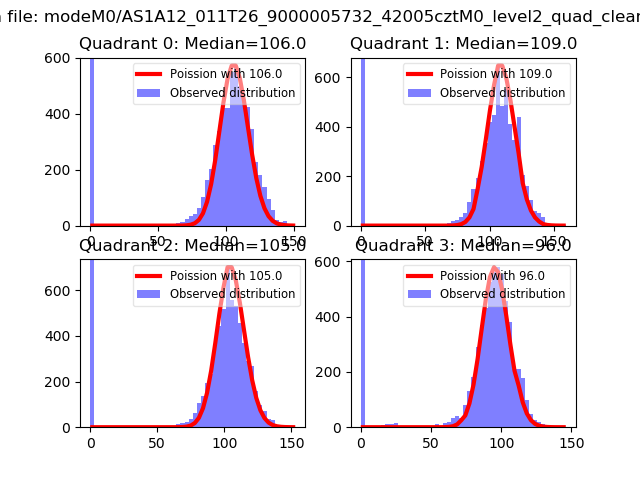 |
 |
| Quadrant-wise count rates Data is divided into 100 sec bins |
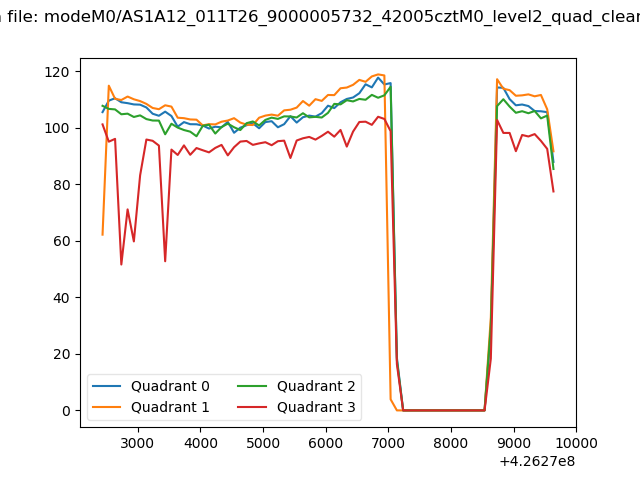 |
|
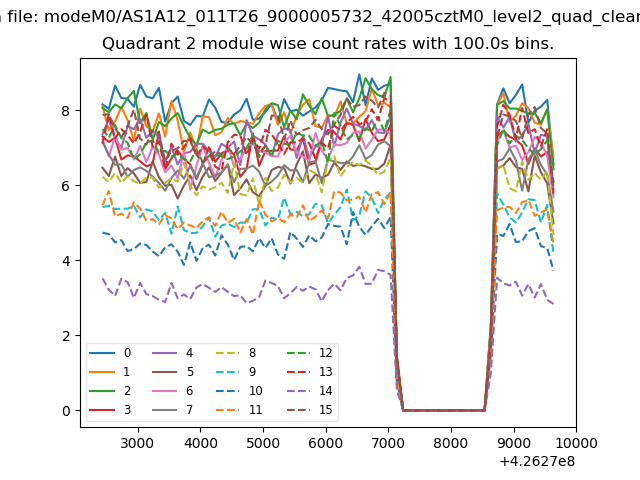
| Module-wise count rates for Quadrant A Data is divided into 100 sec bins |
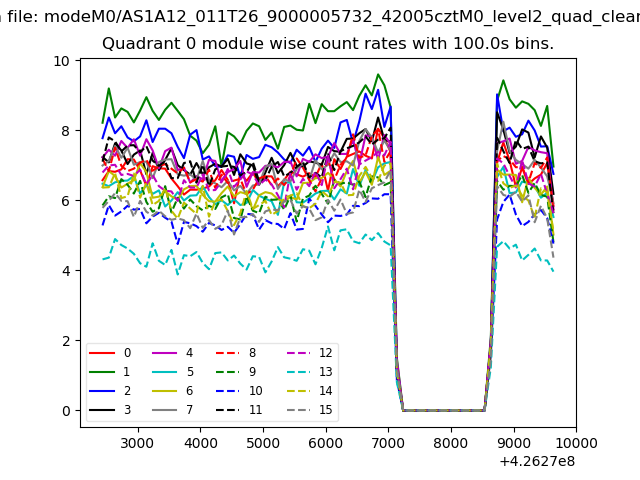 |
 |
| Module-wise count rates for Quadrant B Data is divided into 100 sec bins |
 |
 |
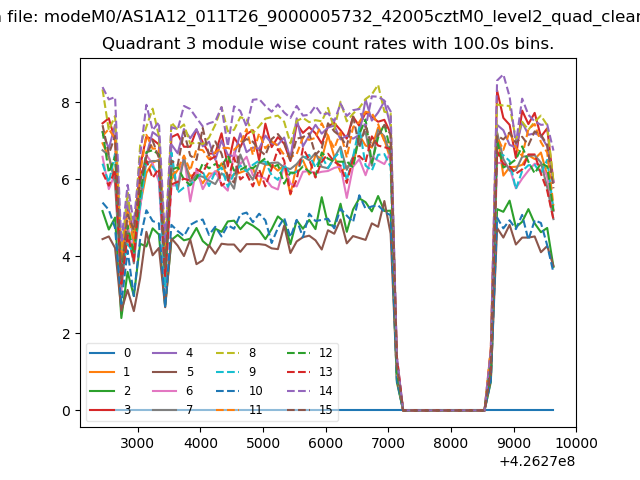
| Module-wise count rates for Quadrant C Data is divided into 100 sec bins |
 |
 |
| Module-wise count rates for Quadrant D Data is divided into 100 sec bins |
 |
 |
| Parameter | Plot |
|---|---|
| CZT HV Monitor | 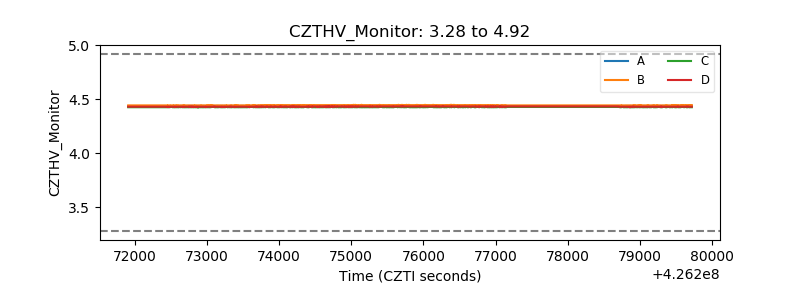 |
| D_VDD | 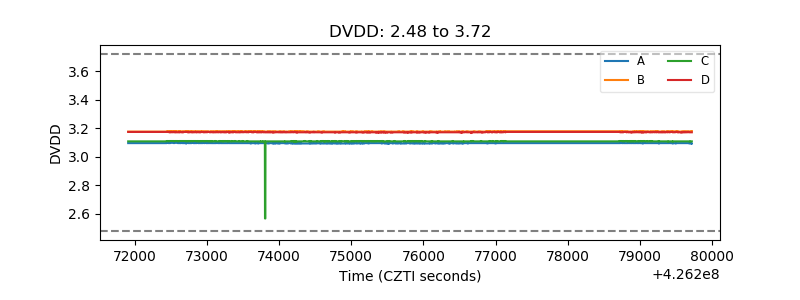 |
| Temperature 1 | 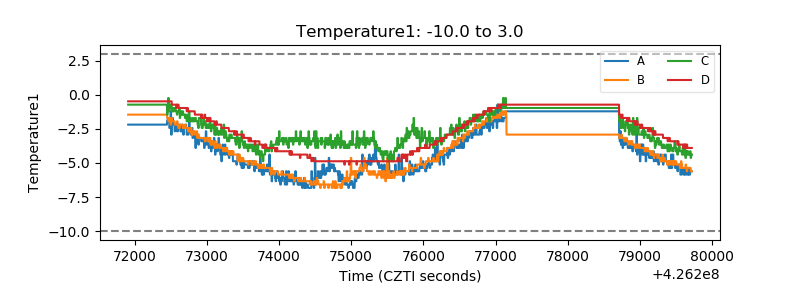 |
| Veto HV Monitor | 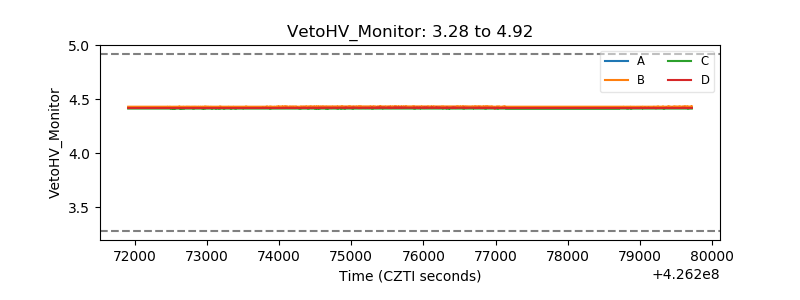 |
| Veto LLD | 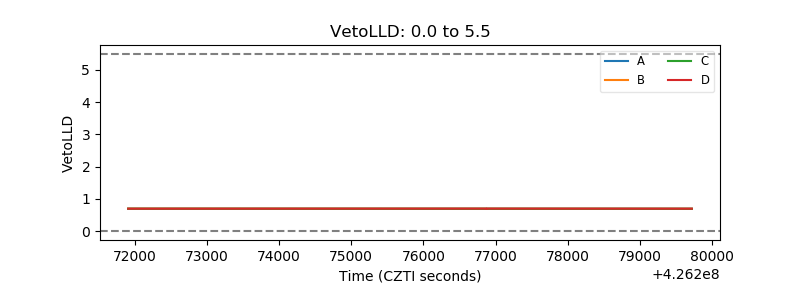 |
| Alpha Counter | 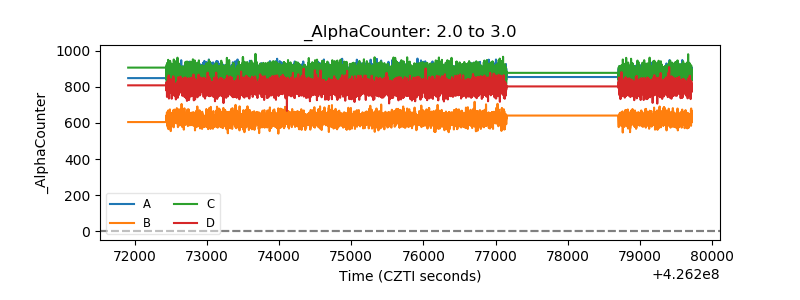 |
| _CPM_Rate | 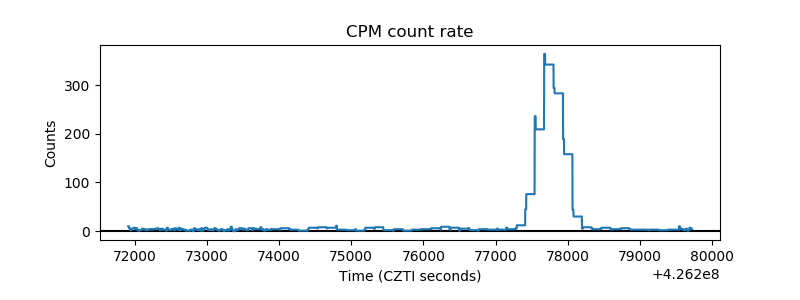 |
| CZT Counter | 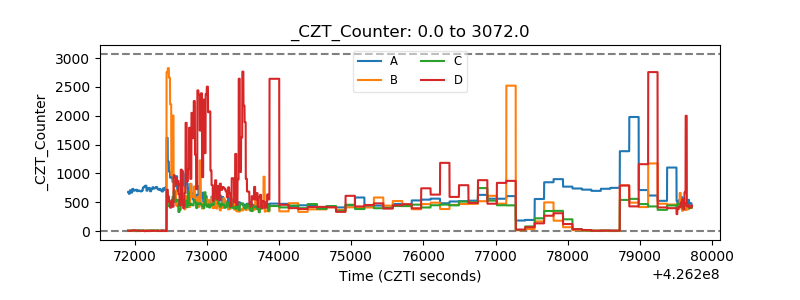 |
| +2.5 Volts monitor | 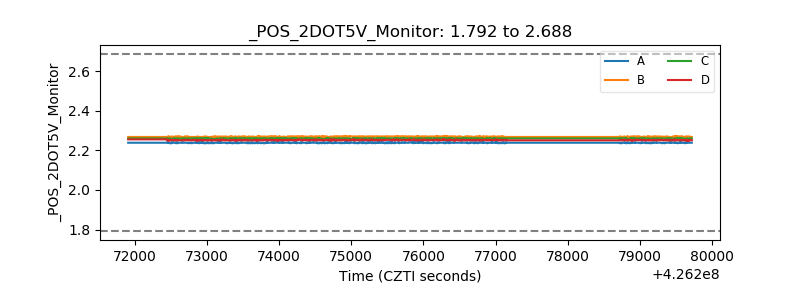 |
| +5 Volts monitor | 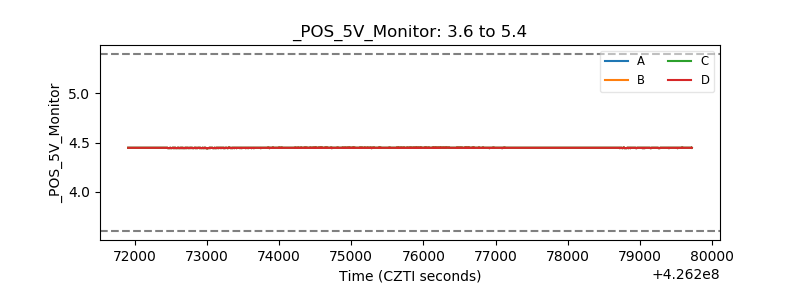 |
| _ROLL_ROT | 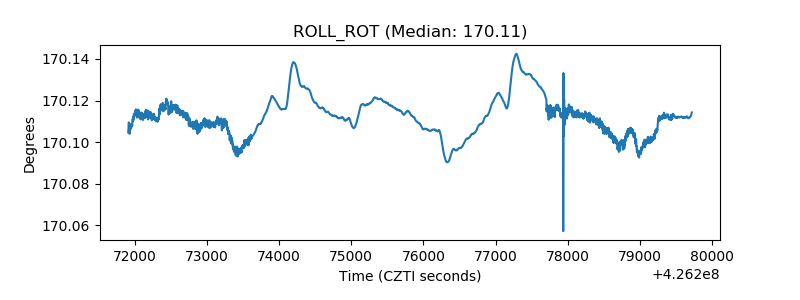 |
| _Roll_DEC | 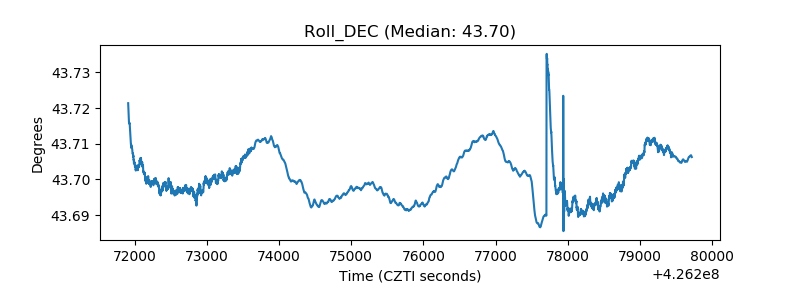 |
| _Roll_RA | 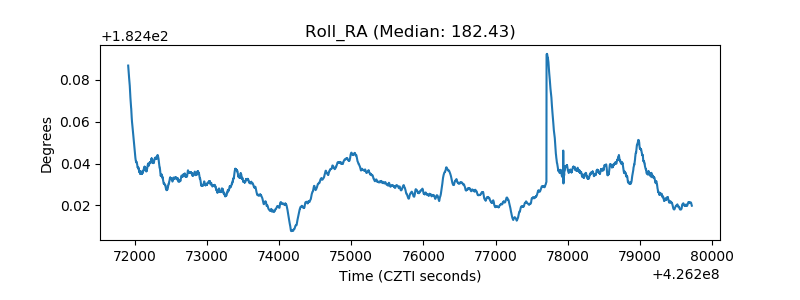 |
| Veto Counter | 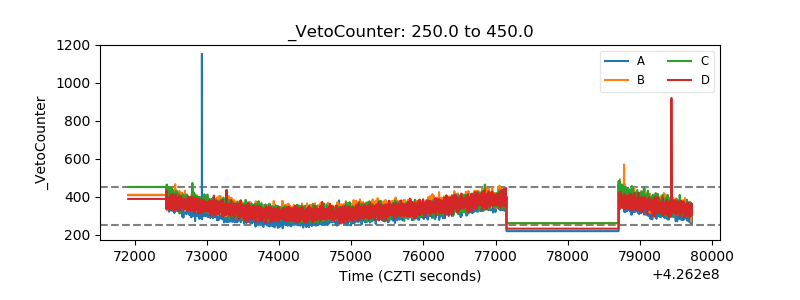 |