| Param | Original file | Final file |
|---|---|---|
| Filename | modeM0/AS1A12_011T26_9000005732_42006cztM0_level2.fits | modeM0/AS1A12_011T26_9000005732_42006cztM0_level2_quad_clean.evt |
| Size (bytes) | 305,922,240 | 86,345,280 |
| Size | 291.8 MB | 82.3 MB |
| Events in quadrant A | 3,002,489 | 571,345 |
| Events in quadrant B | 2,568,661 | 586,457 |
| Events in quadrant C | 2,431,937 | 566,662 |
| Events in quadrant D | 2,903,113 | 514,321 |
| Mode M0 | |||
|---|---|---|---|
| Quadrant | BADHDUFLAG | Total packets | Discarded packets |
| A | 0 | 12172 | 2 |
| B | 0 | 11577 | 2 |
| C | 0 | 10780 | 2 |
| D | 0 | 12561 | 2 |
| Mode M9 | |||
|---|---|---|---|
| Quadrant | BADHDUFLAG | Total packets | Discarded packets |
| A | 0 | 25 | 0 |
| B | 0 | 25 | 0 |
| C | 0 | 26 | 0 |
| D | 0 | 26 | 0 |
| Mode SS | |||
|---|---|---|---|
| Quadrant | BADHDUFLAG | Total packets | Discarded packets |
| A | 0 | 110 | 0 |
| B | 0 | 110 | 0 |
| C | 0 | 110 | 0 |
| D | 0 | 110 | 0 |
| Quadrant | Total seconds | Saturated seconds | Saturation percentage |
|---|---|---|---|
| A | 5361 | 28 | 0.522291% |
| B | 5361 | 37 | 0.690170% |
| C | 5361 | 5 | 0.093266% |
| D | 5361 | 115 | 2.145122% |
Noise dominated data is calculated using 1-second bins in cleaned event files. If a bin has >2000 counts, and if more than 50% of those come from <1% of pixels, then it is considered to be noise-dominated and hence unusable.
| Quadrant | # 1 sec bins | Bins with >0 counts | Bins with >2000 counts | High rate bins dominated by noise | Noise dominated (total time) | Noise dominated (detector-on time) | Marked lightcurve |
|---|---|---|---|---|---|---|---|
| A | 7064 | 5362 | 22 | 22 | 0.31% | 0.41% | 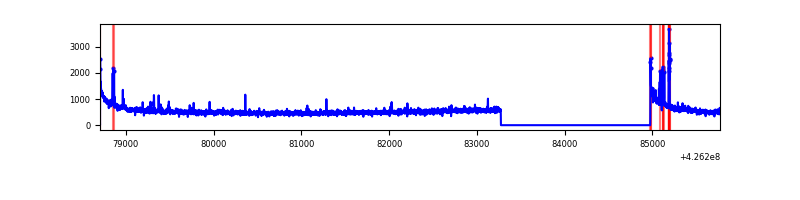 |
| B | 7064 | 5361 | 13 | 13 | 0.18% | 0.24% | 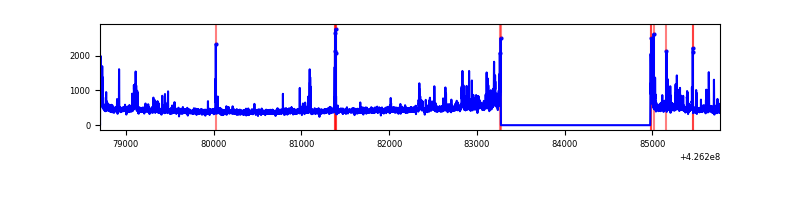 |
| C | 7064 | 5361 | 0 | 0 | 0.00% | 0.00% | 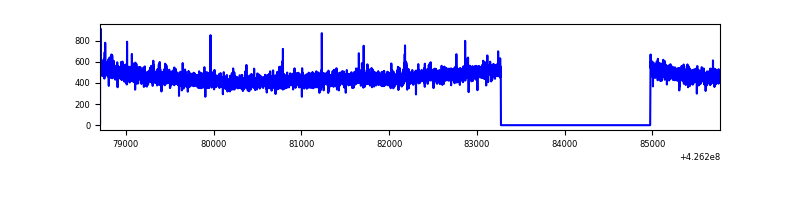 |
| D | 7064 | 5362 | 93 | 93 | 1.32% | 1.73% | 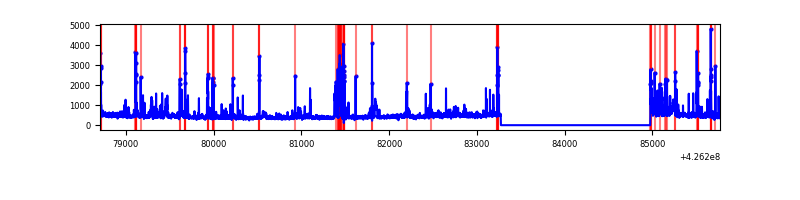 |
Top three noisy pixels from each quadrant. If the there are fewer than three noisy pixels in the level2.evt file, extra rows are filled as -1
| Pixel properties | Quadrant properties | ||||||
|---|---|---|---|---|---|---|---|
| Quadrant | DetID | PixID | Counts | Sigma | Mean | Median | Sigma |
| A | 10 | 83 | 565041 | 4787.19 | 570 | 557 | 117.9 |
| A | 15 | 235 | 90862 | 765.84 | 570 | 557 | 117.9 |
| A | 15 | 223 | 84468 | 711.62 | 570 | 557 | 117.9 |
| B | 4 | 171 | 166374 | 1494.71 | 569 | 554 | 110.9 |
| B | 5 | 255 | 72837 | 651.56 | 569 | 554 | 110.9 |
| B | 0 | 190 | 46868 | 417.48 | 569 | 554 | 110.9 |
| C | 15 | 214 | 221586 | 1676.72 | 561 | 564 | 131.8 |
| C | 7 | 220 | 8109 | 57.24 | 561 | 564 | 131.8 |
| C | 3 | 233 | 7423 | 52.03 | 561 | 564 | 131.8 |
| D | 13 | 249 | 344018 | 2533.67 | 553 | 537 | 135.6 |
| D | 10 | 199 | 169095 | 1243.36 | 553 | 537 | 135.6 |
| D | 1 | 52 | 57906 | 423.18 | 553 | 537 | 135.6 |
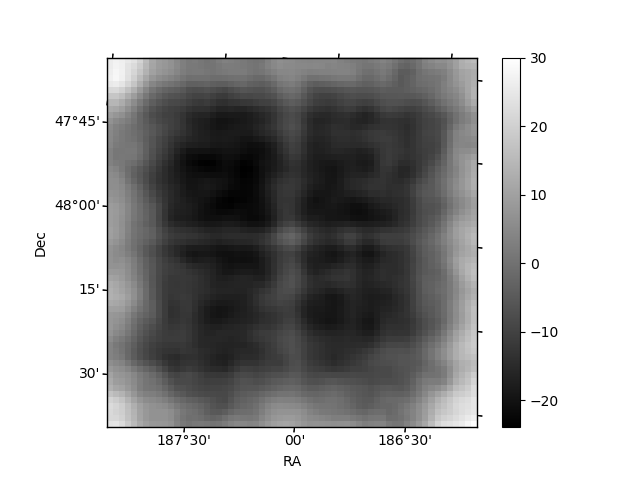
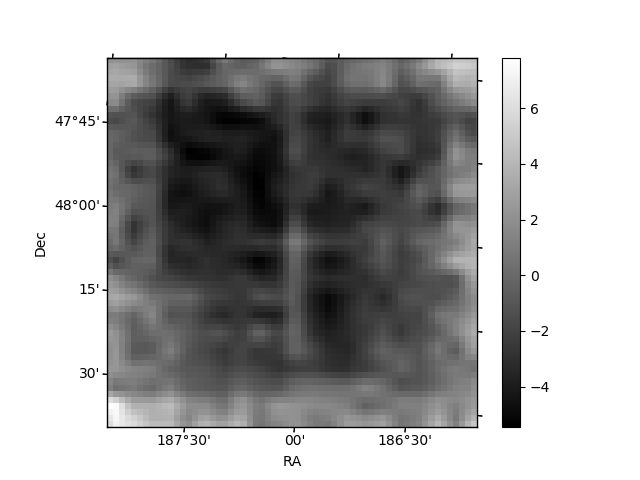
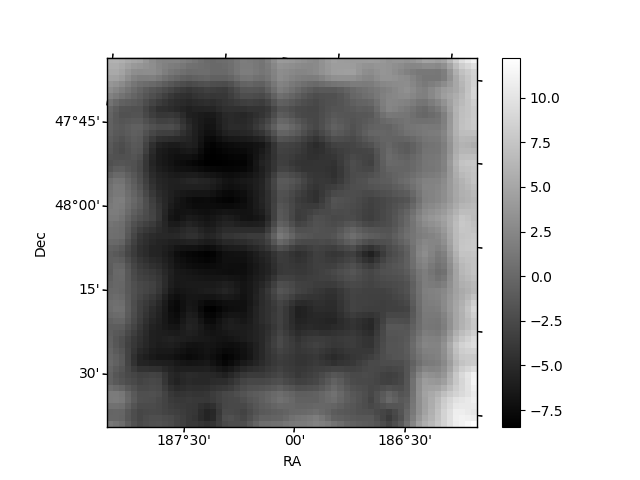
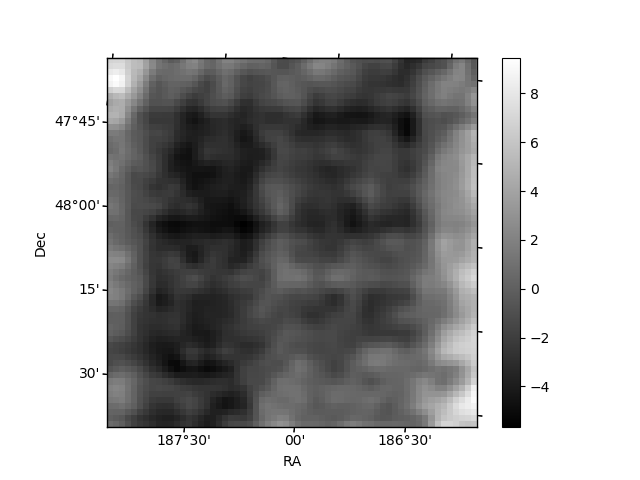
Histogram calculated using DETX and DETY for each event in the final _common_clean file
| Quadrant A | 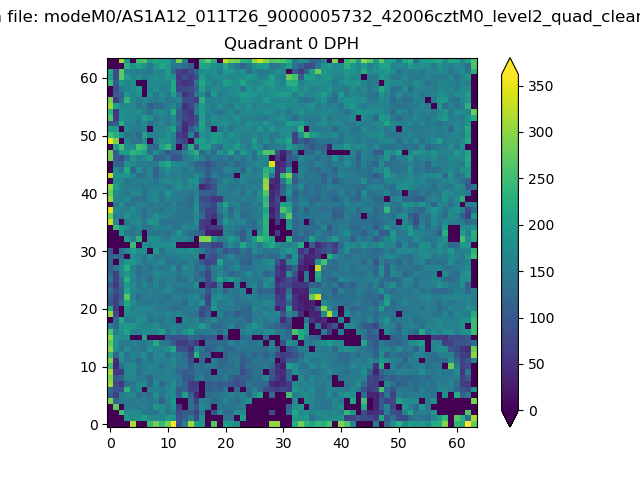 |
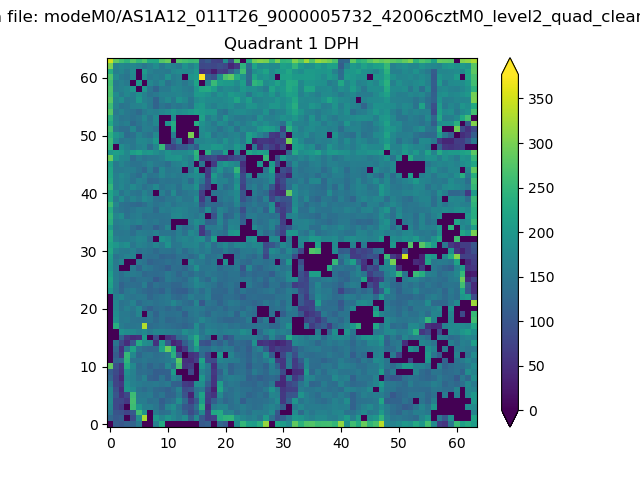 |
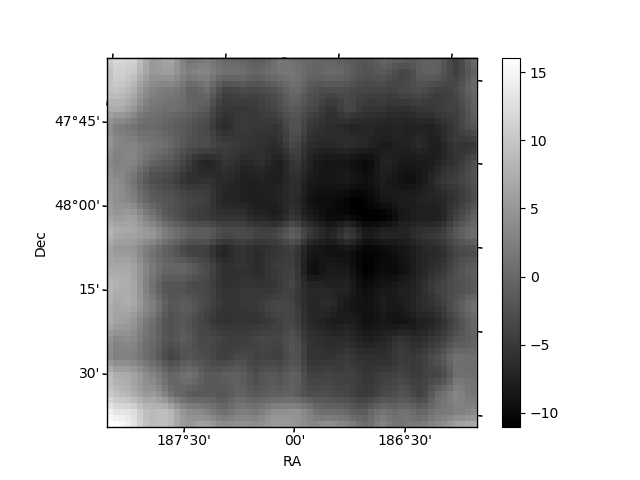
Quadrant B |
|---|---|---|---|
| Quadrant D | 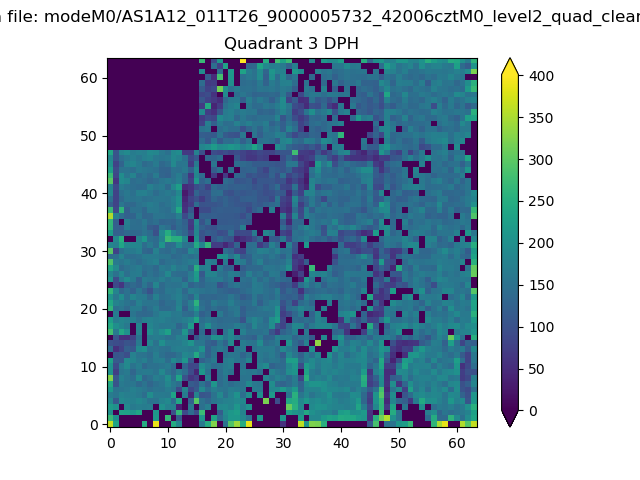 |
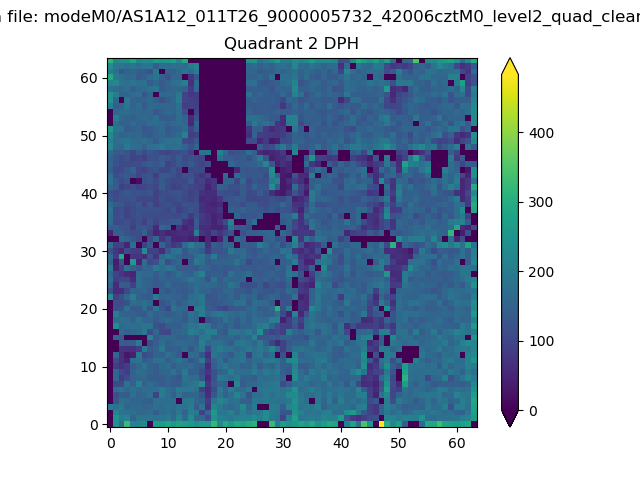 |
Quadrant C |
| Plot type | Count rate plots | Images |
|---|---|---|
| Comparison with Poisson distribution Blue bars denote a histogram of data divided into 1 sec bins. Red curve is a Poisson curve with rate = median count rate of data. |
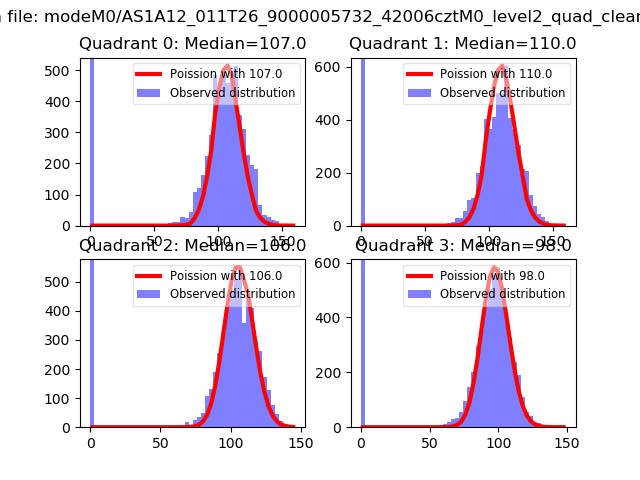 |
 |
| Quadrant-wise count rates Data is divided into 100 sec bins |
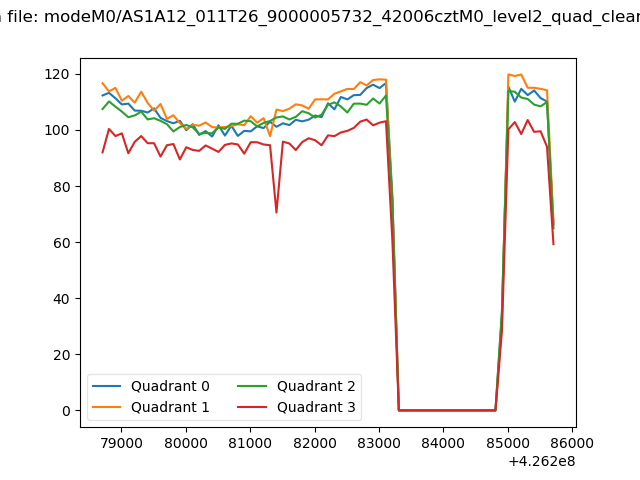 |
|
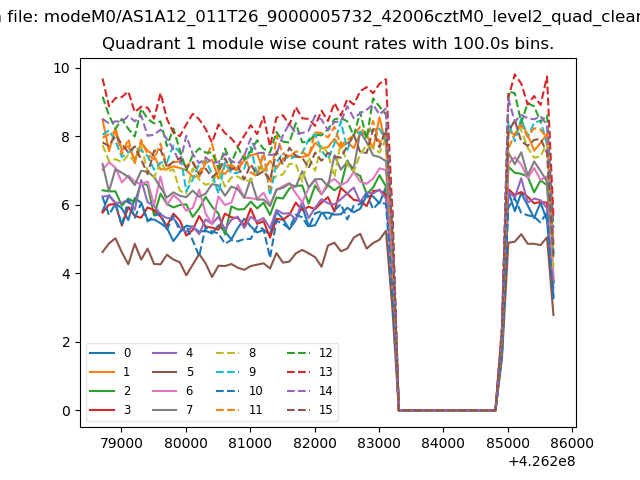
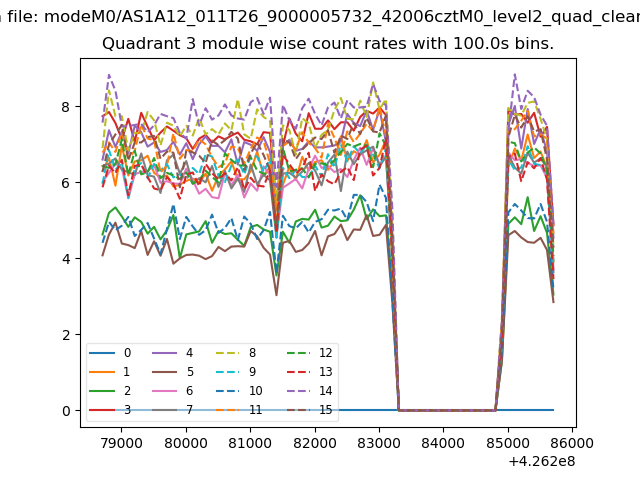
| Module-wise count rates for Quadrant A Data is divided into 100 sec bins |
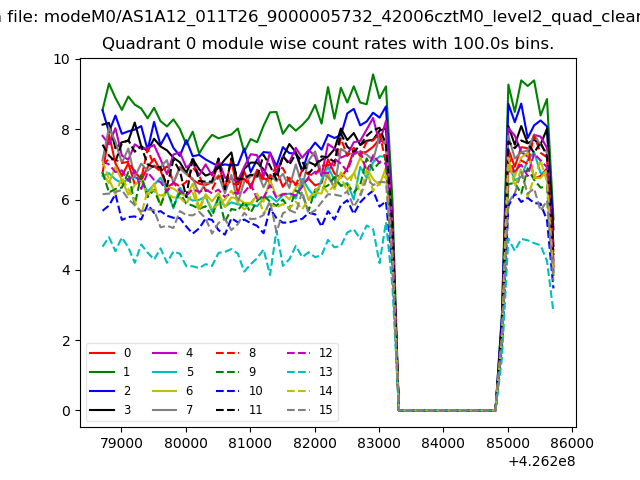 |
 |
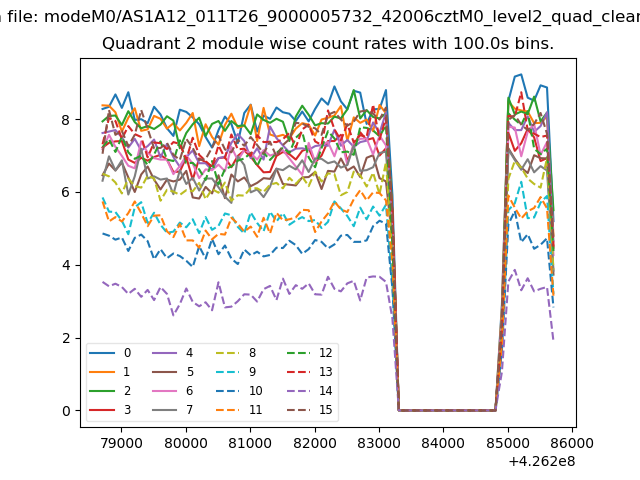
| Module-wise count rates for Quadrant B Data is divided into 100 sec bins |
 |
 |
| Module-wise count rates for Quadrant C Data is divided into 100 sec bins |
 |
 |
| Module-wise count rates for Quadrant D Data is divided into 100 sec bins |
 |
 |
| Parameter | Plot |
|---|---|
| CZT HV Monitor | 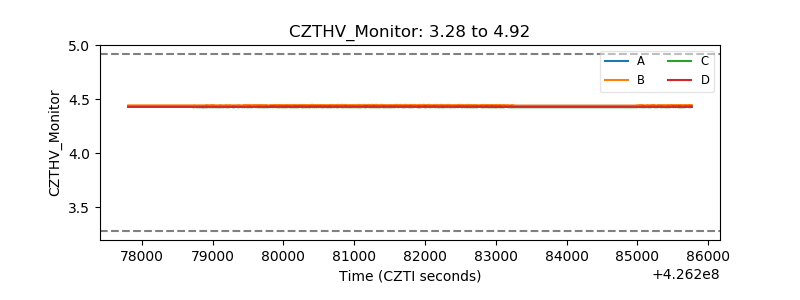 |
| D_VDD | 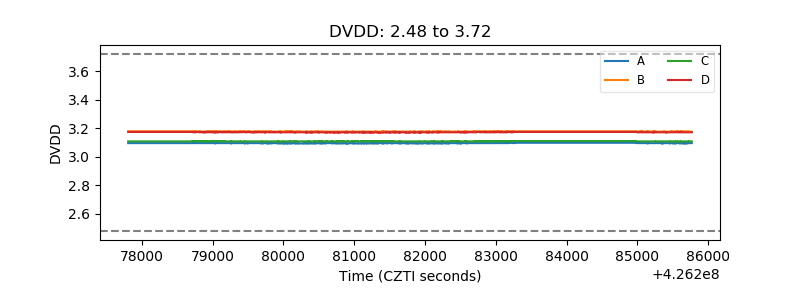 |
| Temperature 1 | 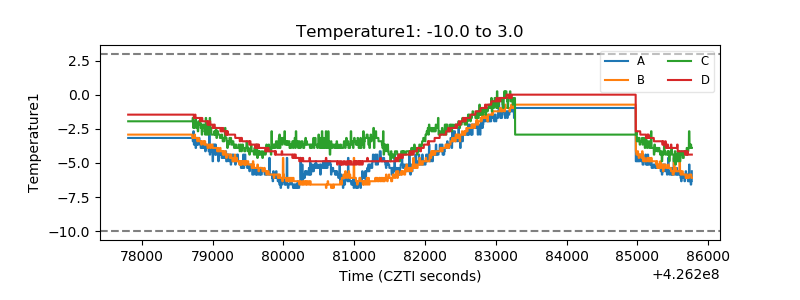 |
| Veto HV Monitor | 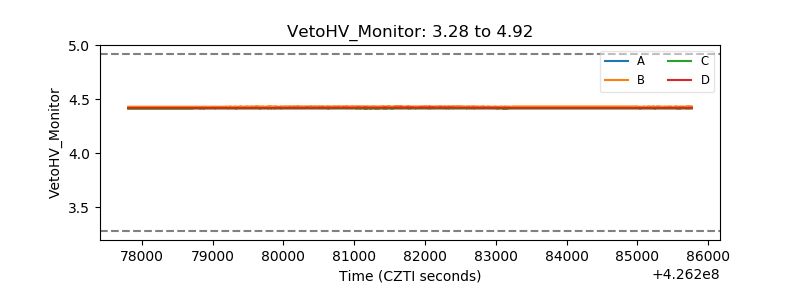 |
| Veto LLD | 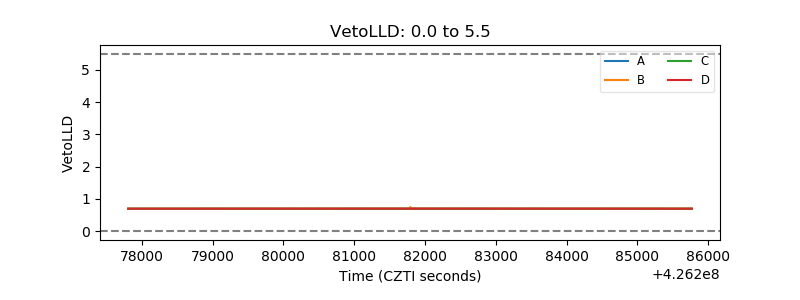 |
| Alpha Counter | 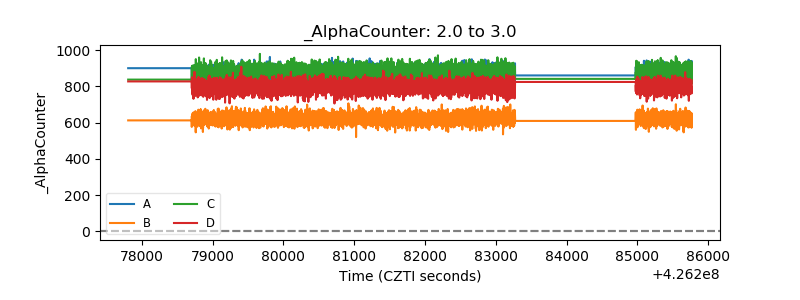 |
| _CPM_Rate | 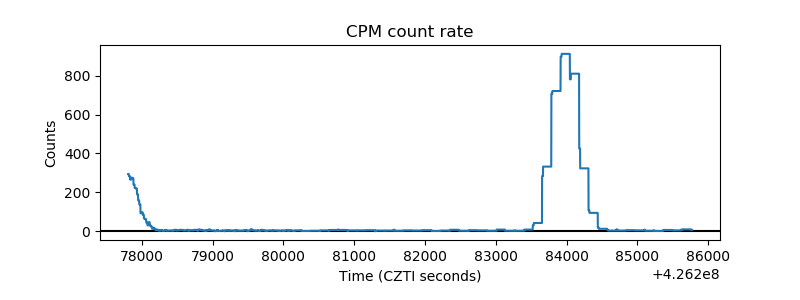 |
| CZT Counter | 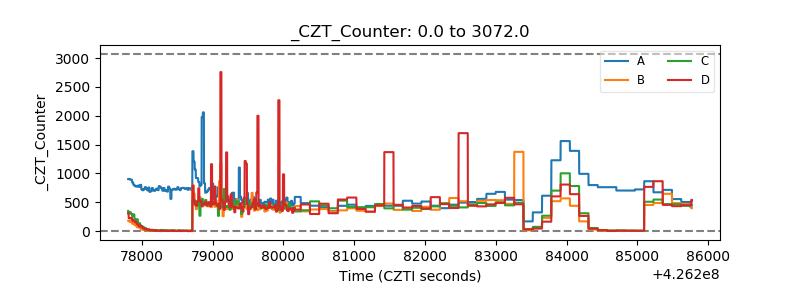 |
| +2.5 Volts monitor | 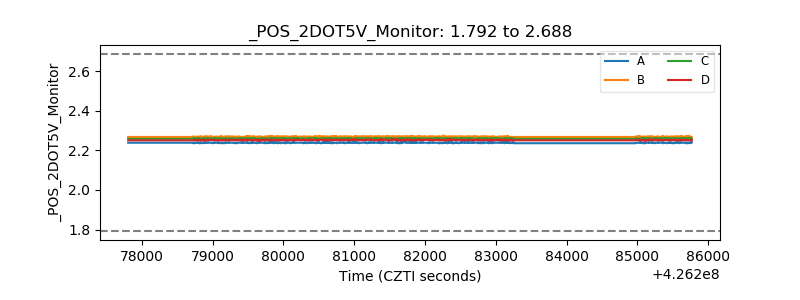 |
| +5 Volts monitor | 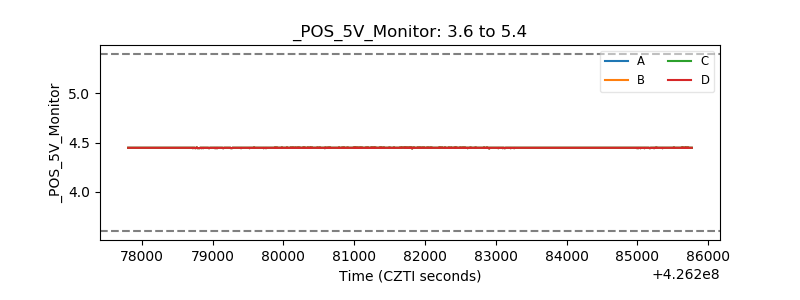 |
| _ROLL_ROT | 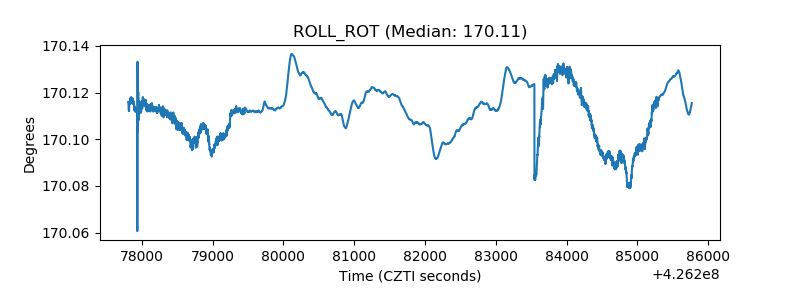 |
| _Roll_DEC | 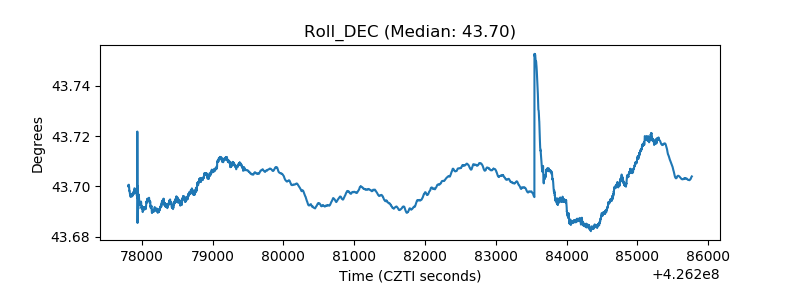 |
| _Roll_RA | 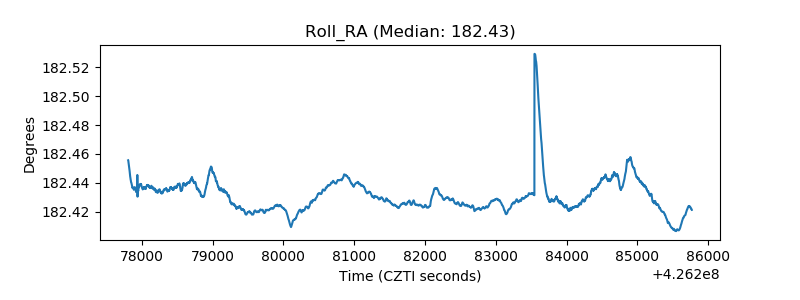 |
| Veto Counter | 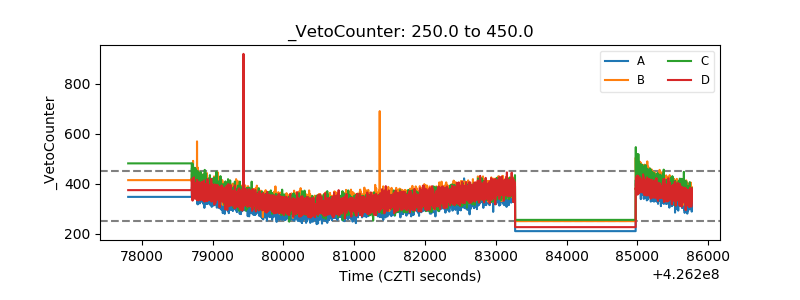 |