| Param | Original file | Final file |
|---|---|---|
| Filename | modeM0/AS1A12_011T26_9000005732_42008cztM0_level2.fits | modeM0/AS1A12_011T26_9000005732_42008cztM0_level2_quad_clean.evt |
| Size (bytes) | 303,281,280 | 86,722,560 |
| Size | 289.2 MB | 82.7 MB |
| Events in quadrant A | 2,989,598 | 574,604 |
| Events in quadrant B | 2,497,464 | 593,827 |
| Events in quadrant C | 2,406,891 | 572,871 |
| Events in quadrant D | 2,922,463 | 516,015 |
| Mode M0 | |||
|---|---|---|---|
| Quadrant | BADHDUFLAG | Total packets | Discarded packets |
| A | 0 | 12172 | 2 |
| B | 0 | 11194 | 2 |
| C | 0 | 10557 | 2 |
| D | 0 | 12469 | 2 |
| Mode M9 | |||
|---|---|---|---|
| Quadrant | BADHDUFLAG | Total packets | Discarded packets |
| A | 0 | 28 | 0 |
| B | 0 | 29 | 0 |
| C | 0 | 29 | 0 |
| D | 0 | 29 | 0 |
| Mode SS | |||
|---|---|---|---|
| Quadrant | BADHDUFLAG | Total packets | Discarded packets |
| A | 0 | 108 | 0 |
| B | 0 | 108 | 0 |
| C | 0 | 108 | 0 |
| D | 0 | 108 | 0 |
| Quadrant | Total seconds | Saturated seconds | Saturation percentage |
|---|---|---|---|
| A | 5259 | 28 | 0.532421% |
| B | 5259 | 34 | 0.646511% |
| C | 5259 | 4 | 0.076060% |
| D | 5259 | 110 | 2.091652% |
Noise dominated data is calculated using 1-second bins in cleaned event files. If a bin has >2000 counts, and if more than 50% of those come from <1% of pixels, then it is considered to be noise-dominated and hence unusable.
| Quadrant | # 1 sec bins | Bins with >0 counts | Bins with >2000 counts | High rate bins dominated by noise | Noise dominated (total time) | Noise dominated (detector-on time) | Marked lightcurve |
|---|---|---|---|---|---|---|---|
| A | 7081 | 5260 | 25 | 25 | 0.35% | 0.48% | 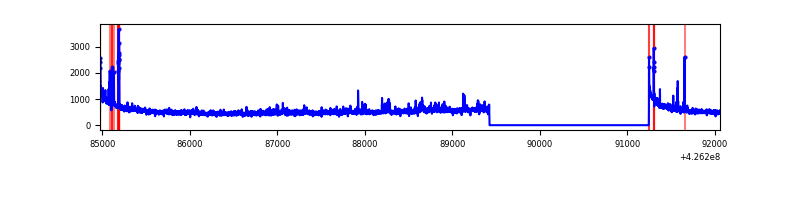 |
| B | 7081 | 5260 | 18 | 18 | 0.25% | 0.34% | 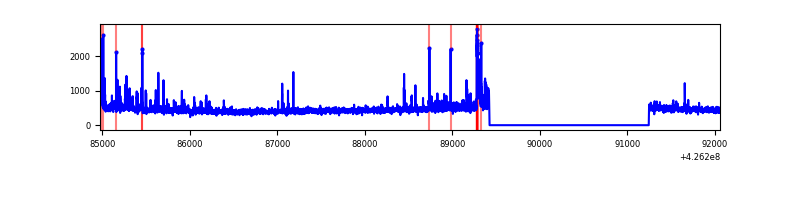 |
| C | 7081 | 5260 | 0 | 0 | 0.00% | 0.00% | 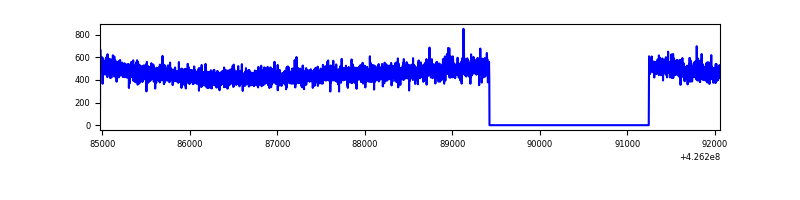 |
| D | 7081 | 5260 | 106 | 106 | 1.50% | 2.02% | 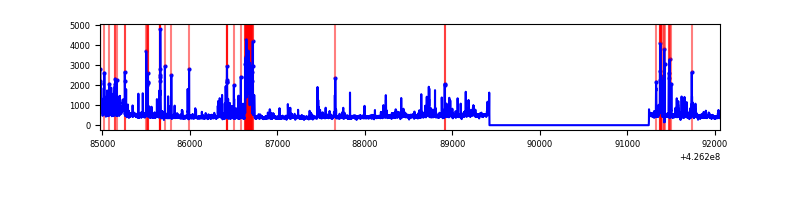 |
Top three noisy pixels from each quadrant. If the there are fewer than three noisy pixels in the level2.evt file, extra rows are filled as -1
| Pixel properties | Quadrant properties | ||||||
|---|---|---|---|---|---|---|---|
| Quadrant | DetID | PixID | Counts | Sigma | Mean | Median | Sigma |
| A | 10 | 83 | 542416 | 4571.5 | 569 | 556 | 118.5 |
| A | 12 | 189 | 122681 | 1030.33 | 569 | 556 | 118.5 |
| A | 15 | 223 | 76196 | 638.15 | 569 | 556 | 118.5 |
| B | 4 | 171 | 114927 | 1033.29 | 569 | 553 | 110.7 |
| B | 5 | 255 | 67180 | 601.93 | 569 | 553 | 110.7 |
| B | 0 | 190 | 45841 | 409.15 | 569 | 553 | 110.7 |
| C | 15 | 214 | 219036 | 1681.54 | 558 | 562 | 129.9 |
| C | 12 | 249 | 4051 | 26.85 | 558 | 562 | 129.9 |
| C | 13 | 61 | 3723 | 24.33 | 558 | 562 | 129.9 |
| D | 13 | 249 | 279033 | 2039.7 | 550 | 534 | 136.5 |
| D | 2 | 249 | 184154 | 1344.81 | 550 | 534 | 136.5 |
| D | 10 | 199 | 117040 | 853.28 | 550 | 534 | 136.5 |
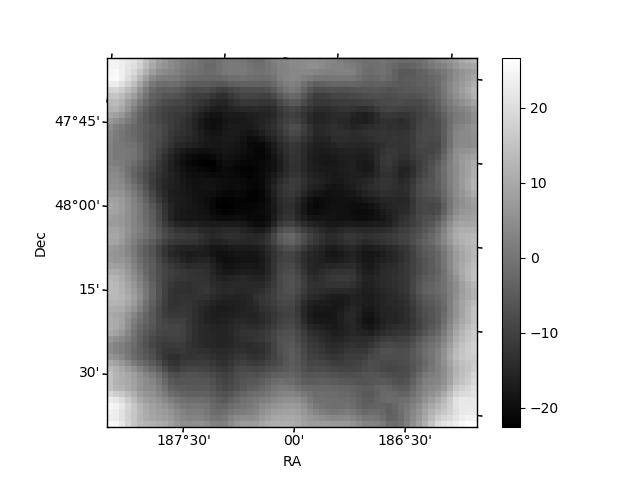
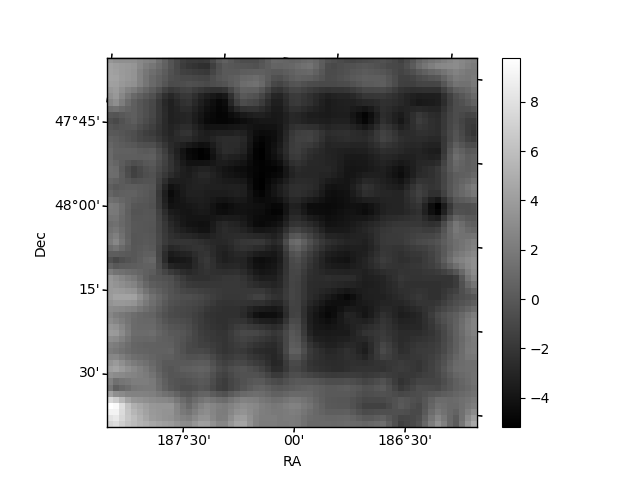
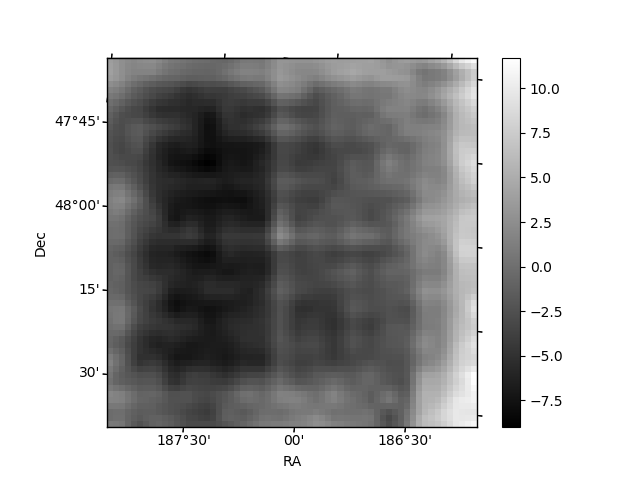
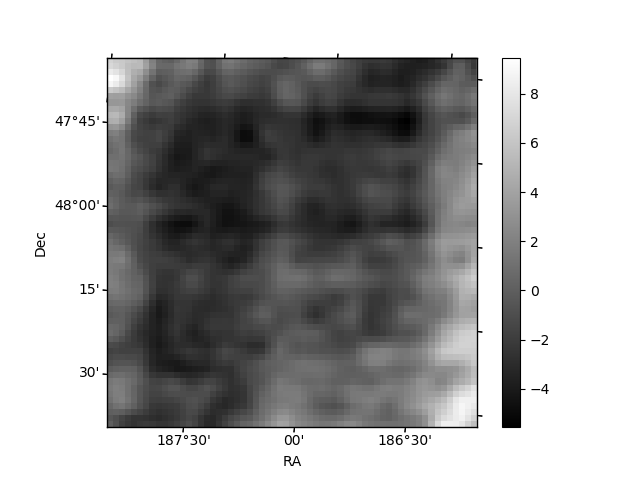
Histogram calculated using DETX and DETY for each event in the final _common_clean file
| Quadrant A | 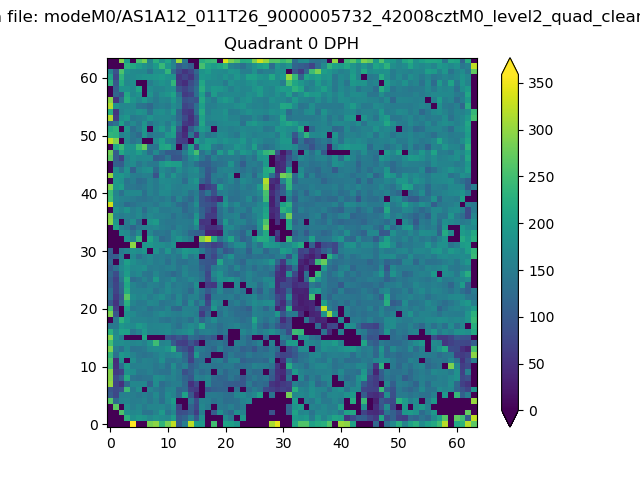 |
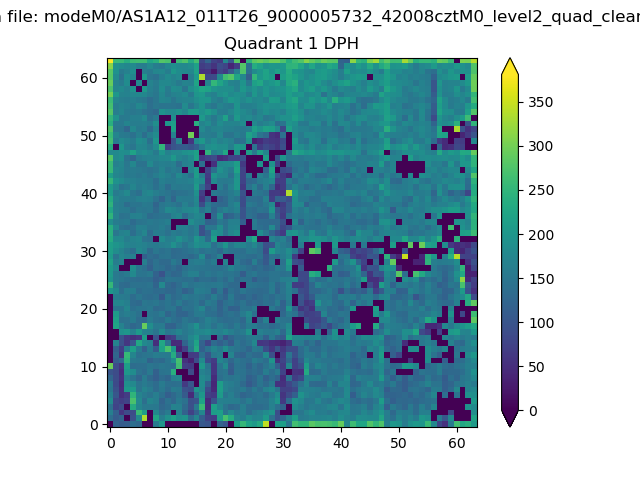 |
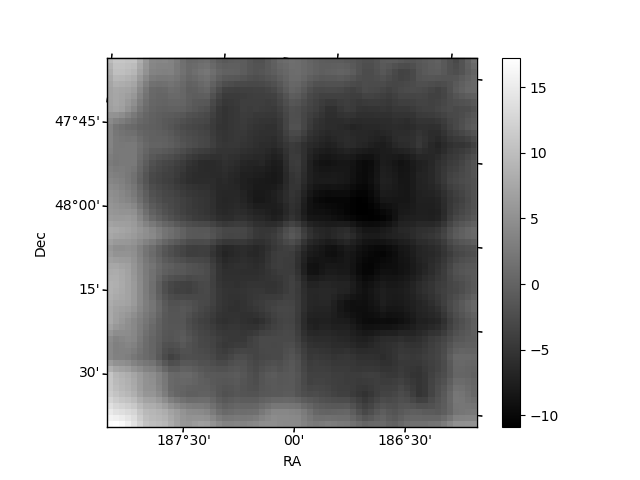
Quadrant B |
|---|---|---|---|
| Quadrant D | 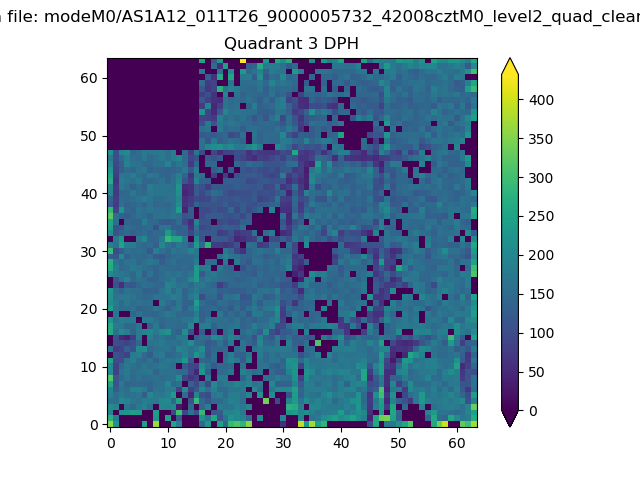 |
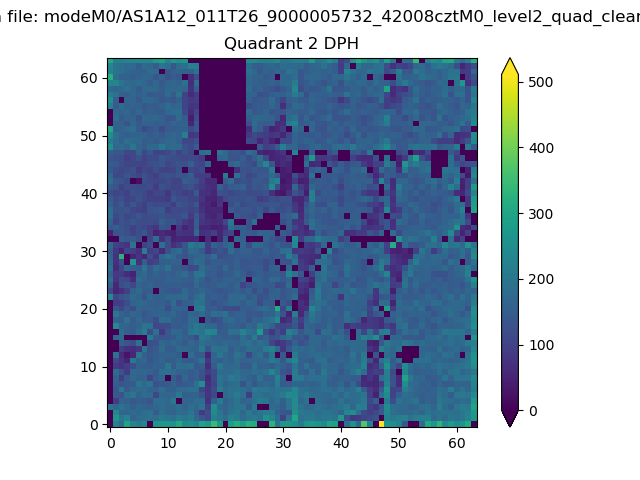 |
Quadrant C |
| Plot type | Count rate plots | Images |
|---|---|---|
| Comparison with Poisson distribution Blue bars denote a histogram of data divided into 1 sec bins. Red curve is a Poisson curve with rate = median count rate of data. |
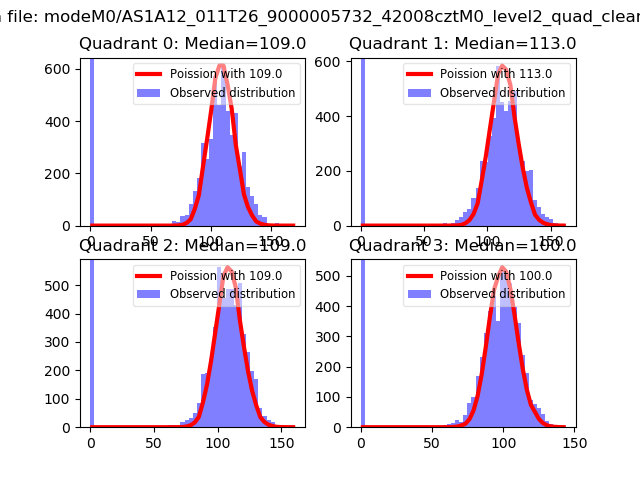 |
 |
| Quadrant-wise count rates Data is divided into 100 sec bins |
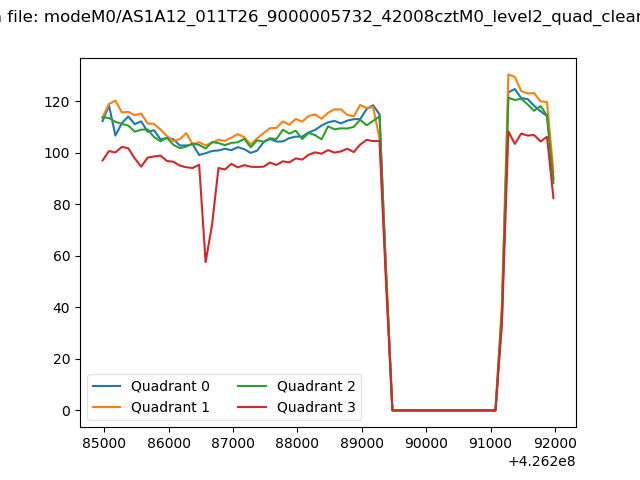 |
|
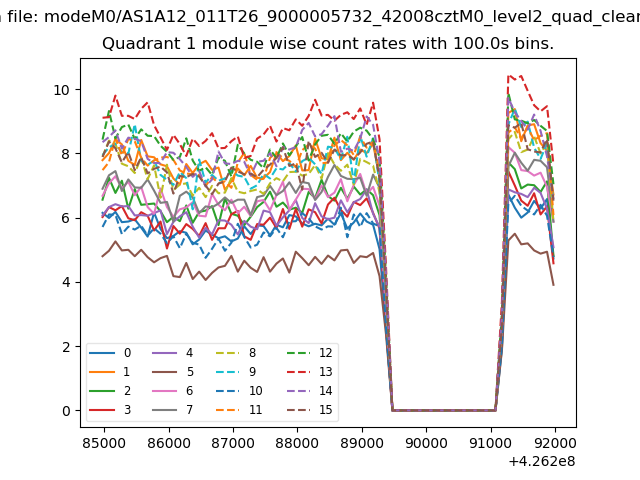
| Module-wise count rates for Quadrant A Data is divided into 100 sec bins |
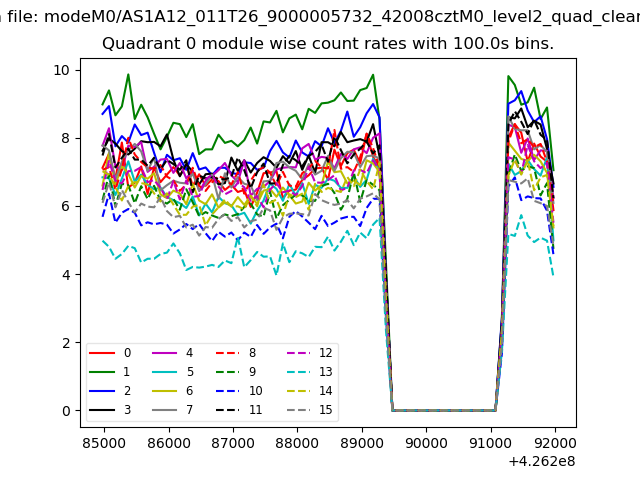 |
 |
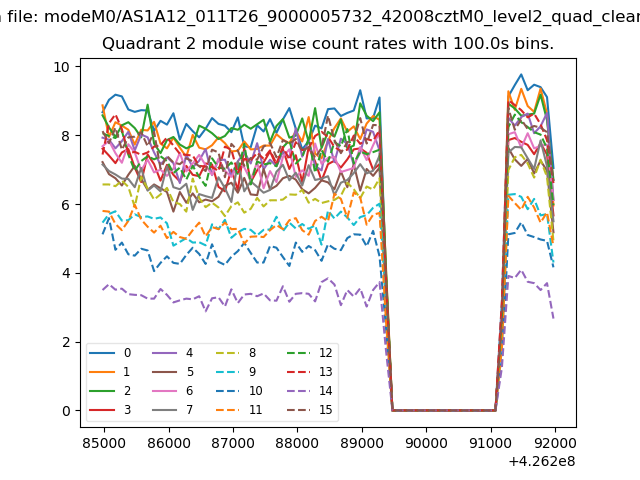
| Module-wise count rates for Quadrant B Data is divided into 100 sec bins |
 |
 |
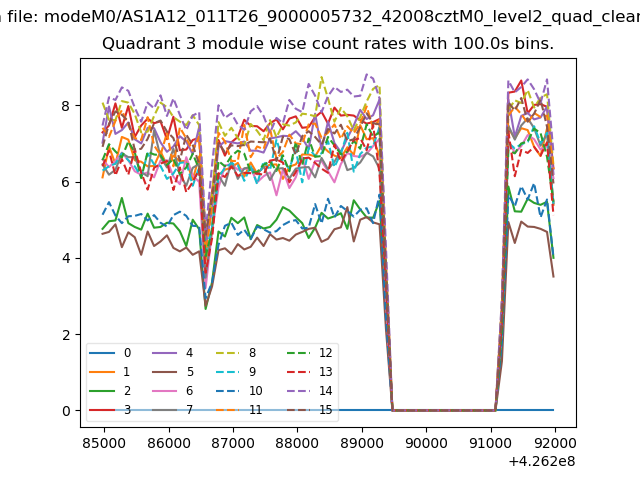
| Module-wise count rates for Quadrant C Data is divided into 100 sec bins |
 |
 |
| Module-wise count rates for Quadrant D Data is divided into 100 sec bins |
 |
 |
| Parameter | Plot |
|---|---|
| CZT HV Monitor | 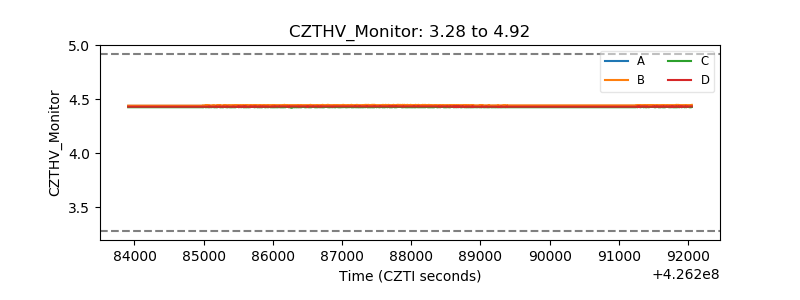 |
| D_VDD | 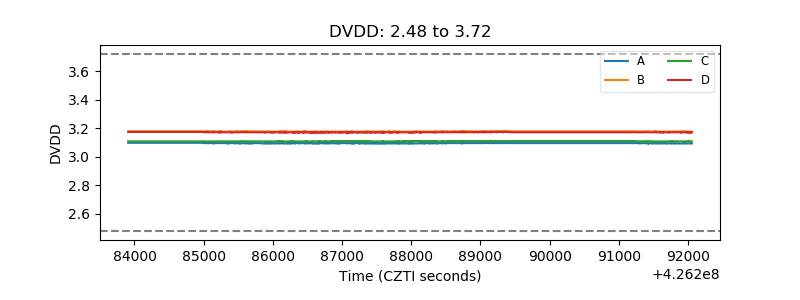 |
| Temperature 1 | 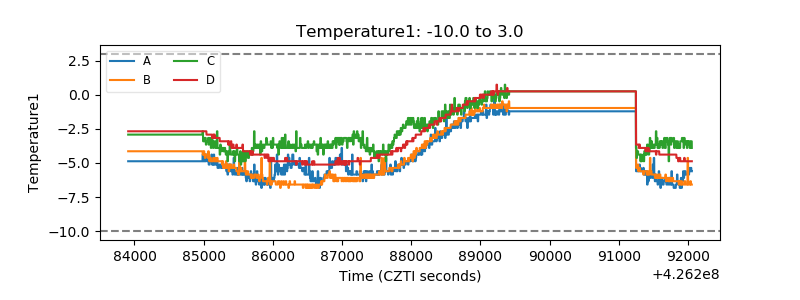 |
| Veto HV Monitor | 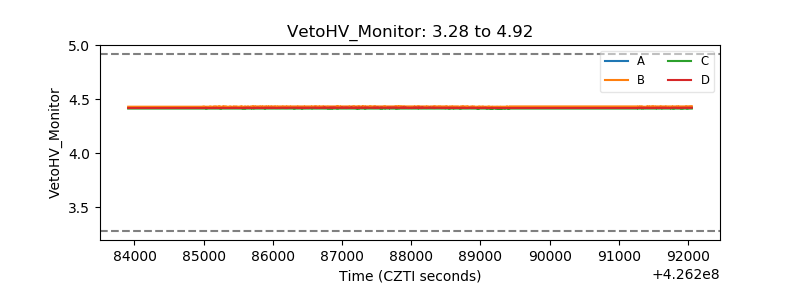 |
| Veto LLD | 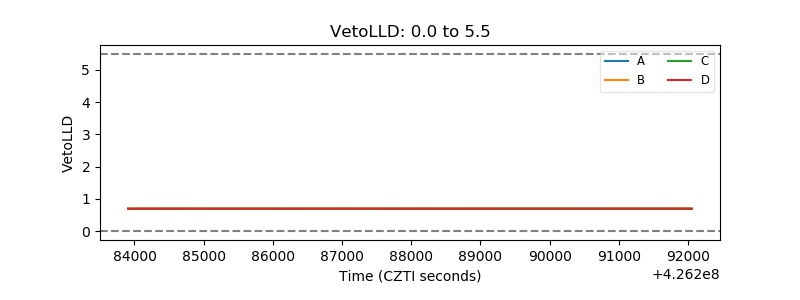 |
| Alpha Counter | 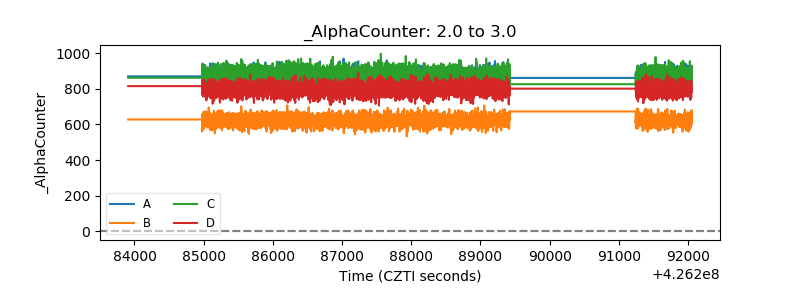 |
| _CPM_Rate |  |
| CZT Counter | 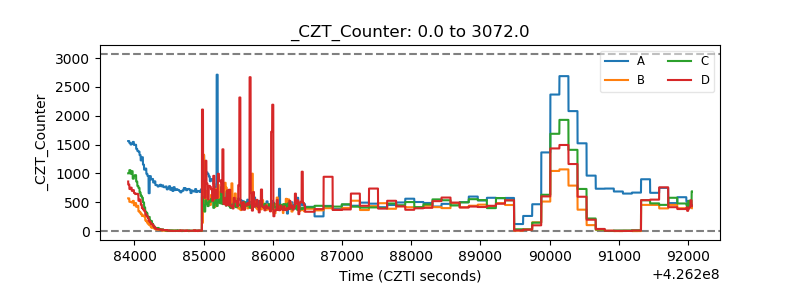 |
| +2.5 Volts monitor | 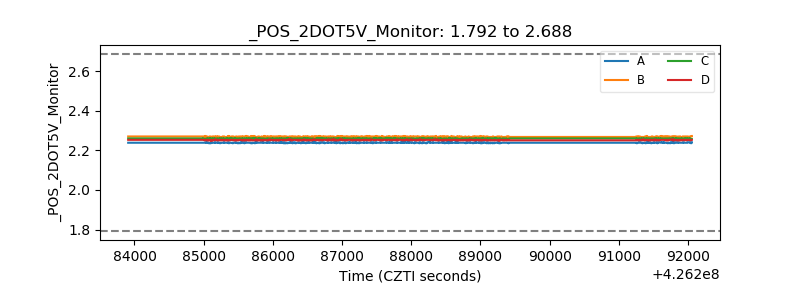 |
| +5 Volts monitor | 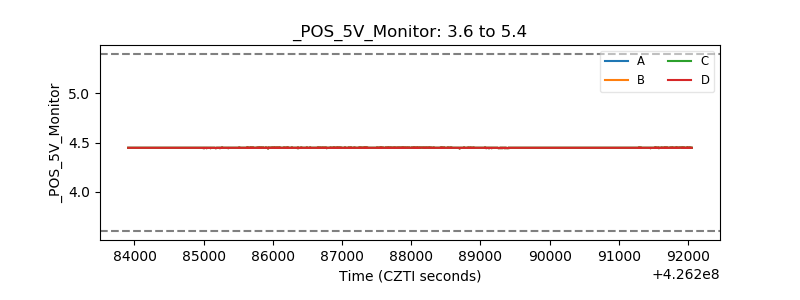 |
| _ROLL_ROT | 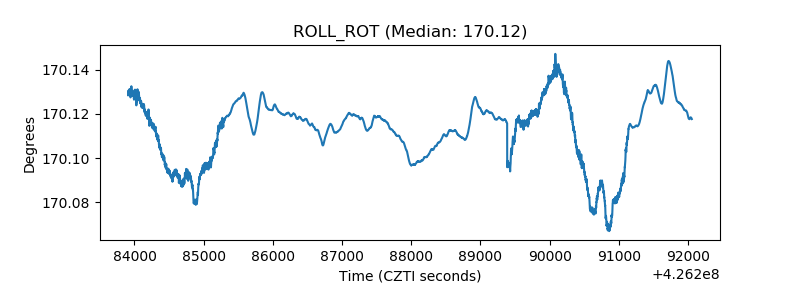 |
| _Roll_DEC | 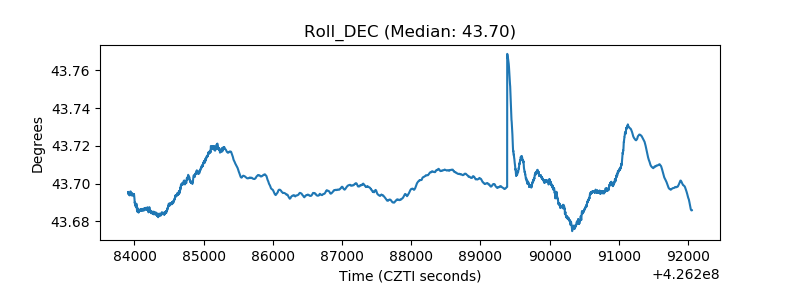 |
| _Roll_RA | 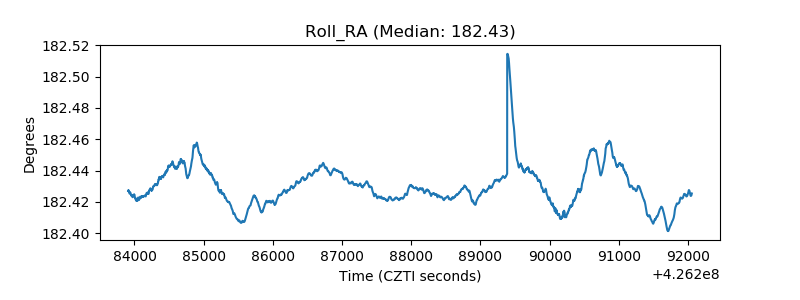 |
| Veto Counter | 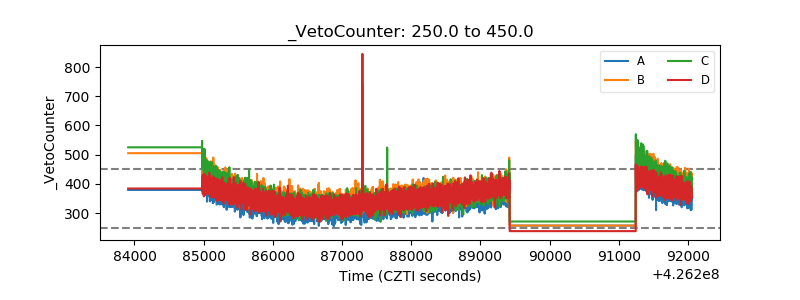 |