| Param | Original file | Final file |
|---|---|---|
| Filename | modeM0/AS1A12_011T26_9000005732_42009cztM0_level2.fits | modeM0/AS1A12_011T26_9000005732_42009cztM0_level2_quad_clean.evt |
| Size (bytes) | 306,164,160 | 93,219,840 |
| Size | 292.0 MB | 88.9 MB |
| Events in quadrant A | 2,985,227 | 622,204 |
| Events in quadrant B | 2,545,086 | 644,427 |
| Events in quadrant C | 2,542,792 | 616,896 |
| Events in quadrant D | 2,838,637 | 560,840 |
| Mode M0 | |||
|---|---|---|---|
| Quadrant | BADHDUFLAG | Total packets | Discarded packets |
| A | 0 | 12118 | 2 |
| B | 0 | 11254 | 2 |
| C | 0 | 10888 | 2 |
| D | 0 | 12154 | 2 |
| Mode M9 | |||
|---|---|---|---|
| Quadrant | BADHDUFLAG | Total packets | Discarded packets |
| A | 0 | 31 | 0 |
| B | 0 | 32 | 0 |
| C | 0 | 32 | 0 |
| D | 0 | 32 | 0 |
| Mode SS | |||
|---|---|---|---|
| Quadrant | BADHDUFLAG | Total packets | Discarded packets |
| A | 0 | 110 | 0 |
| B | 0 | 110 | 0 |
| C | 0 | 110 | 0 |
| D | 0 | 110 | 0 |
| Quadrant | Total seconds | Saturated seconds | Saturation percentage |
|---|---|---|---|
| A | 5405 | 16 | 0.296022% |
| B | 5405 | 15 | 0.277521% |
| C | 5405 | 5 | 0.092507% |
| D | 5405 | 68 | 1.258094% |
Noise dominated data is calculated using 1-second bins in cleaned event files. If a bin has >2000 counts, and if more than 50% of those come from <1% of pixels, then it is considered to be noise-dominated and hence unusable.
| Quadrant | # 1 sec bins | Bins with >0 counts | Bins with >2000 counts | High rate bins dominated by noise | Noise dominated (total time) | Noise dominated (detector-on time) | Marked lightcurve |
|---|---|---|---|---|---|---|---|
| A | 7347 | 5406 | 9 | 9 | 0.12% | 0.17% | 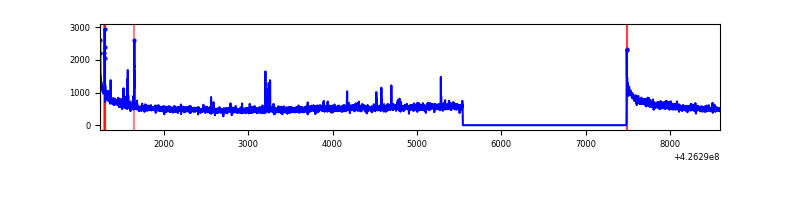 |
| B | 7347 | 5406 | 6 | 6 | 0.08% | 0.11% | 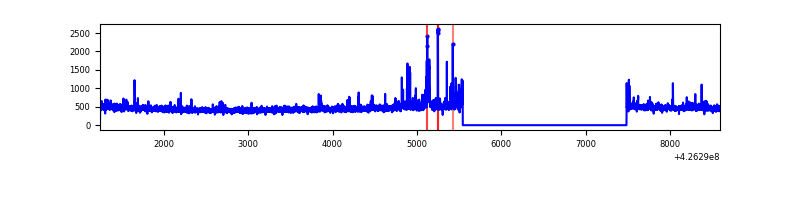 |
| C | 7347 | 5406 | 0 | 0 | 0.00% | 0.00% | 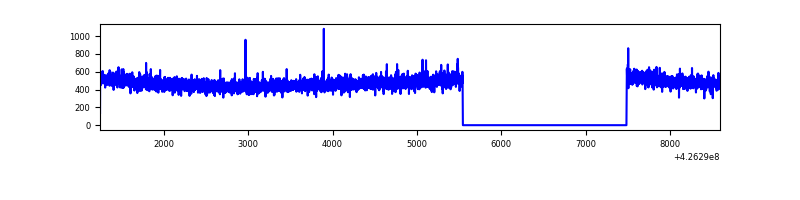 |
| D | 7347 | 5406 | 59 | 59 | 0.80% | 1.09% |  |
Top three noisy pixels from each quadrant. If the there are fewer than three noisy pixels in the level2.evt file, extra rows are filled as -1
| Pixel properties | Quadrant properties | ||||||
|---|---|---|---|---|---|---|---|
| Quadrant | DetID | PixID | Counts | Sigma | Mean | Median | Sigma |
| A | 10 | 83 | 538319 | 4369.17 | 600 | 590 | 123.1 |
| A | 12 | 189 | 54301 | 436.41 | 600 | 590 | 123.1 |
| A | 15 | 190 | 35097 | 280.38 | 600 | 590 | 123.1 |
| B | 4 | 171 | 97502 | 842.32 | 602 | 585 | 115.1 |
| B | 5 | 255 | 52827 | 454.04 | 602 | 585 | 115.1 |
| B | 0 | 190 | 15338 | 128.22 | 602 | 585 | 115.1 |
| C | 15 | 214 | 225385 | 1636.0 | 589 | 594 | 137.4 |
| C | 8 | 229 | 11288 | 77.83 | 589 | 594 | 137.4 |
| C | 8 | 79 | 6109 | 40.14 | 589 | 594 | 137.4 |
| D | 12 | 6 | 149198 | 1034.48 | 583 | 566 | 143.7 |
| D | 1 | 52 | 135745 | 940.85 | 583 | 566 | 143.7 |
| D | 13 | 249 | 124386 | 861.79 | 583 | 566 | 143.7 |
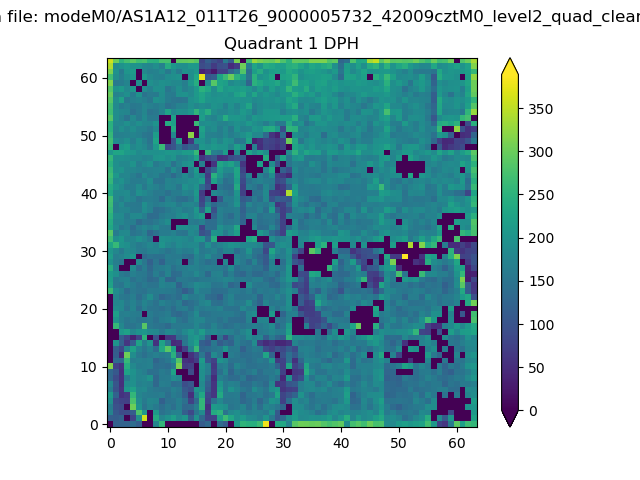
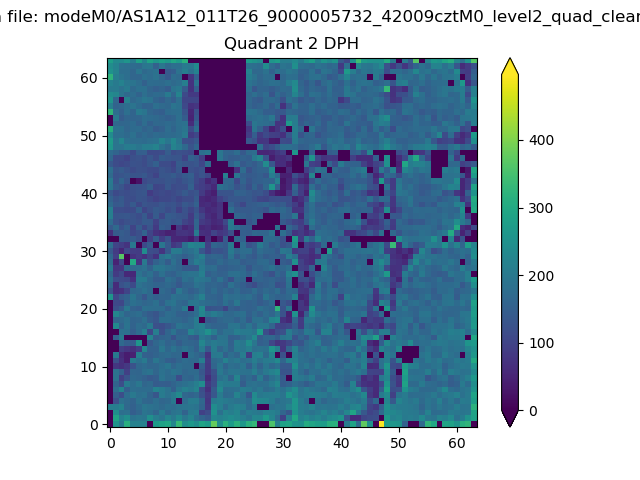
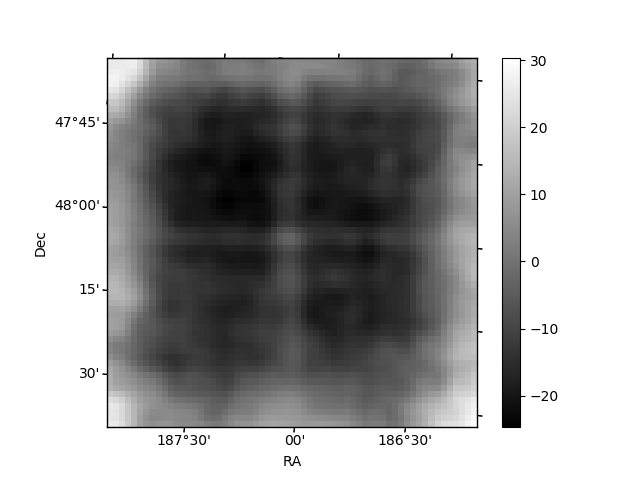
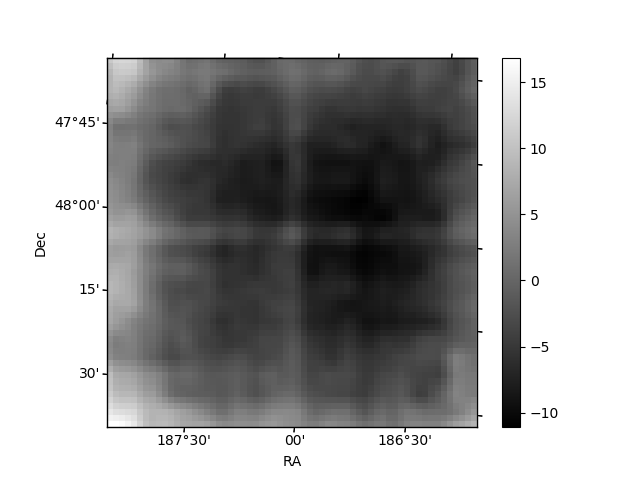
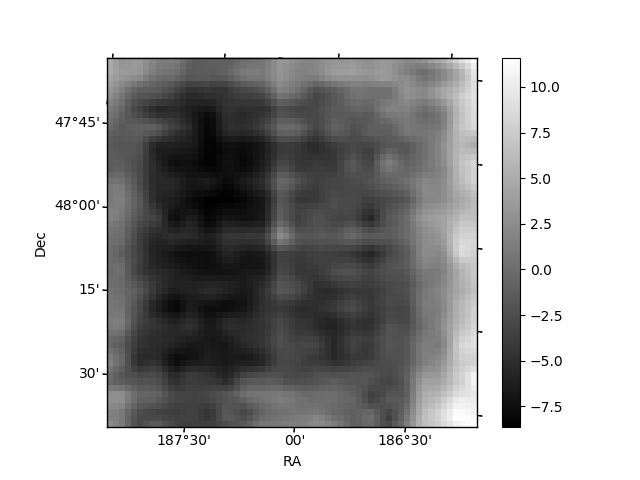
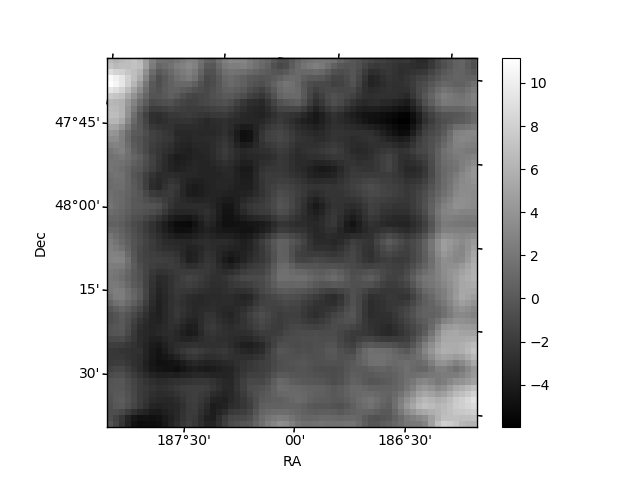
Histogram calculated using DETX and DETY for each event in the final _common_clean file
| Quadrant A | 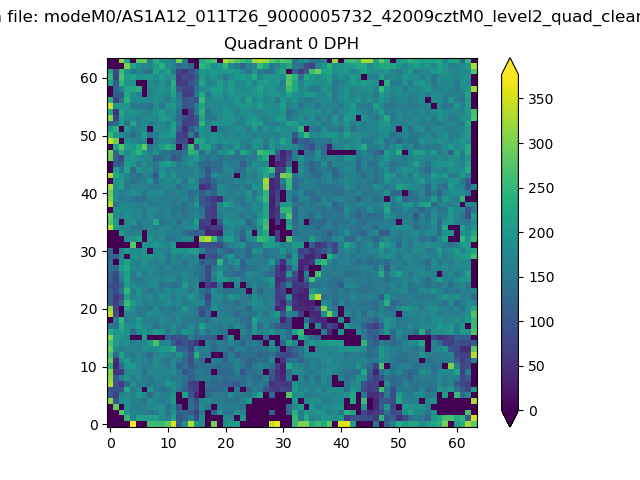 |
 |
Quadrant B |
|---|---|---|---|
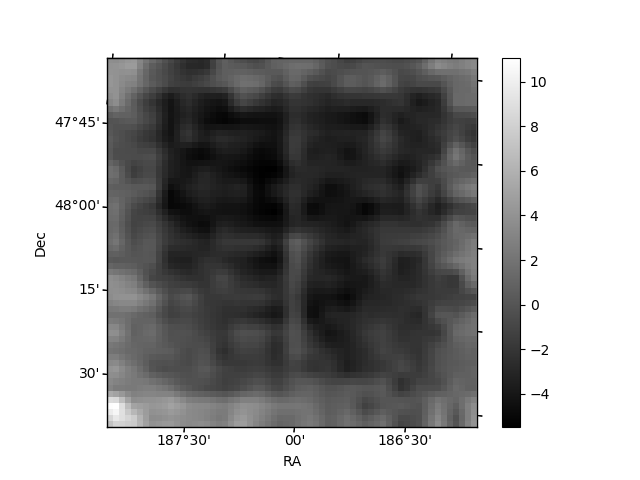
| Quadrant D | 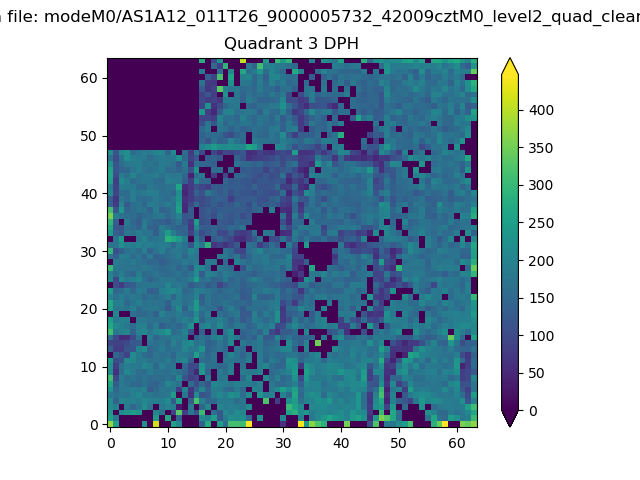 |
 |
Quadrant C |
| Plot type | Count rate plots | Images |
|---|---|---|
| Comparison with Poisson distribution Blue bars denote a histogram of data divided into 1 sec bins. Red curve is a Poisson curve with rate = median count rate of data. |
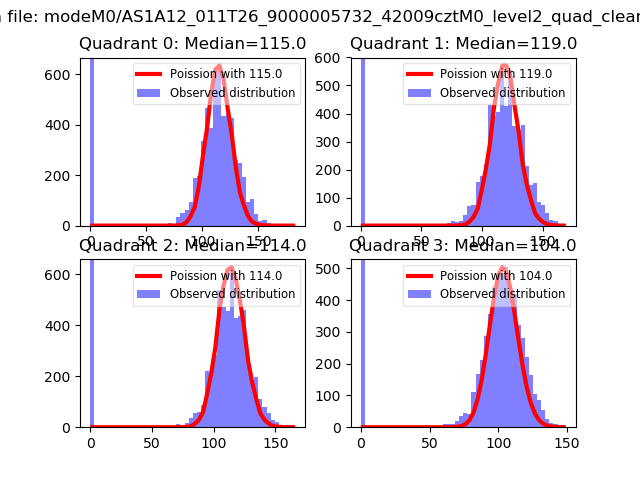 |
 |
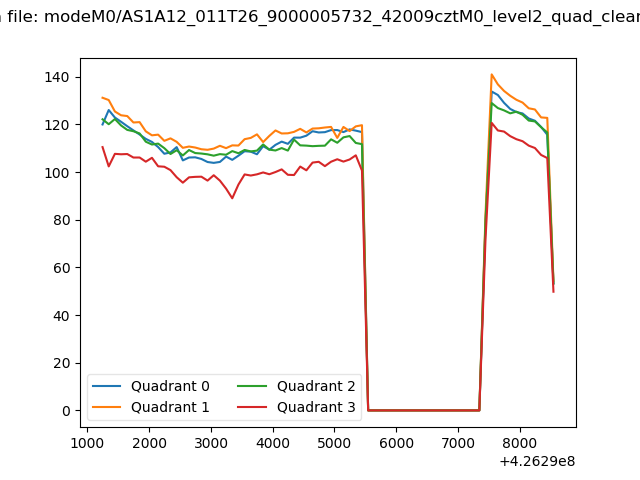
| Quadrant-wise count rates Data is divided into 100 sec bins |
 |
|
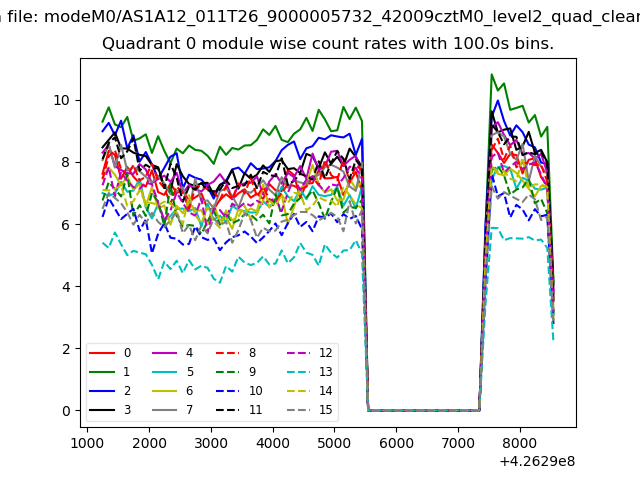
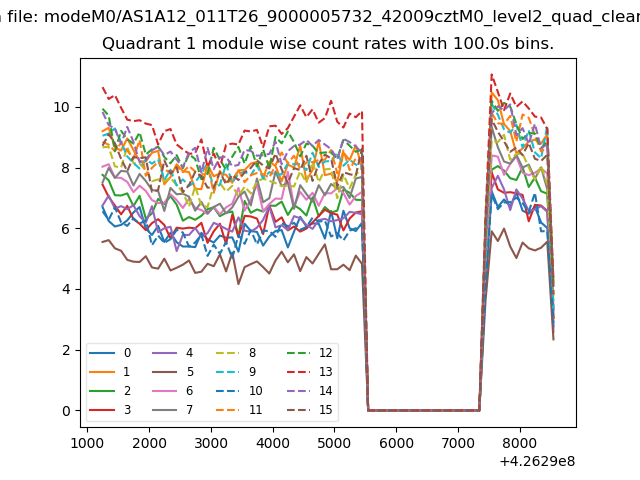
| Module-wise count rates for Quadrant A Data is divided into 100 sec bins |
 |
 |
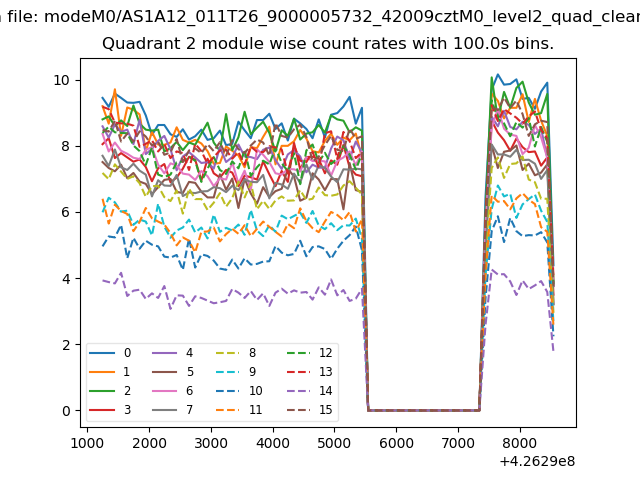
| Module-wise count rates for Quadrant B Data is divided into 100 sec bins |
 |
 |
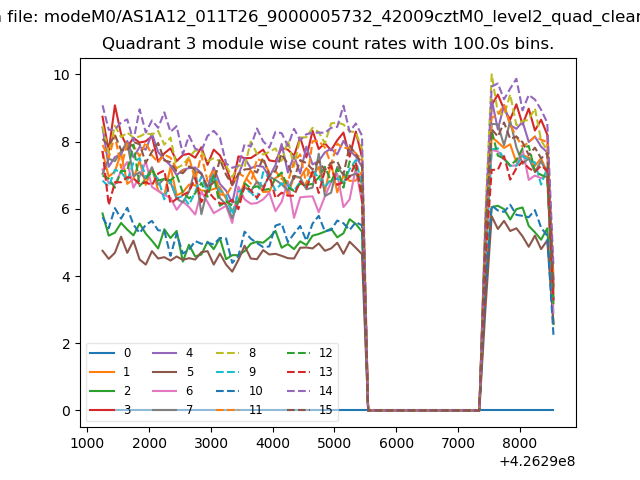
| Module-wise count rates for Quadrant C Data is divided into 100 sec bins |
 |
 |
| Module-wise count rates for Quadrant D Data is divided into 100 sec bins |
 |
 |
| Parameter | Plot |
|---|---|
| CZT HV Monitor | 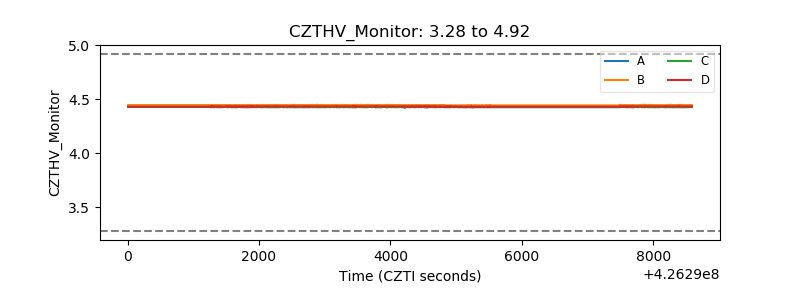 |
| D_VDD | 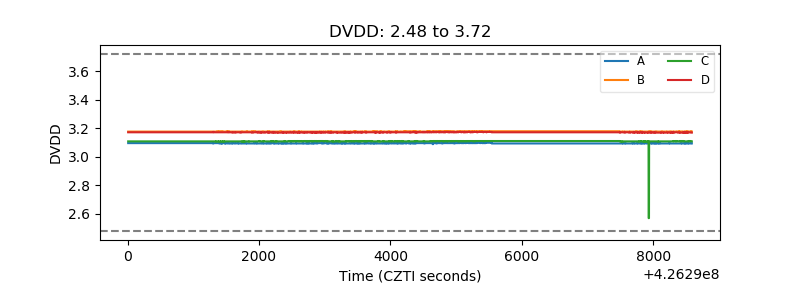 |
| Temperature 1 | 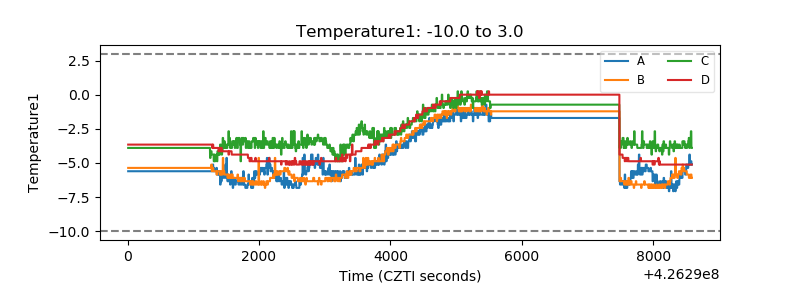 |
| Veto HV Monitor | 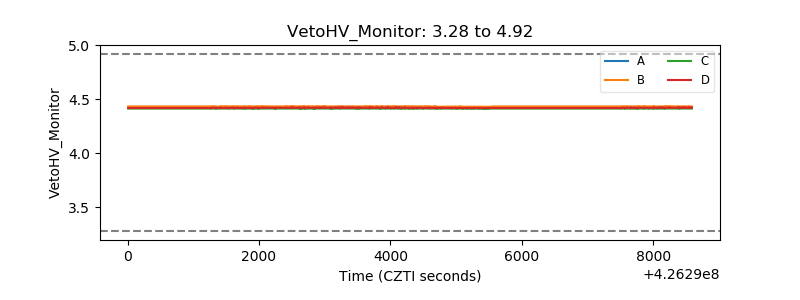 |
| Veto LLD | 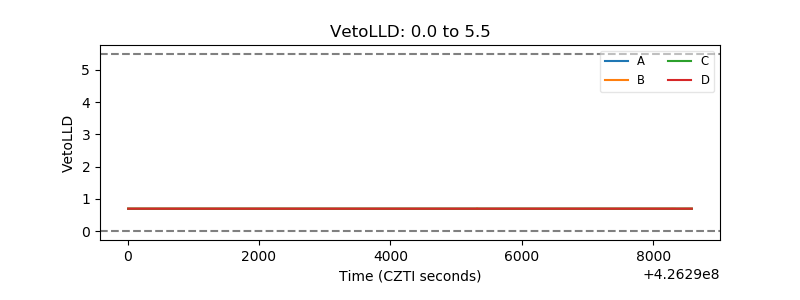 |
| Alpha Counter | 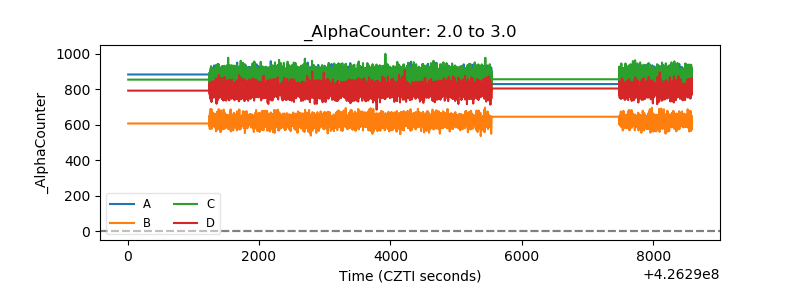 |
| _CPM_Rate | 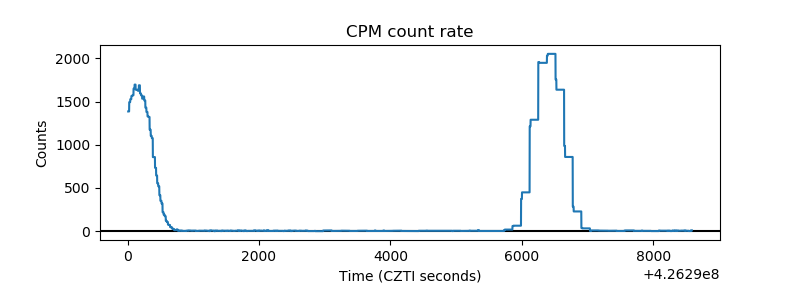 |
| CZT Counter | 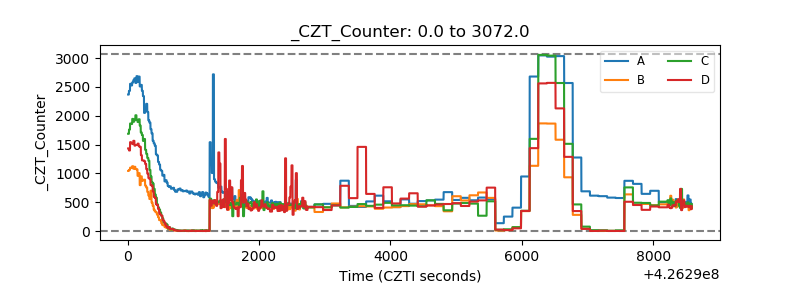 |
| +2.5 Volts monitor | 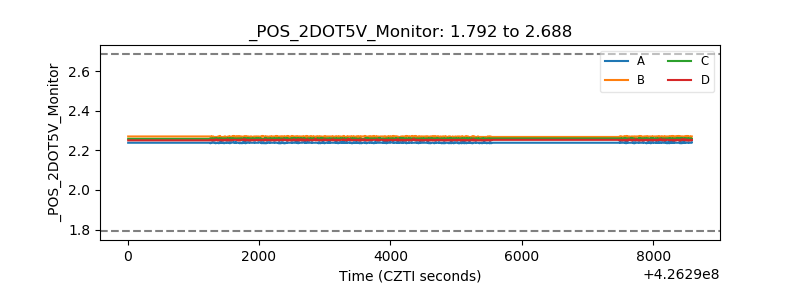 |
| +5 Volts monitor | 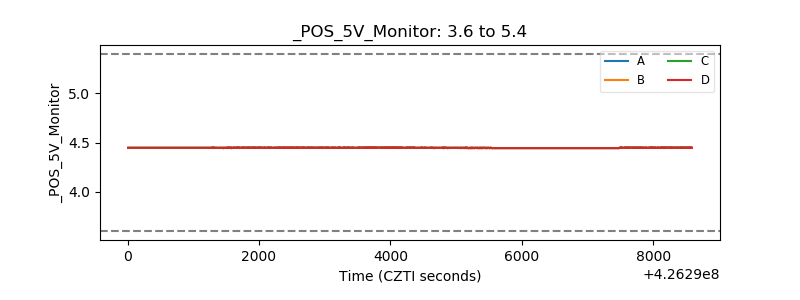 |
| _ROLL_ROT | 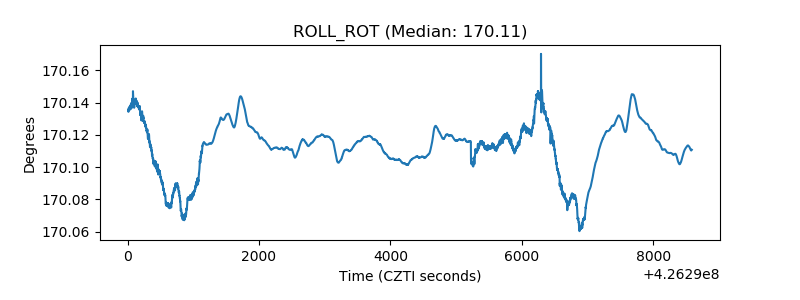 |
| _Roll_DEC | 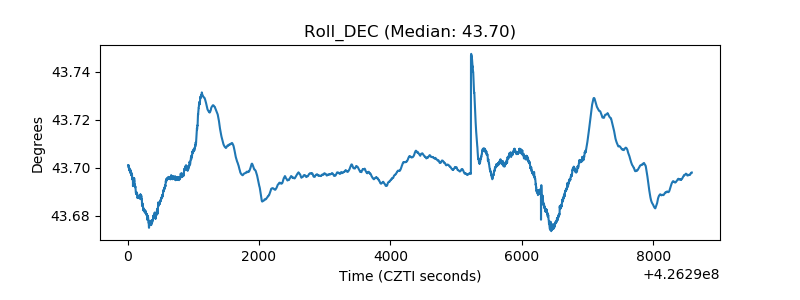 |
| _Roll_RA | 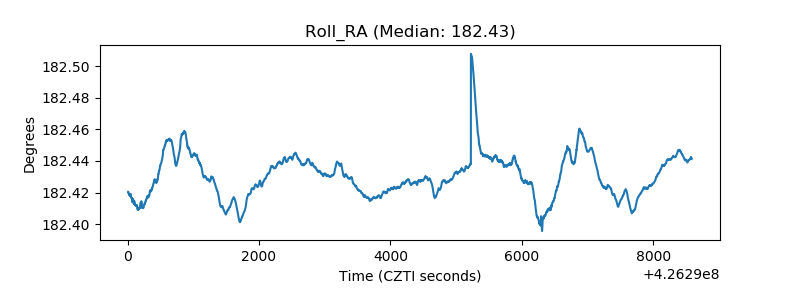 |
| Veto Counter | 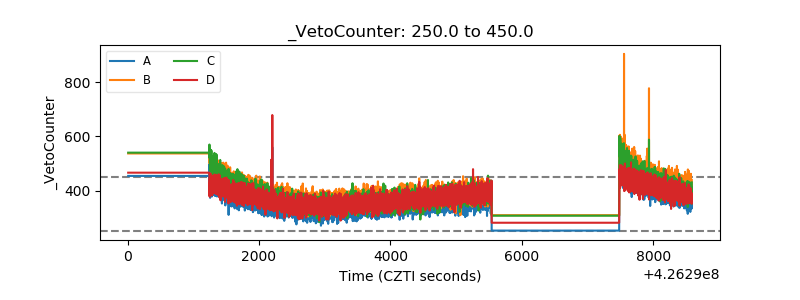 |