| Param | Original file | Final file |
|---|---|---|
| Filename | modeM0/AS1A12_011T26_9000005732_42010cztM0_level2.fits | modeM0/AS1A12_011T26_9000005732_42010cztM0_level2_quad_clean.evt |
| Size (bytes) | 356,518,080 | 88,937,280 |
| Size | 340.0 MB | 84.8 MB |
| Events in quadrant A | 2,906,870 | 616,730 |
| Events in quadrant B | 3,506,227 | 594,078 |
| Events in quadrant C | 2,457,877 | 609,021 |
| Events in quadrant D | 3,925,104 | 512,649 |
| Mode M0 | |||
|---|---|---|---|
| Quadrant | BADHDUFLAG | Total packets | Discarded packets |
| A | 0 | 11727 | 1 |
| B | 0 | 13748 | 1 |
| C | 0 | 10363 | 1 |
| D | 0 | 15195 | 1 |
| Mode M9 | |||
|---|---|---|---|
| Quadrant | BADHDUFLAG | Total packets | Discarded packets |
| A | 0 | 20 | 0 |
| B | 0 | 20 | 0 |
| C | 0 | 20 | 0 |
| D | 0 | 20 | 0 |
| Mode SS | |||
|---|---|---|---|
| Quadrant | BADHDUFLAG | Total packets | Discarded packets |
| A | 0 | 104 | 0 |
| B | 0 | 104 | 0 |
| C | 0 | 104 | 0 |
| D | 0 | 104 | 0 |
| Quadrant | Total seconds | Saturated seconds | Saturation percentage |
|---|---|---|---|
| A | 5149 | 8 | 0.155370% |
| B | 5150 | 409 | 7.941748% |
| C | 5150 | 1 | 0.019417% |
| D | 5150 | 453 | 8.796117% |
Noise dominated data is calculated using 1-second bins in cleaned event files. If a bin has >2000 counts, and if more than 50% of those come from <1% of pixels, then it is considered to be noise-dominated and hence unusable.
| Quadrant | # 1 sec bins | Bins with >0 counts | Bins with >2000 counts | High rate bins dominated by noise | Noise dominated (total time) | Noise dominated (detector-on time) | Marked lightcurve |
|---|---|---|---|---|---|---|---|
| A | 7181 | 5150 | 2 | 2 | 0.03% | 0.04% | 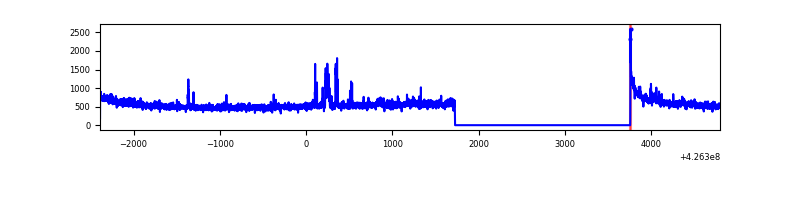 |
| B | 7182 | 5151 | 360 | 360 | 5.01% | 6.99% | 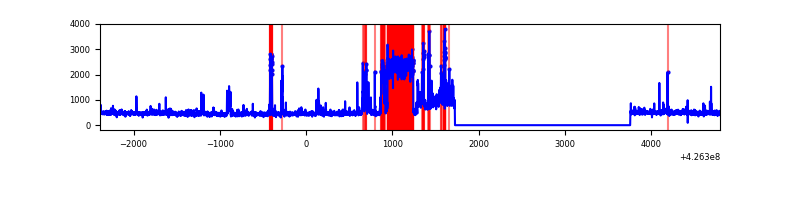 |
| C | 7182 | 5151 | 0 | 0 | 0.00% | 0.00% | 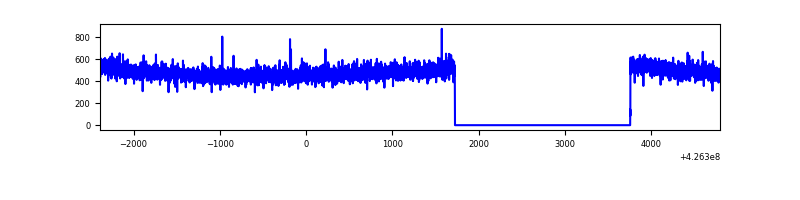 |
| D | 7182 | 5151 | 376 | 376 | 5.24% | 7.30% | 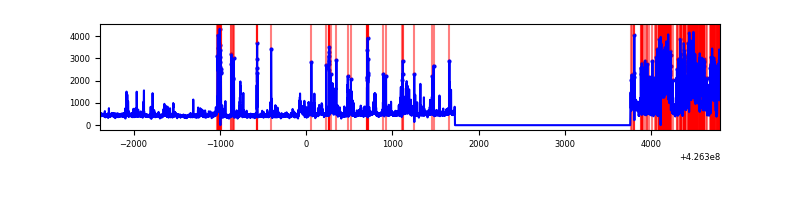 |
Top three noisy pixels from each quadrant. If the there are fewer than three noisy pixels in the level2.evt file, extra rows are filled as -1
| Pixel properties | Quadrant properties | ||||||
|---|---|---|---|---|---|---|---|
| Quadrant | DetID | PixID | Counts | Sigma | Mean | Median | Sigma |
| A | 10 | 83 | 483212 | 4050.17 | 589 | 577 | 119.2 |
| A | 12 | 189 | 117141 | 978.18 | 589 | 577 | 119.2 |
| A | 7 | 3 | 15687 | 126.8 | 589 | 577 | 119.2 |
| B | 0 | 186 | 918659 | 8269.45 | 577 | 563 | 111.0 |
| B | 5 | 255 | 144765 | 1298.85 | 577 | 563 | 111.0 |
| B | 4 | 171 | 89344 | 799.67 | 577 | 563 | 111.0 |
| C | 15 | 214 | 214947 | 1605.86 | 574 | 578 | 133.5 |
| C | 13 | 61 | 3876 | 24.71 | 574 | 578 | 133.5 |
| C | 3 | 233 | 2544 | 14.73 | 574 | 578 | 133.5 |
| D | 2 | 249 | 1184281 | 8732.99 | 551 | 533 | 135.5 |
| D | 13 | 249 | 301808 | 2222.63 | 551 | 533 | 135.5 |
| D | 1 | 52 | 84057 | 616.19 | 551 | 533 | 135.5 |
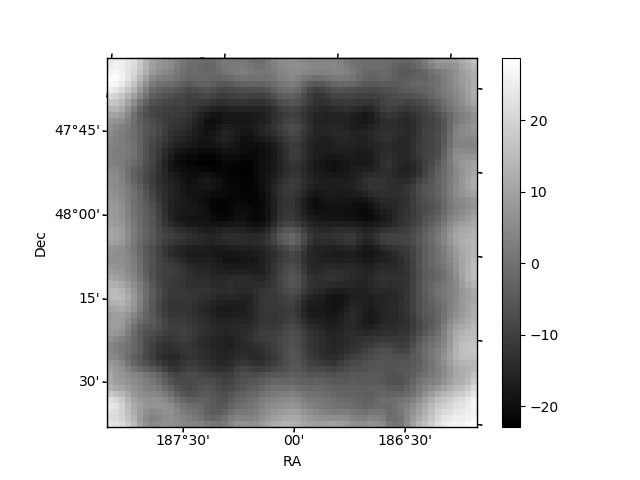
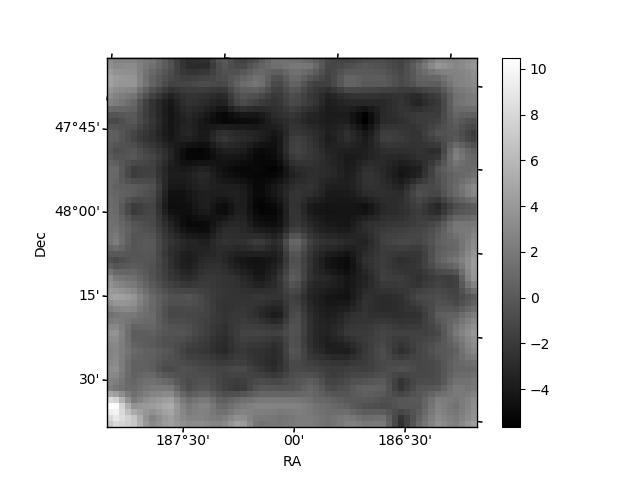
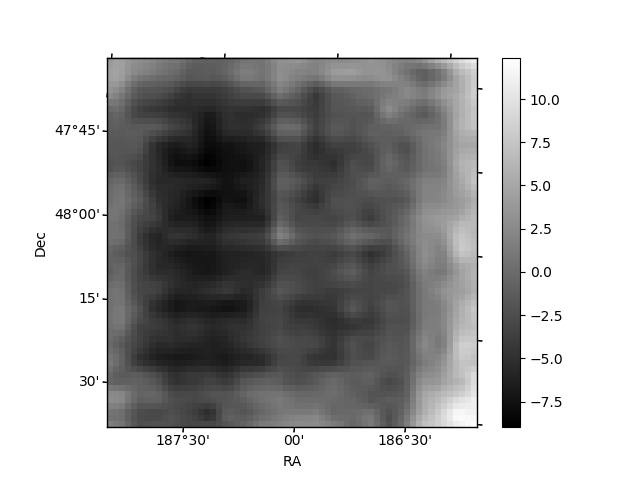
Histogram calculated using DETX and DETY for each event in the final _common_clean file
| Quadrant A | 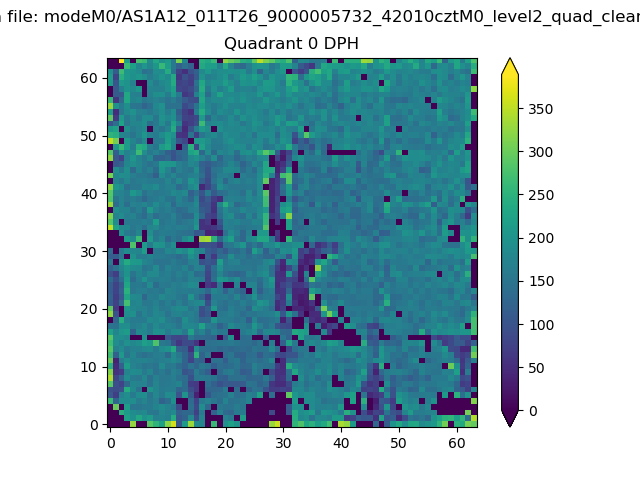 |
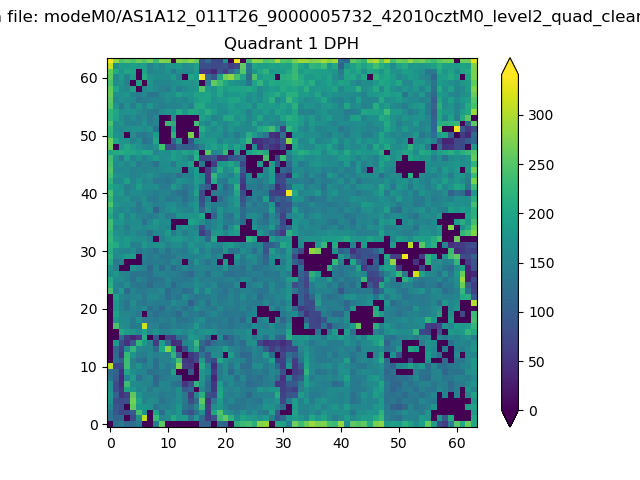 |
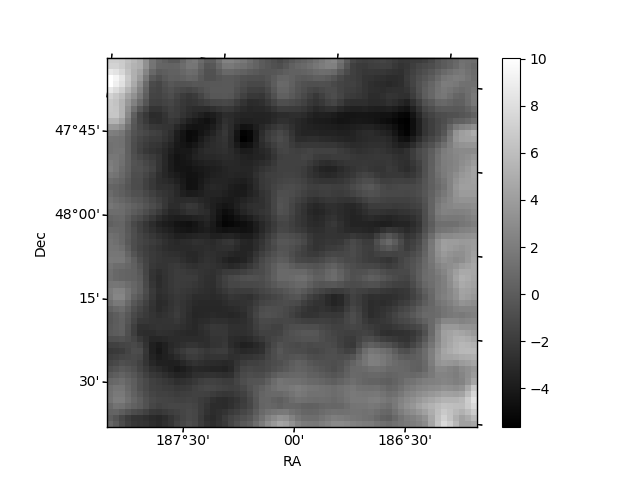
Quadrant B |
|---|---|---|---|
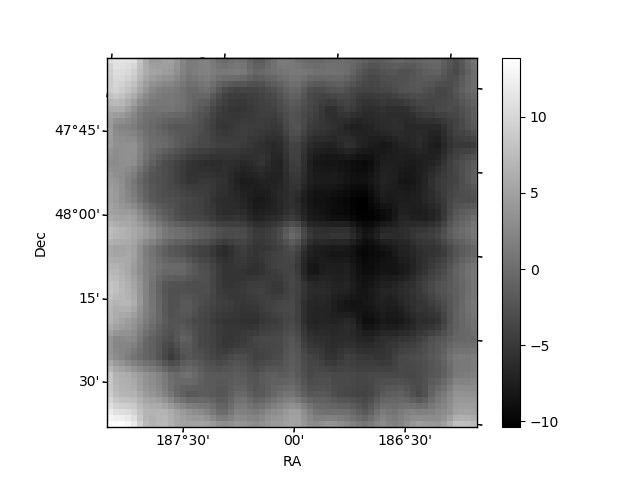
| Quadrant D | 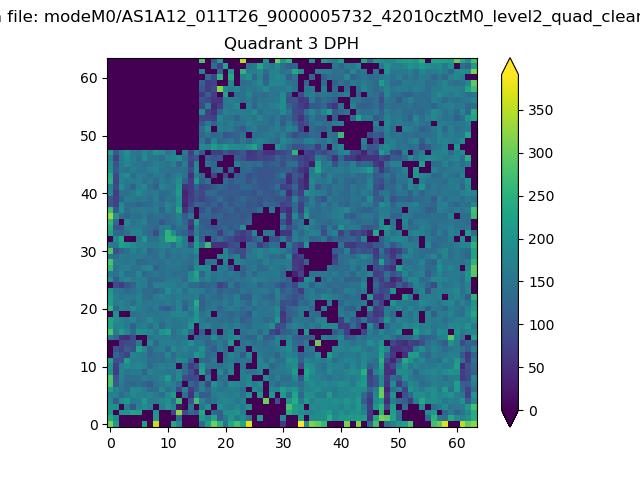 |
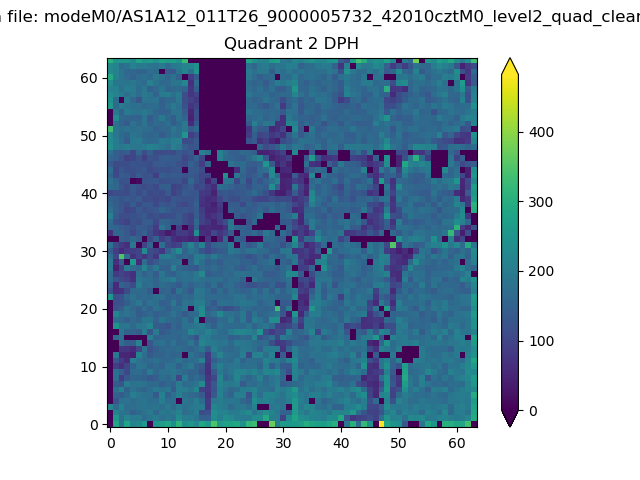 |
Quadrant C |
| Plot type | Count rate plots | Images |
|---|---|---|
| Comparison with Poisson distribution Blue bars denote a histogram of data divided into 1 sec bins. Red curve is a Poisson curve with rate = median count rate of data. |
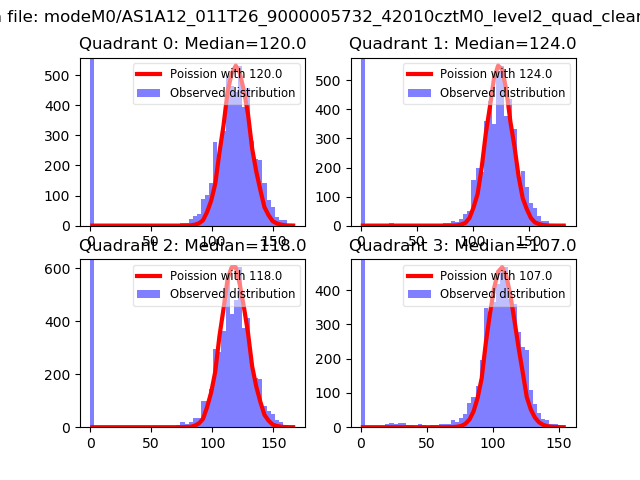 |
 |
| Quadrant-wise count rates Data is divided into 100 sec bins |
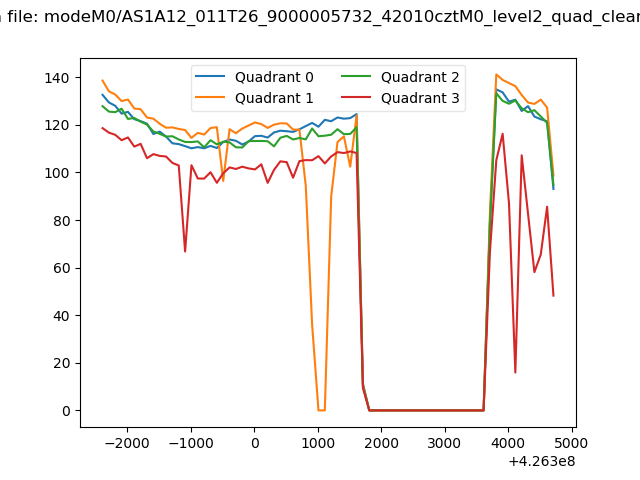 |
|
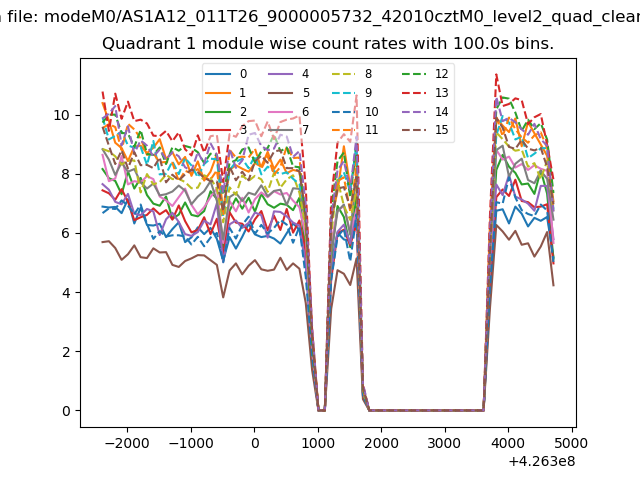
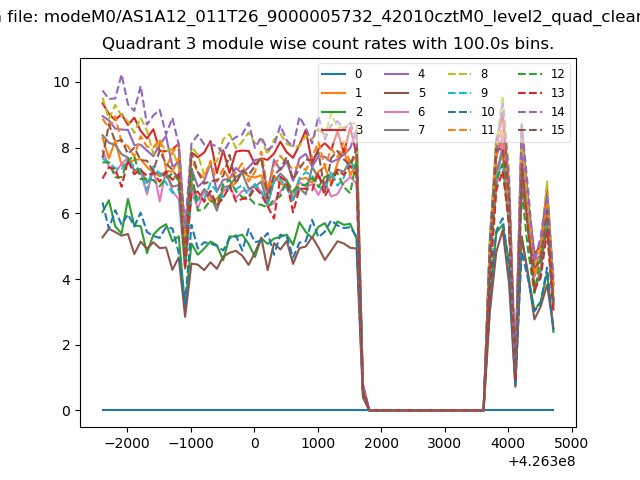
| Module-wise count rates for Quadrant A Data is divided into 100 sec bins |
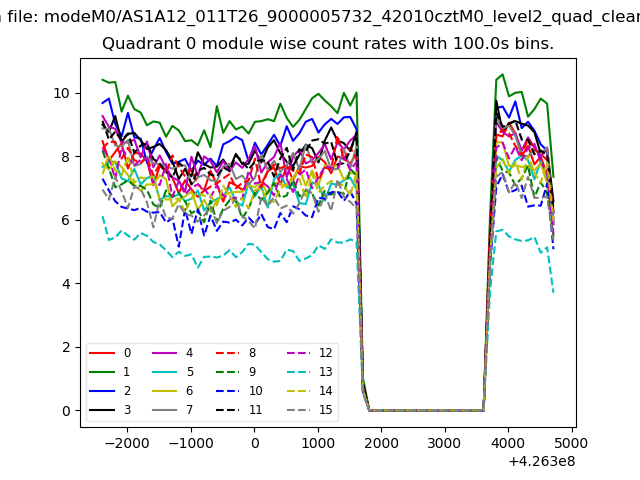 |
 |
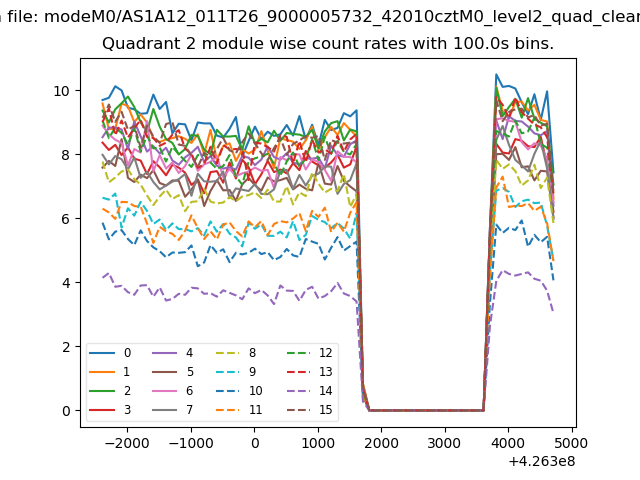
| Module-wise count rates for Quadrant B Data is divided into 100 sec bins |
 |
 |
| Module-wise count rates for Quadrant C Data is divided into 100 sec bins |
 |
 |
| Module-wise count rates for Quadrant D Data is divided into 100 sec bins |
 |
 |
| Parameter | Plot |
|---|---|
| CZT HV Monitor | 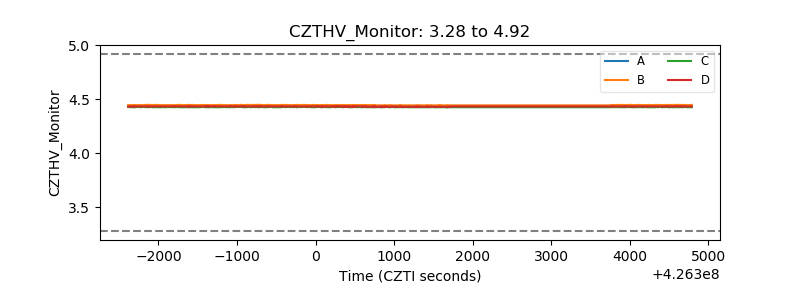 |
| D_VDD | 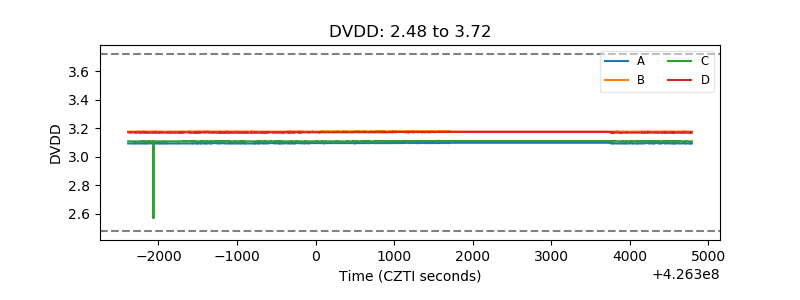 |
| Temperature 1 | 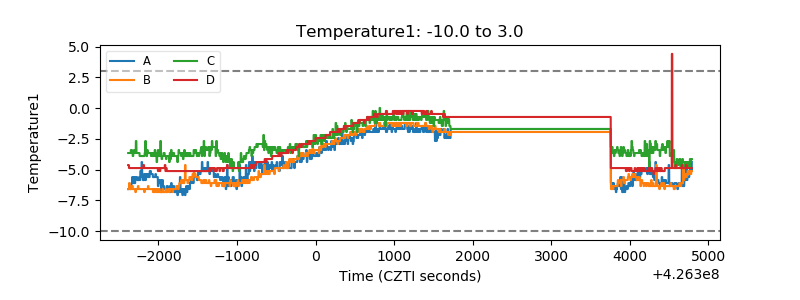 |
| Veto HV Monitor | 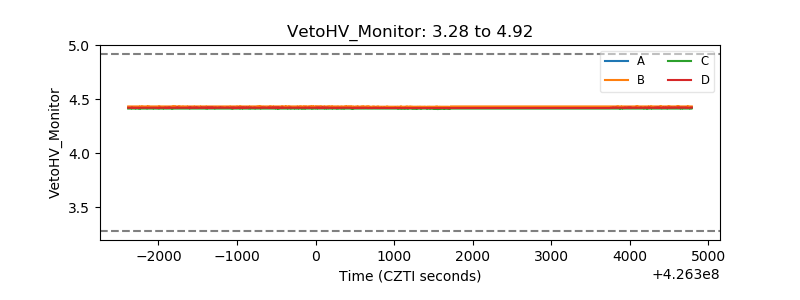 |
| Veto LLD | 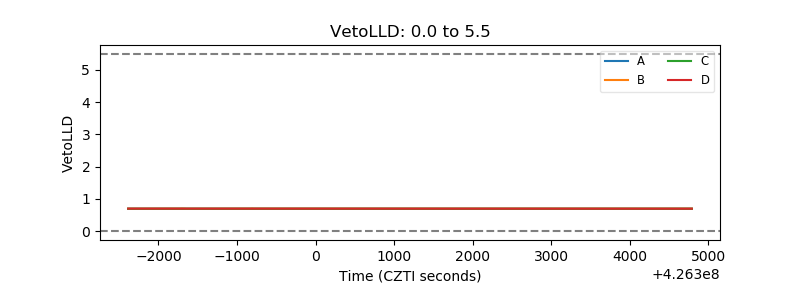 |
| Alpha Counter | 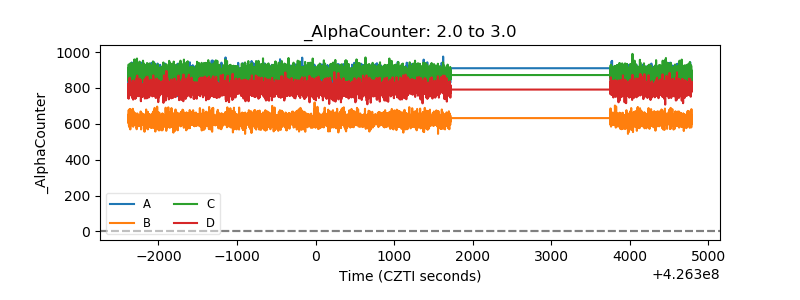 |
| _CPM_Rate | 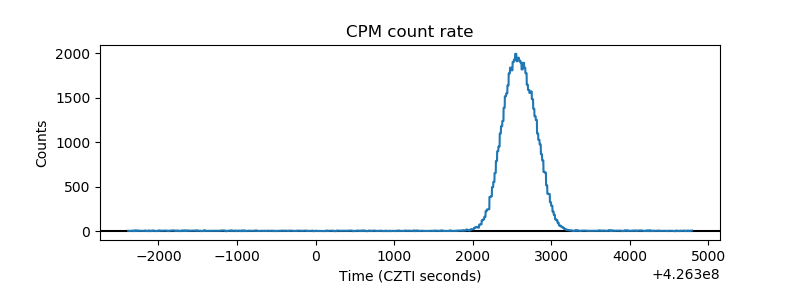 |
| CZT Counter | 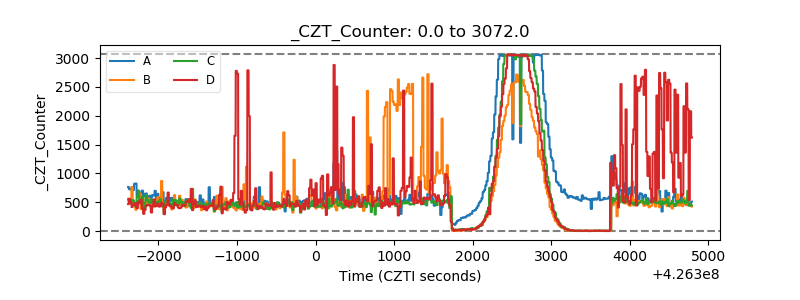 |
| +2.5 Volts monitor |  |
| +5 Volts monitor | 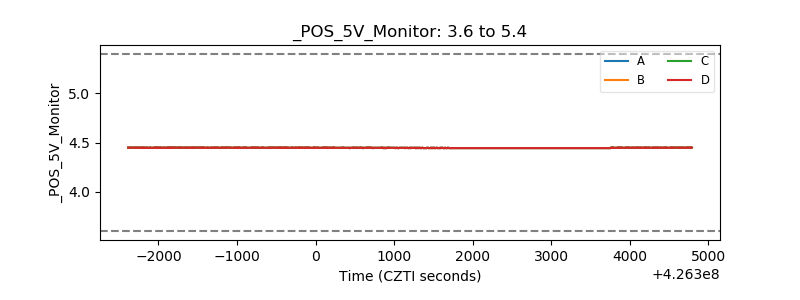 |
| _ROLL_ROT | 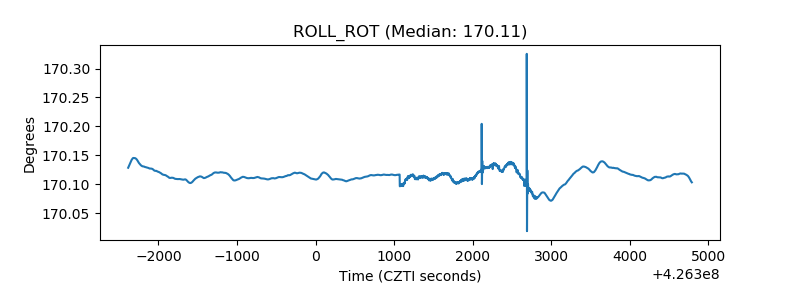 |
| _Roll_DEC | 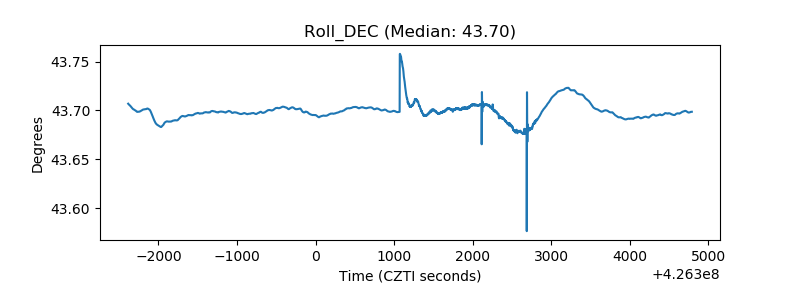 |
| _Roll_RA | 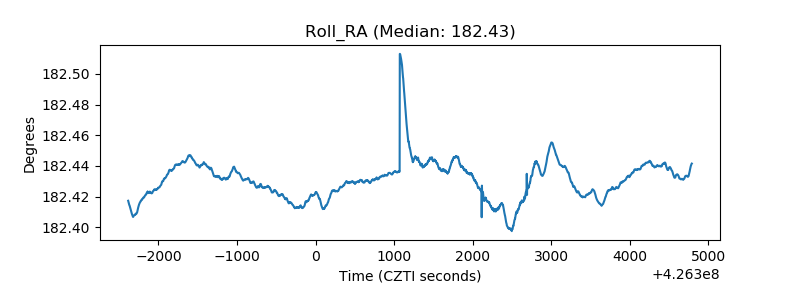 |
| Veto Counter | 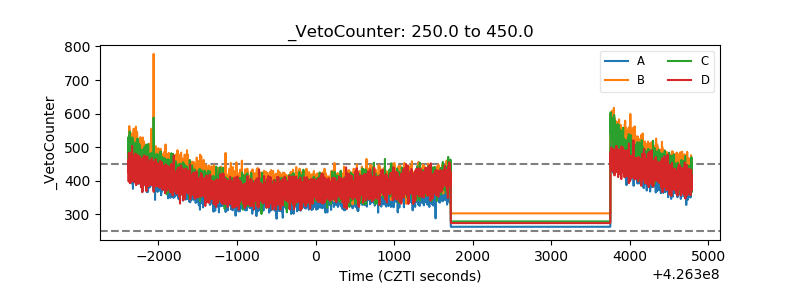 |