| Param | Original file | Final file |
|---|---|---|
| Filename | modeM0/AS1A12_011T26_9000005732_42011cztM0_level2.fits | modeM0/AS1A12_011T26_9000005732_42011cztM0_level2_quad_clean.evt |
| Size (bytes) | 356,270,400 | 86,644,800 |
| Size | 339.8 MB | 82.6 MB |
| Events in quadrant A | 2,898,390 | 600,027 |
| Events in quadrant B | 2,643,455 | 614,018 |
| Events in quadrant C | 2,400,045 | 592,842 |
| Events in quadrant D | 4,859,119 | 468,974 |
| Mode M0 | |||
|---|---|---|---|
| Quadrant | BADHDUFLAG | Total packets | Discarded packets |
| A | 0 | 11561 | 3 |
| B | 0 | 11015 | 2 |
| C | 0 | 10033 | 2 |
| D | 0 | 17756 | 2 |
| Mode M9 | |||
|---|---|---|---|
| Quadrant | BADHDUFLAG | Total packets | Discarded packets |
| A | 0 | 29 | 0 |
| B | 0 | 29 | 0 |
| C | 0 | 29 | 0 |
| D | 0 | 30 | 0 |
| Mode SS | |||
|---|---|---|---|
| Quadrant | BADHDUFLAG | Total packets | Discarded packets |
| A | 0 | 100 | 0 |
| B | 0 | 100 | 0 |
| C | 0 | 100 | 0 |
| D | 0 | 100 | 0 |
| Quadrant | Total seconds | Saturated seconds | Saturation percentage |
|---|---|---|---|
| A | 4966 | 10 | 0.201369% |
| B | 4966 | 100 | 2.013693% |
| C | 4966 | 4 | 0.080548% |
| D | 4966 | 771 | 15.525574% |
Noise dominated data is calculated using 1-second bins in cleaned event files. If a bin has >2000 counts, and if more than 50% of those come from <1% of pixels, then it is considered to be noise-dominated and hence unusable.
| Quadrant | # 1 sec bins | Bins with >0 counts | Bins with >2000 counts | High rate bins dominated by noise | Noise dominated (total time) | Noise dominated (detector-on time) | Marked lightcurve |
|---|---|---|---|---|---|---|---|
| A | 7089 | 4967 | 4 | 4 | 0.06% | 0.08% | 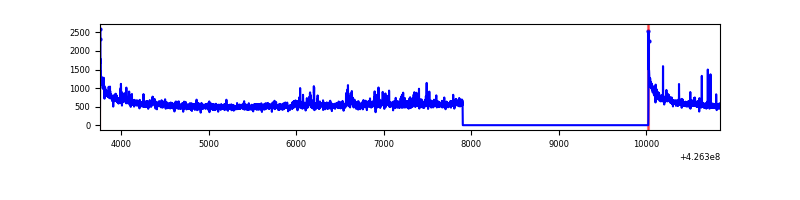 |
| B | 7089 | 4967 | 89 | 89 | 1.26% | 1.79% | 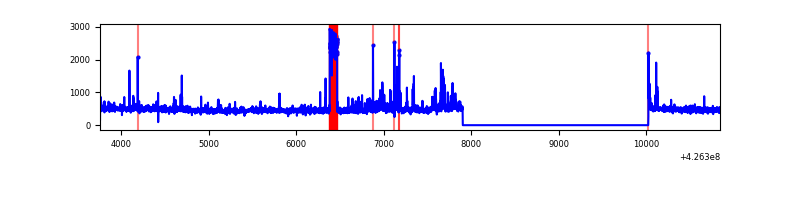 |
| C | 7089 | 4967 | 0 | 0 | 0.00% | 0.00% | 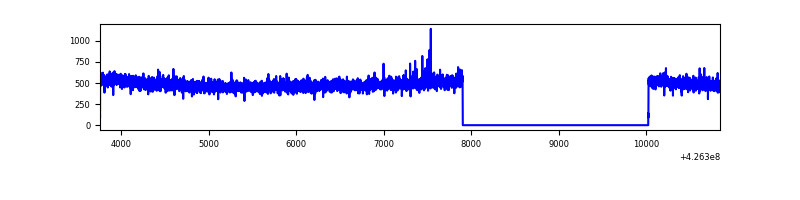 |
| D | 7089 | 4967 | 656 | 656 | 9.25% | 13.21% | 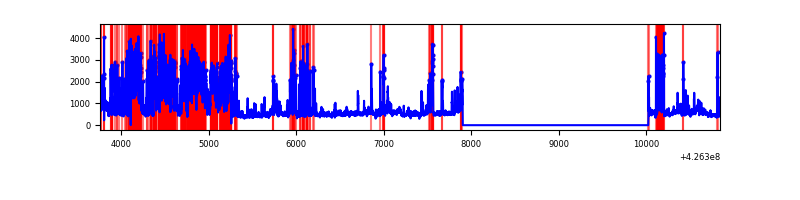 |
Top three noisy pixels from each quadrant. If the there are fewer than three noisy pixels in the level2.evt file, extra rows are filled as -1
| Pixel properties | Quadrant properties | ||||||
|---|---|---|---|---|---|---|---|
| Quadrant | DetID | PixID | Counts | Sigma | Mean | Median | Sigma |
| A | 10 | 83 | 541153 | 4585.36 | 576 | 564 | 117.9 |
| A | 12 | 189 | 64311 | 540.71 | 576 | 564 | 117.9 |
| A | 15 | 223 | 54000 | 453.25 | 576 | 564 | 117.9 |
| B | 0 | 186 | 190657 | 1732.86 | 571 | 556 | 109.7 |
| B | 0 | 190 | 107361 | 973.58 | 571 | 556 | 109.7 |
| B | 4 | 171 | 51161 | 461.29 | 571 | 556 | 109.7 |
| C | 15 | 214 | 211807 | 1636.26 | 557 | 561 | 129.1 |
| C | 15 | 111 | 8707 | 63.1 | 557 | 561 | 129.1 |
| C | 13 | 61 | 3716 | 24.44 | 557 | 561 | 129.1 |
| D | 2 | 249 | 1868958 | 14637.94 | 523 | 509 | 127.6 |
| D | 13 | 249 | 526399 | 4119.97 | 523 | 509 | 127.6 |
| D | 1 | 52 | 245609 | 1920.18 | 523 | 509 | 127.6 |
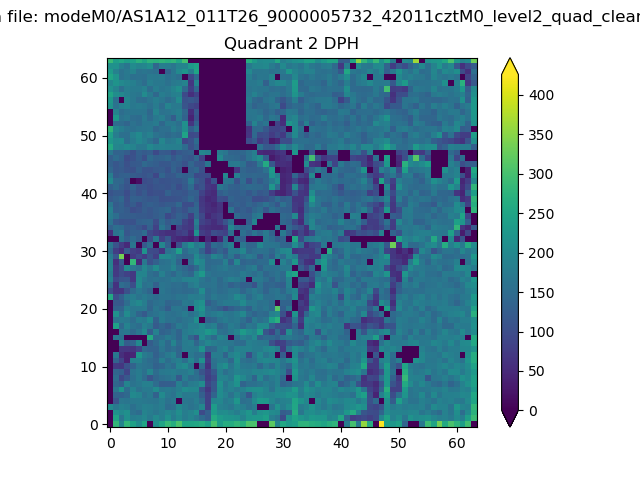
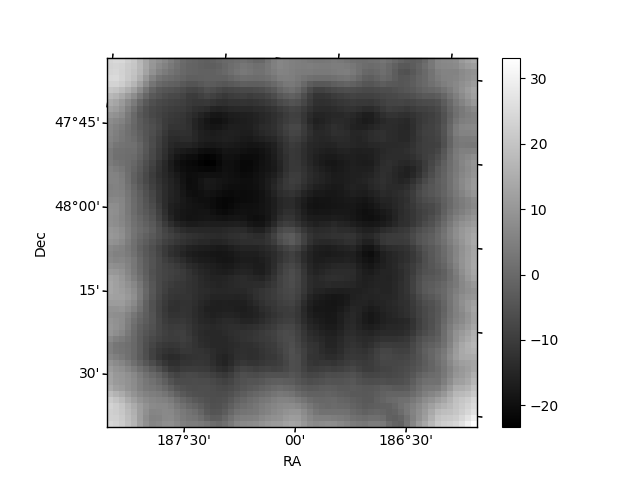
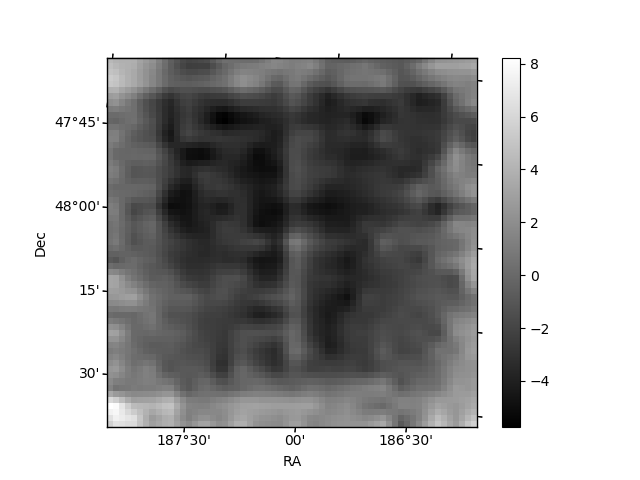
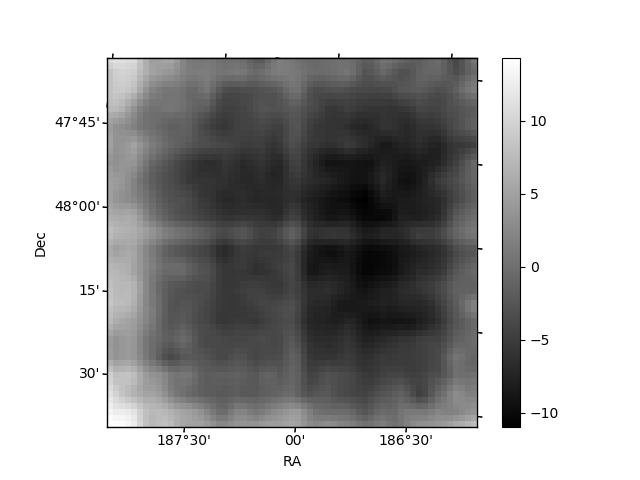
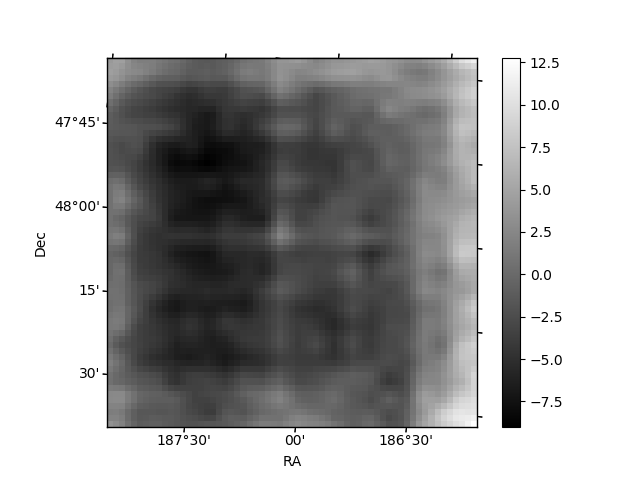
Histogram calculated using DETX and DETY for each event in the final _common_clean file
| Quadrant A | 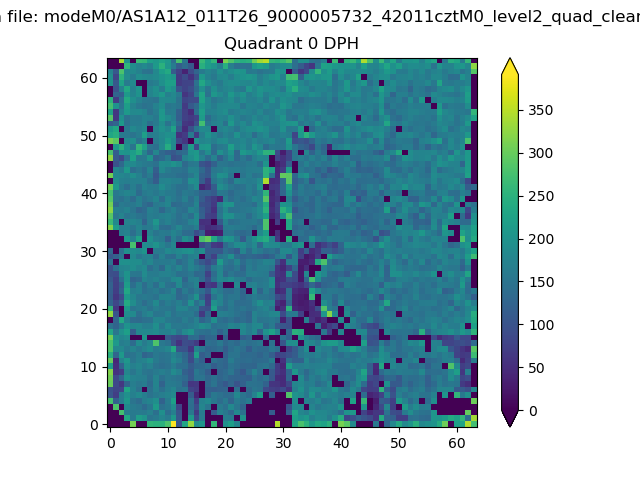 |
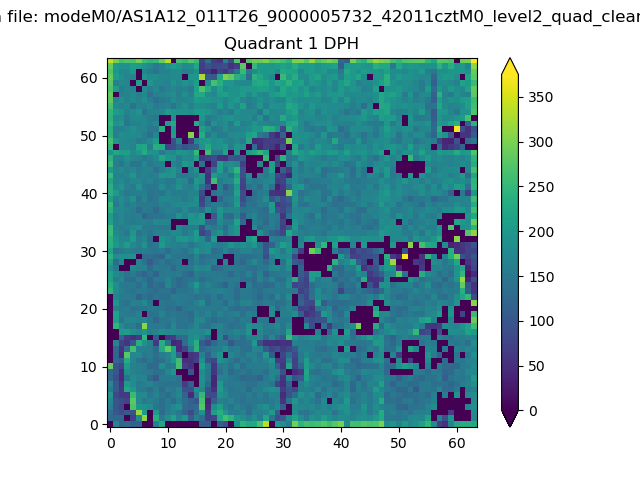 |
Quadrant B |
|---|---|---|---|
| Quadrant D | 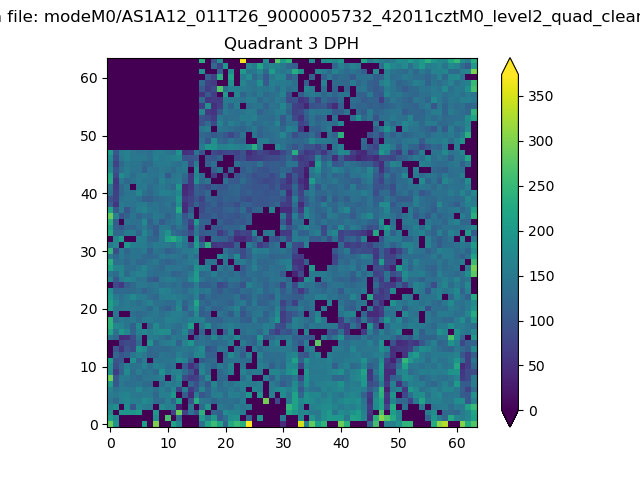 |
 |
Quadrant C |
| Plot type | Count rate plots | Images |
|---|---|---|
| Comparison with Poisson distribution Blue bars denote a histogram of data divided into 1 sec bins. Red curve is a Poisson curve with rate = median count rate of data. |
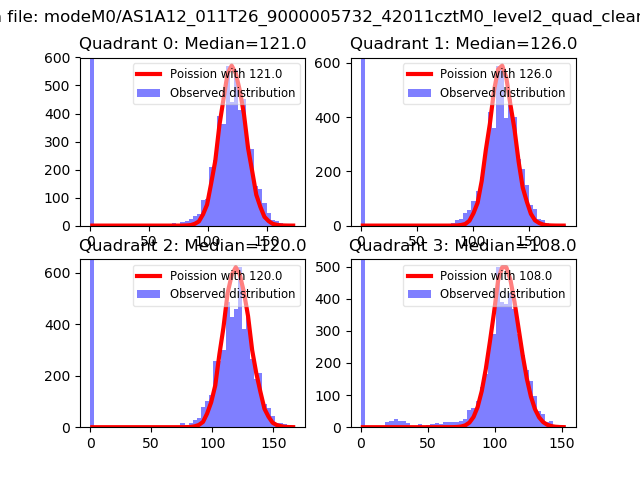 |
 |
| Quadrant-wise count rates Data is divided into 100 sec bins |
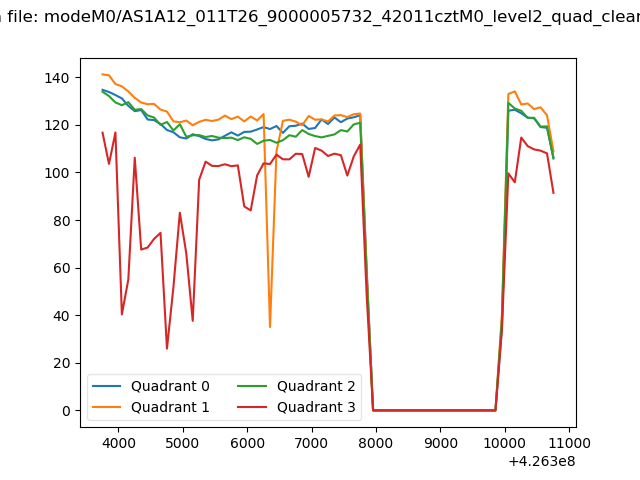 |
|
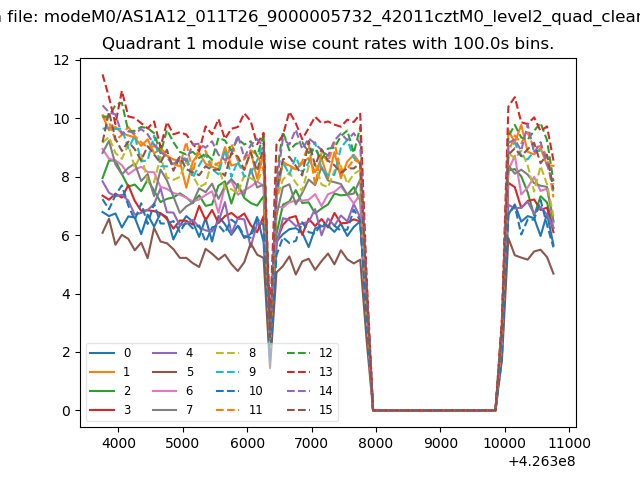
| Module-wise count rates for Quadrant A Data is divided into 100 sec bins |
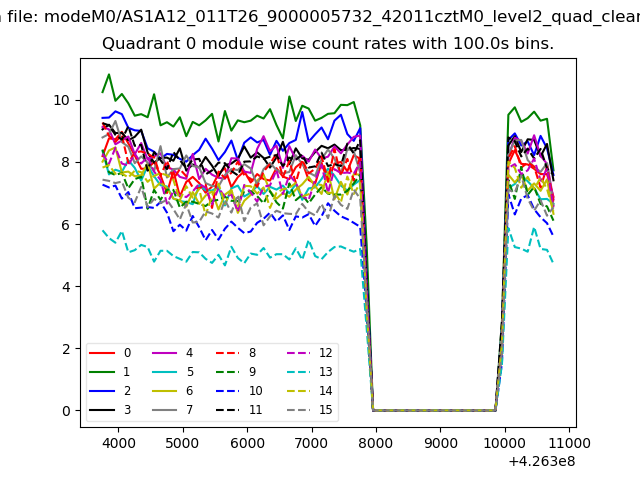 |
 |
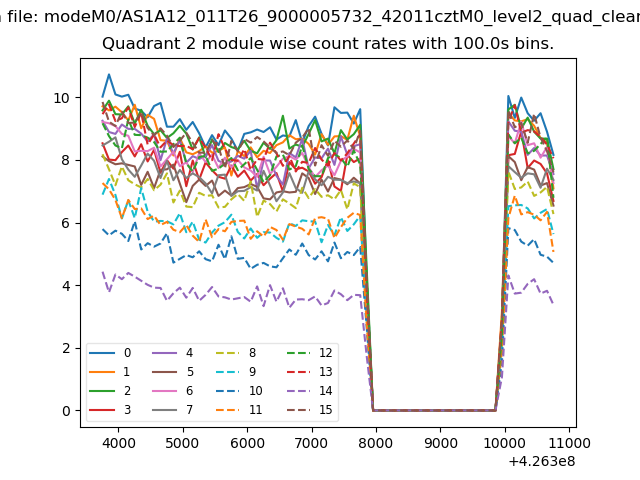
| Module-wise count rates for Quadrant B Data is divided into 100 sec bins |
 |
 |
| Module-wise count rates for Quadrant C Data is divided into 100 sec bins |
 |
 |
| Module-wise count rates for Quadrant D Data is divided into 100 sec bins |
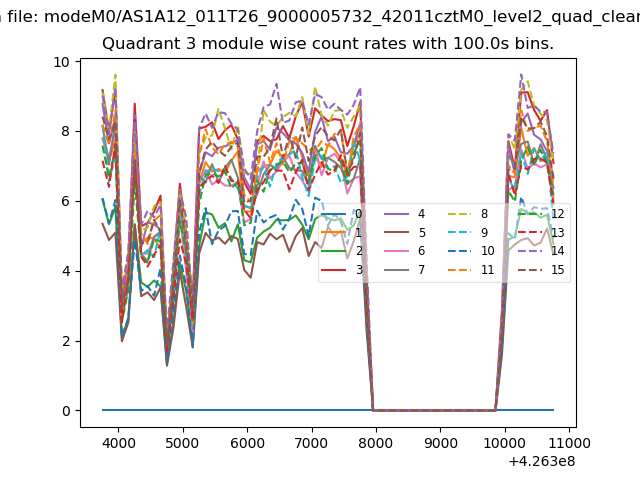 |
 |
| Parameter | Plot |
|---|---|
| CZT HV Monitor | 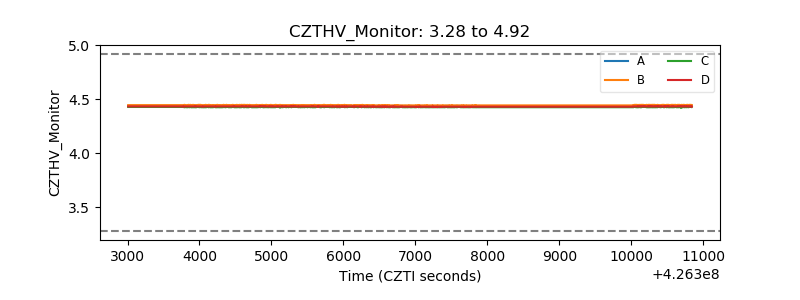 |
| D_VDD | 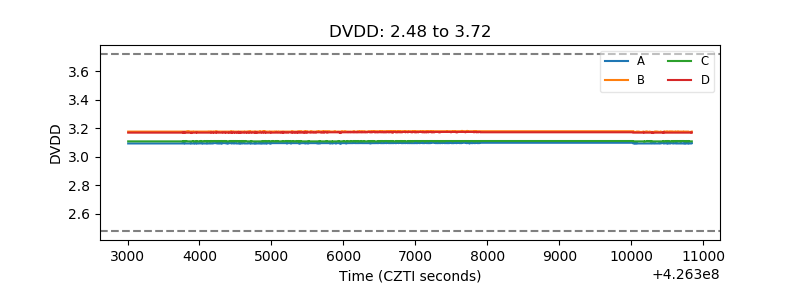 |
| Temperature 1 | 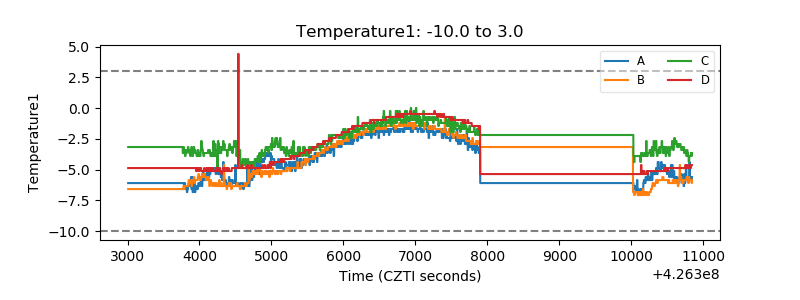 |
| Veto HV Monitor | 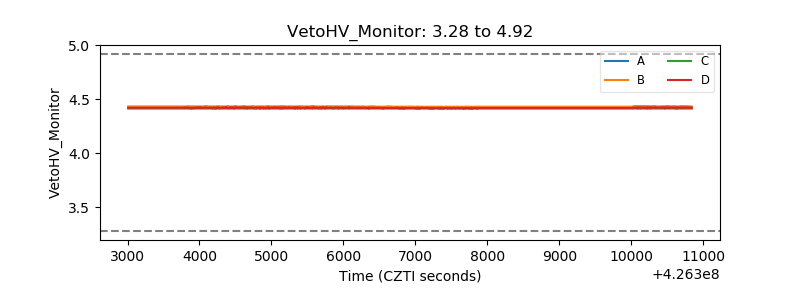 |
| Veto LLD | 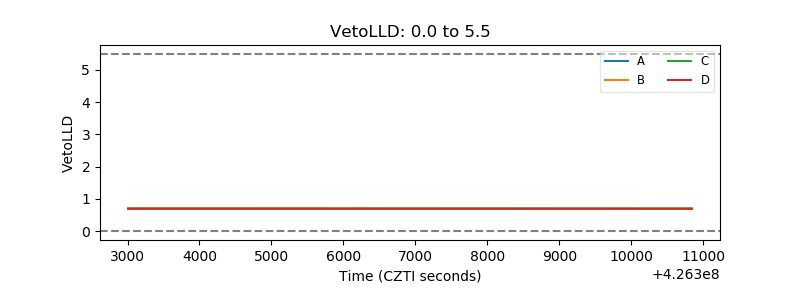 |
| Alpha Counter | 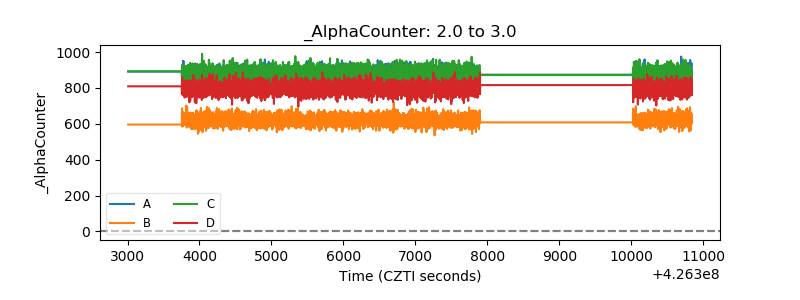 |
| _CPM_Rate | 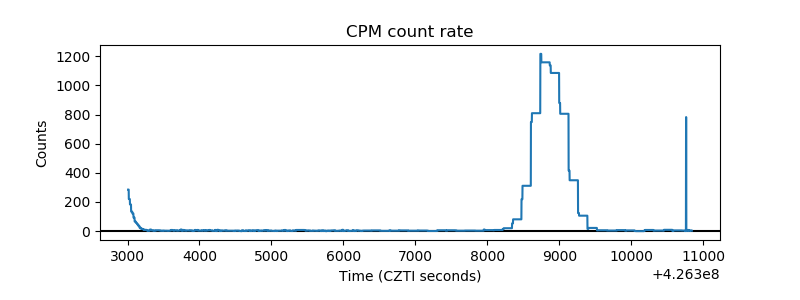 |
| CZT Counter | 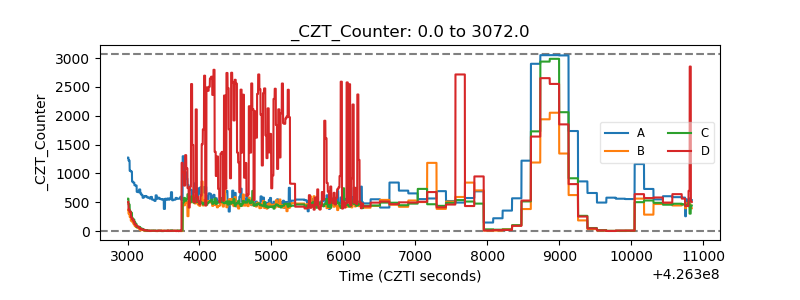 |
| +2.5 Volts monitor |  |
| +5 Volts monitor | 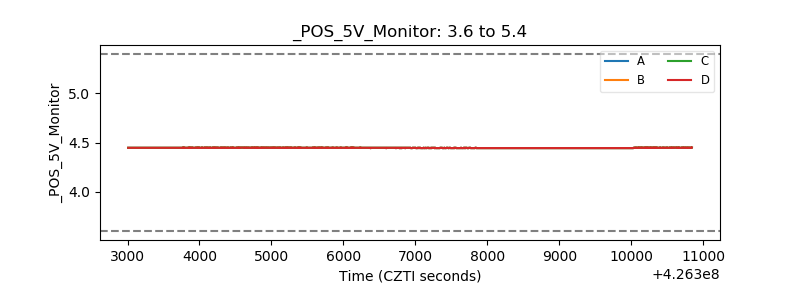 |
| _ROLL_ROT | 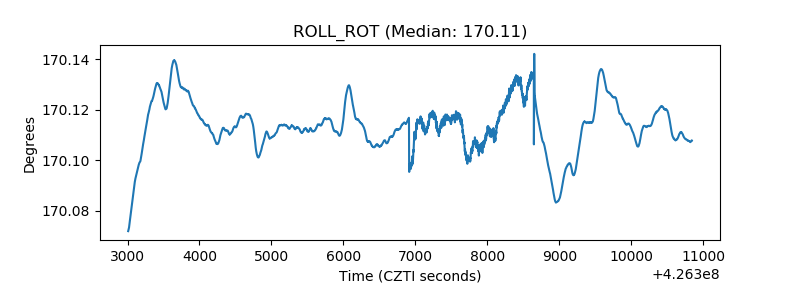 |
| _Roll_DEC | 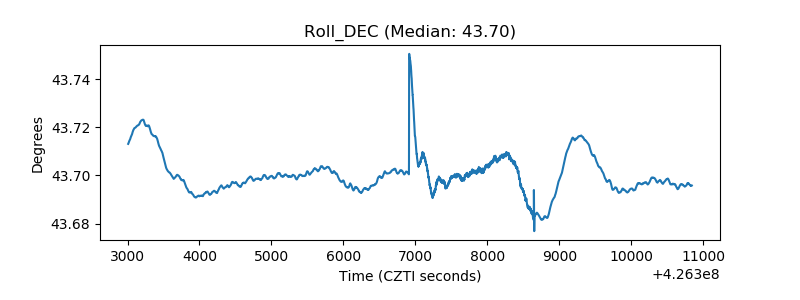 |
| _Roll_RA | 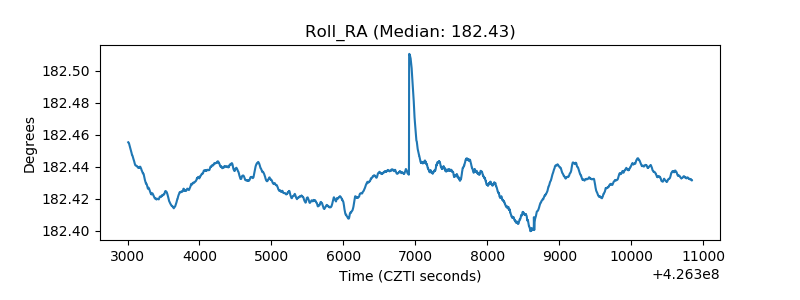 |
| Veto Counter | 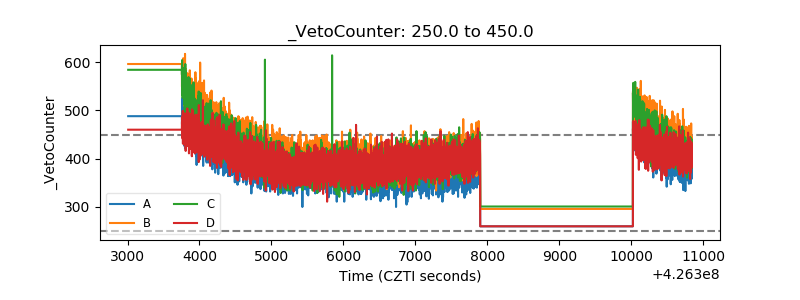 |