| Param | Original file | Final file |
|---|---|---|
| Filename | modeM0/AS1A12_011T26_9000005732_42012cztM0_level2.fits | modeM0/AS1A12_011T26_9000005732_42012cztM0_level2_quad_clean.evt |
| Size (bytes) | 302,486,400 | 86,607,360 |
| Size | 288.5 MB | 82.6 MB |
| Events in quadrant A | 2,830,490 | 584,917 |
| Events in quadrant B | 2,412,529 | 605,318 |
| Events in quadrant C | 2,377,280 | 573,639 |
| Events in quadrant D | 3,189,718 | 510,498 |
| Mode M0 | |||
|---|---|---|---|
| Quadrant | BADHDUFLAG | Total packets | Discarded packets |
| A | 0 | 11260 | 2 |
| B | 0 | 10471 | 2 |
| C | 0 | 10066 | 2 |
| D | 0 | 12755 | 2 |
| Mode M9 | |||
|---|---|---|---|
| Quadrant | BADHDUFLAG | Total packets | Discarded packets |
| A | 0 | 33 | 0 |
| B | 0 | 33 | 0 |
| C | 0 | 34 | 0 |
| D | 0 | 34 | 0 |
| Mode SS | |||
|---|---|---|---|
| Quadrant | BADHDUFLAG | Total packets | Discarded packets |
| A | 0 | 102 | 0 |
| B | 0 | 102 | 0 |
| C | 0 | 102 | 0 |
| D | 0 | 102 | 0 |
| Quadrant | Total seconds | Saturated seconds | Saturation percentage |
|---|---|---|---|
| A | 4965 | 15 | 0.302115% |
| B | 4965 | 20 | 0.402820% |
| C | 4965 | 8 | 0.161128% |
| D | 4965 | 194 | 3.907351% |
Noise dominated data is calculated using 1-second bins in cleaned event files. If a bin has >2000 counts, and if more than 50% of those come from <1% of pixels, then it is considered to be noise-dominated and hence unusable.
| Quadrant | # 1 sec bins | Bins with >0 counts | Bins with >2000 counts | High rate bins dominated by noise | Noise dominated (total time) | Noise dominated (detector-on time) | Marked lightcurve |
|---|---|---|---|---|---|---|---|
| A | 7089 | 4966 | 6 | 6 | 0.08% | 0.12% | 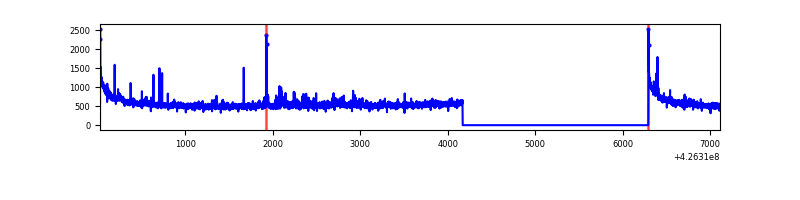 |
| B | 7089 | 4966 | 9 | 9 | 0.13% | 0.18% | 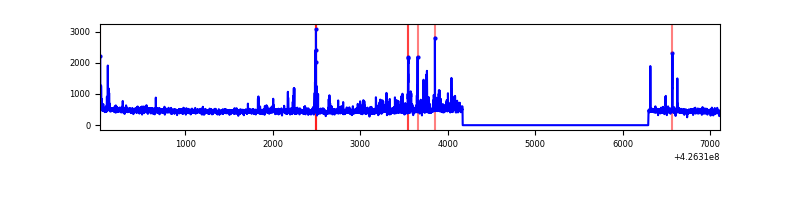 |
| C | 7089 | 4966 | 5 | 5 | 0.07% | 0.10% | 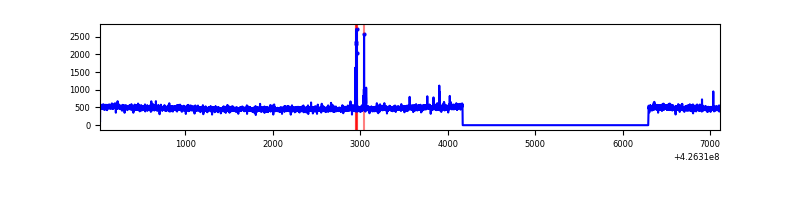 |
| D | 7089 | 4966 | 158 | 158 | 2.23% | 3.18% | 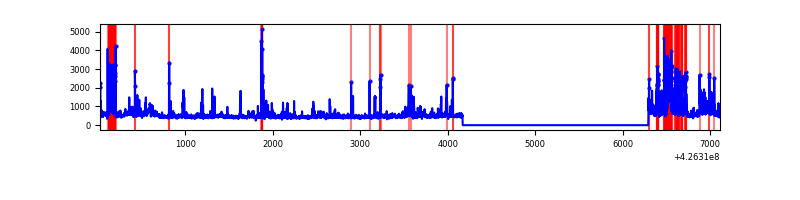 |
Top three noisy pixels from each quadrant. If the there are fewer than three noisy pixels in the level2.evt file, extra rows are filled as -1
| Pixel properties | Quadrant properties | ||||||
|---|---|---|---|---|---|---|---|
| Quadrant | DetID | PixID | Counts | Sigma | Mean | Median | Sigma |
| A | 10 | 83 | 530795 | 4581.09 | 565 | 554 | 115.7 |
| A | 12 | 189 | 69720 | 597.57 | 565 | 554 | 115.7 |
| A | 15 | 223 | 34794 | 295.82 | 565 | 554 | 115.7 |
| B | 0 | 190 | 90764 | 832.97 | 562 | 547 | 108.3 |
| B | 4 | 171 | 36862 | 335.29 | 562 | 547 | 108.3 |
| B | 5 | 255 | 27040 | 244.61 | 562 | 547 | 108.3 |
| C | 15 | 214 | 209075 | 1642.83 | 548 | 550 | 126.9 |
| C | 15 | 111 | 27041 | 208.7 | 548 | 550 | 126.9 |
| C | 13 | 61 | 3700 | 24.82 | 548 | 550 | 126.9 |
| D | 13 | 249 | 619210 | 4710.67 | 539 | 524 | 131.3 |
| D | 1 | 52 | 249847 | 1898.34 | 539 | 524 | 131.3 |
| D | 12 | 6 | 127637 | 967.84 | 539 | 524 | 131.3 |
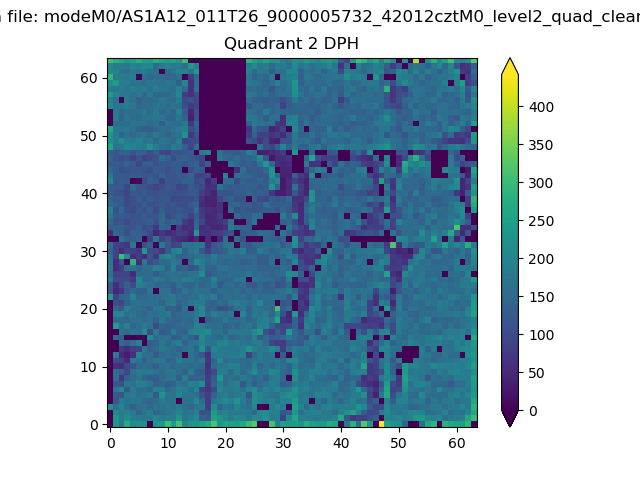
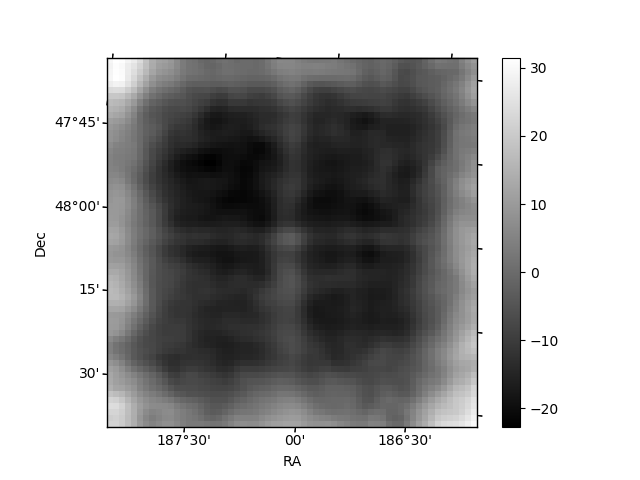
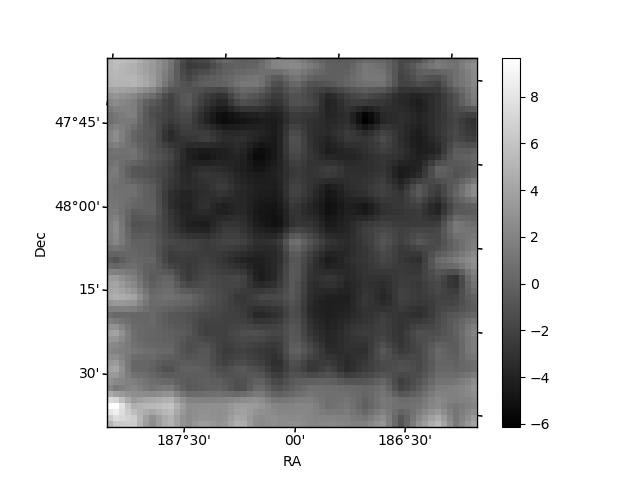
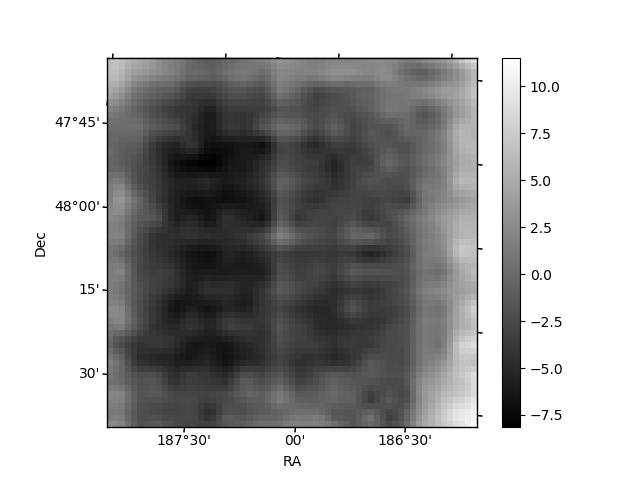
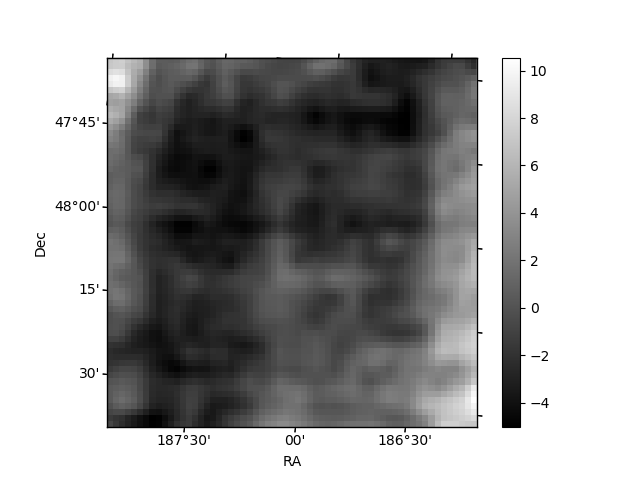
Histogram calculated using DETX and DETY for each event in the final _common_clean file
| Quadrant A | 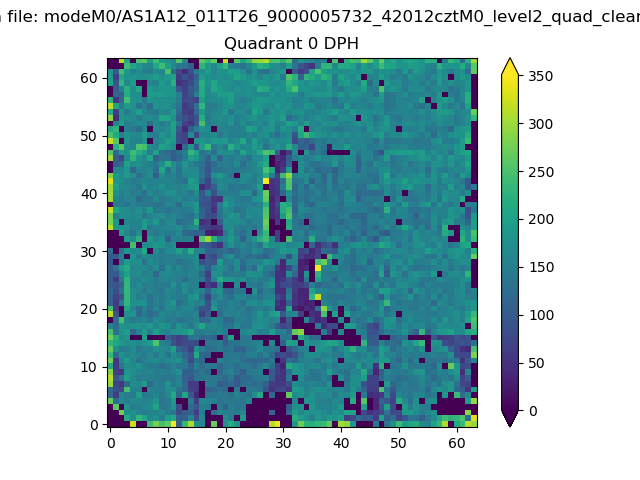 |
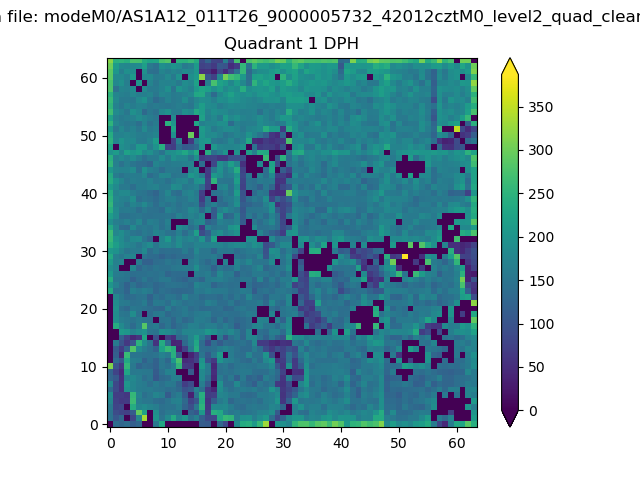 |
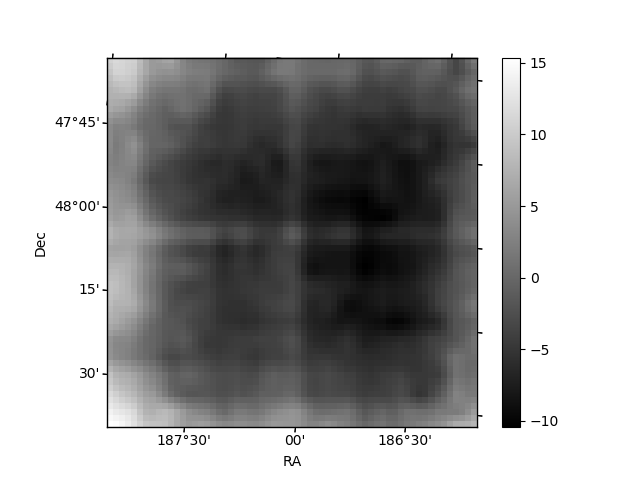
Quadrant B |
|---|---|---|---|
| Quadrant D | 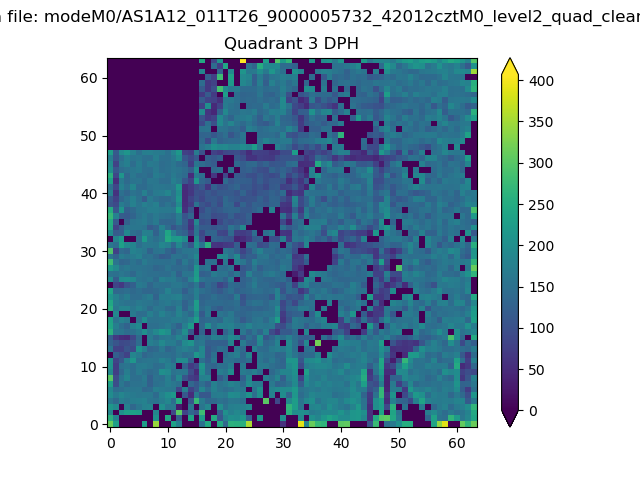 |
 |
Quadrant C |
| Plot type | Count rate plots | Images |
|---|---|---|
| Comparison with Poisson distribution Blue bars denote a histogram of data divided into 1 sec bins. Red curve is a Poisson curve with rate = median count rate of data. |
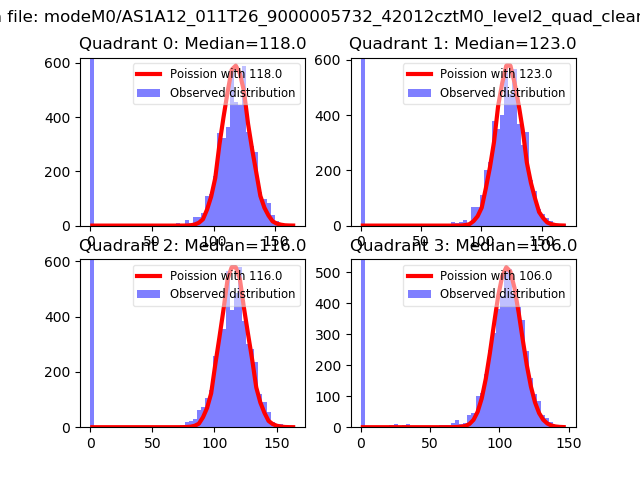 |
 |
| Quadrant-wise count rates Data is divided into 100 sec bins |
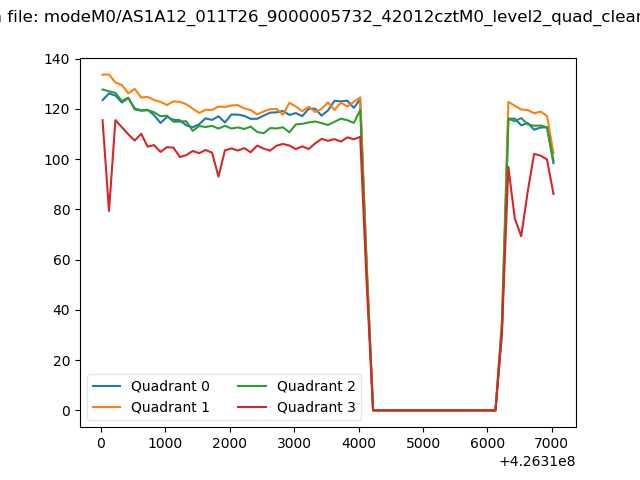 |
|
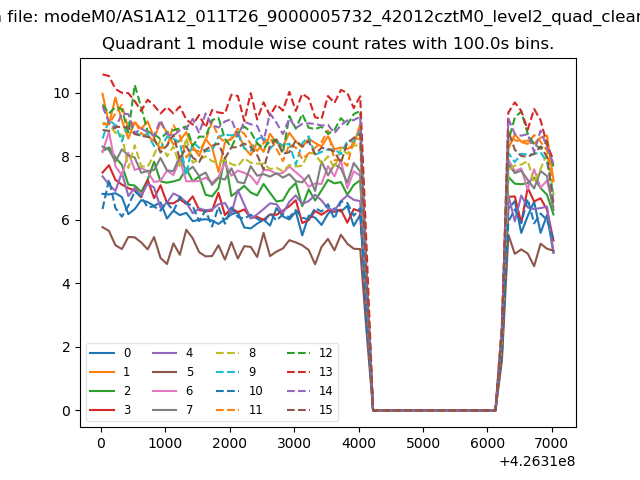
| Module-wise count rates for Quadrant A Data is divided into 100 sec bins |
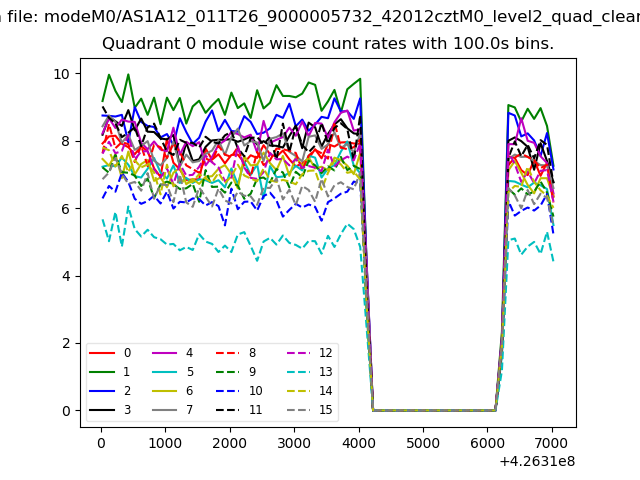 |
 |
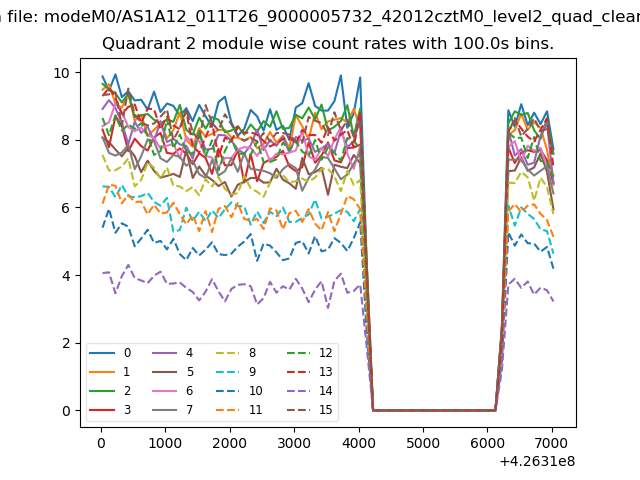
| Module-wise count rates for Quadrant B Data is divided into 100 sec bins |
 |
 |
| Module-wise count rates for Quadrant C Data is divided into 100 sec bins |
 |
 |
| Module-wise count rates for Quadrant D Data is divided into 100 sec bins |
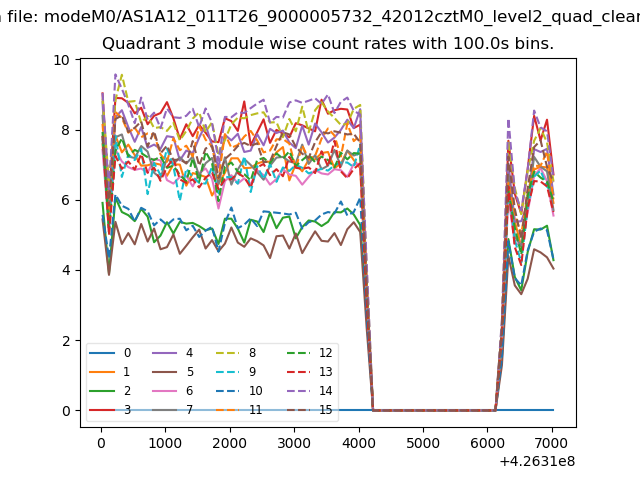 |
 |
| Parameter | Plot |
|---|---|
| CZT HV Monitor | 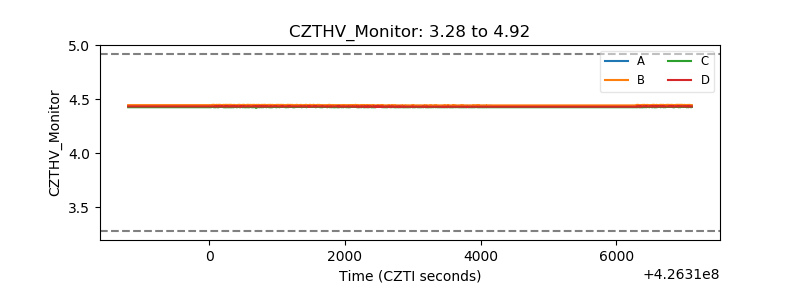 |
| D_VDD | 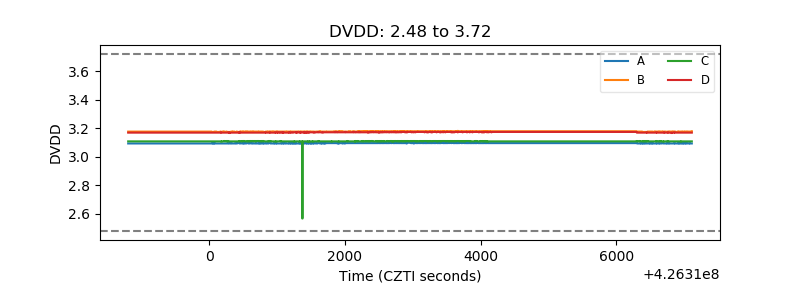 |
| Temperature 1 | 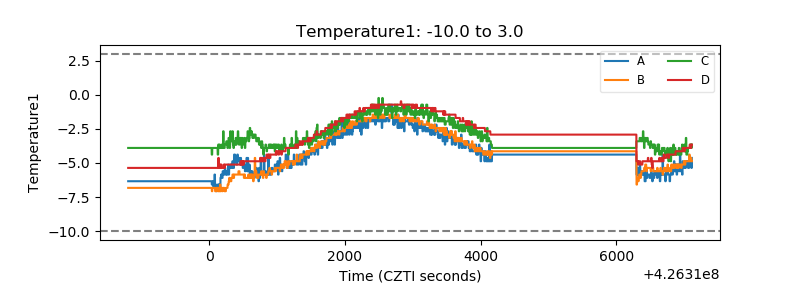 |
| Veto HV Monitor | 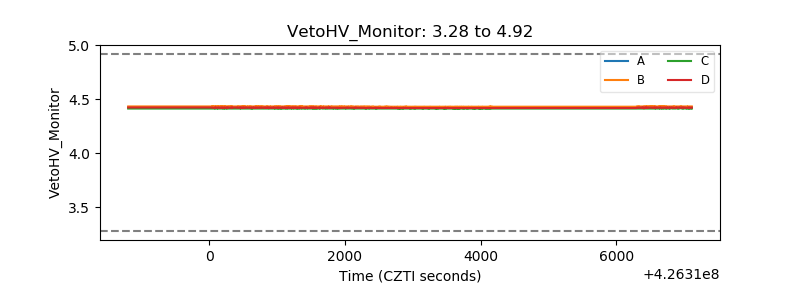 |
| Veto LLD | 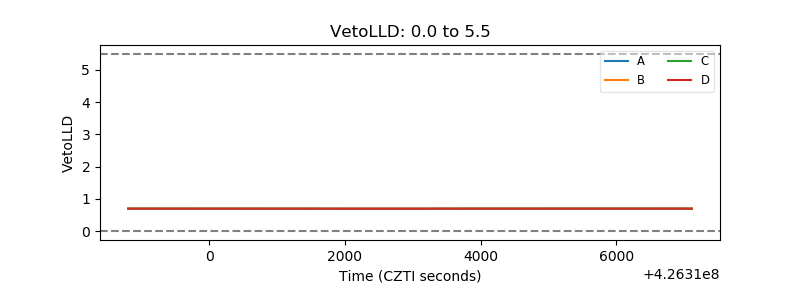 |
| Alpha Counter | 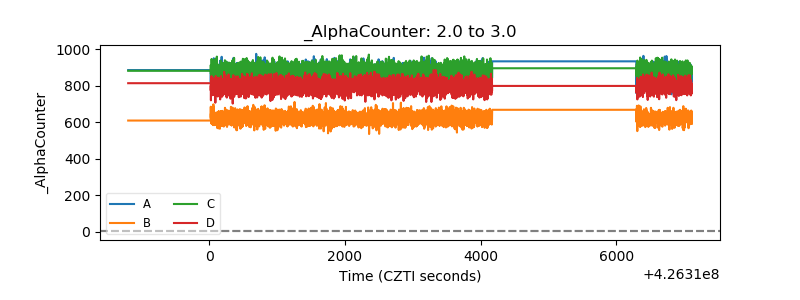 |
| _CPM_Rate | 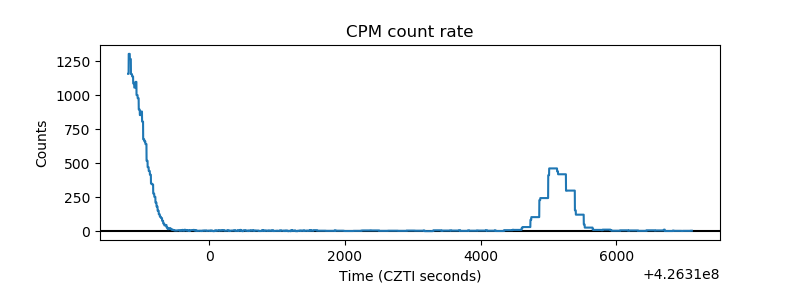 |
| CZT Counter | 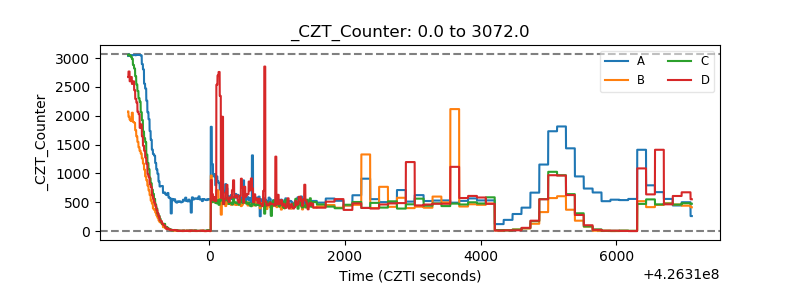 |
| +2.5 Volts monitor | 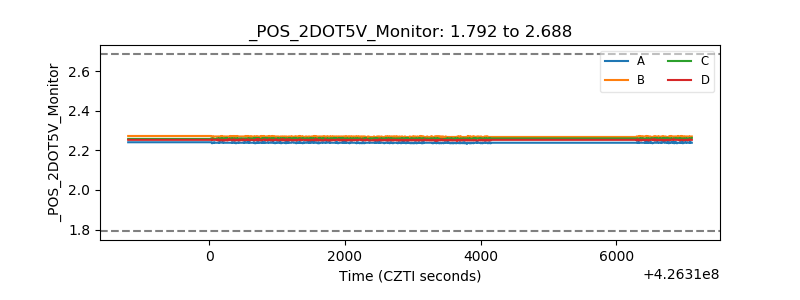 |
| +5 Volts monitor | 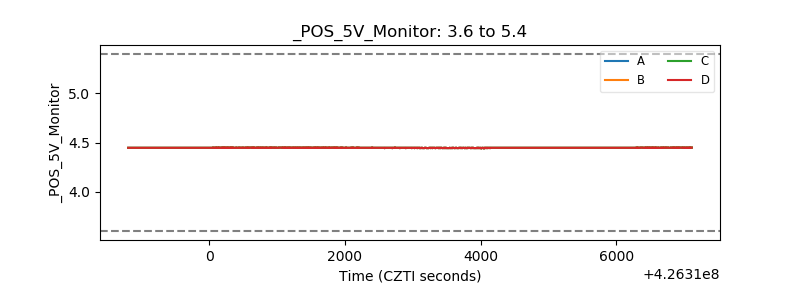 |
| _ROLL_ROT | 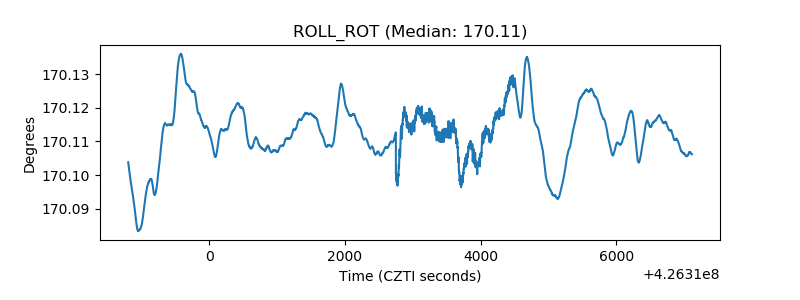 |
| _Roll_DEC | 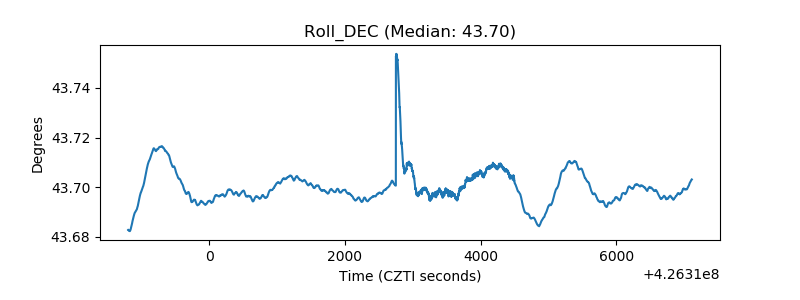 |
| _Roll_RA | 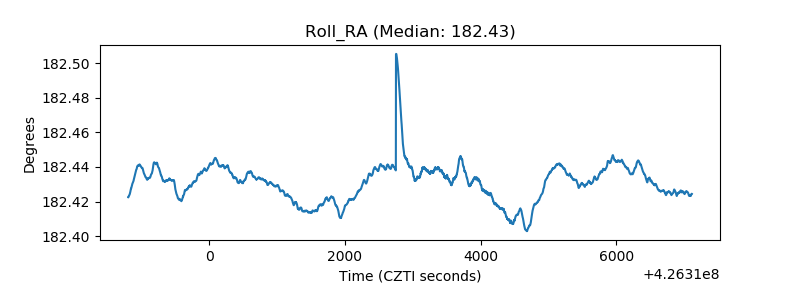 |
| Veto Counter | 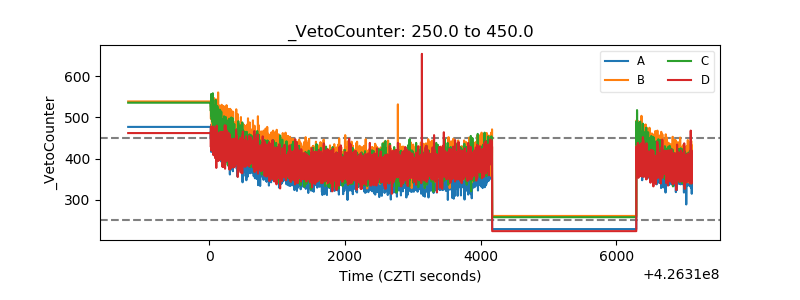 |