| Param | Original file | Final file |
|---|---|---|
| Filename | modeM0/AS1A12_011T26_9000005732_42013cztM0_level2.fits | modeM0/AS1A12_011T26_9000005732_42013cztM0_level2_quad_clean.evt |
| Size (bytes) | 321,278,400 | 83,917,440 |
| Size | 306.4 MB | 80.0 MB |
| Events in quadrant A | 2,817,899 | 563,830 |
| Events in quadrant B | 2,411,692 | 580,648 |
| Events in quadrant C | 2,333,350 | 552,731 |
| Events in quadrant D | 3,939,834 | 492,423 |
| Mode M0 | |||
|---|---|---|---|
| Quadrant | BADHDUFLAG | Total packets | Discarded packets |
| A | 0 | 11253 | 2 |
| B | 0 | 10630 | 2 |
| C | 0 | 10092 | 2 |
| D | 0 | 15060 | 2 |
| Mode M9 | |||
|---|---|---|---|
| Quadrant | BADHDUFLAG | Total packets | Discarded packets |
| A | 0 | 33 | 0 |
| B | 0 | 33 | 0 |
| C | 0 | 34 | 0 |
| D | 0 | 34 | 0 |
| Mode SS | |||
|---|---|---|---|
| Quadrant | BADHDUFLAG | Total packets | Discarded packets |
| A | 0 | 104 | 0 |
| B | 0 | 104 | 0 |
| C | 0 | 104 | 0 |
| D | 0 | 104 | 0 |
| Quadrant | Total seconds | Saturated seconds | Saturation percentage |
|---|---|---|---|
| A | 5005 | 13 | 0.259740% |
| B | 5005 | 26 | 0.519481% |
| C | 5005 | 4 | 0.079920% |
| D | 5005 | 233 | 4.655345% |
Noise dominated data is calculated using 1-second bins in cleaned event files. If a bin has >2000 counts, and if more than 50% of those come from <1% of pixels, then it is considered to be noise-dominated and hence unusable.
| Quadrant | # 1 sec bins | Bins with >0 counts | Bins with >2000 counts | High rate bins dominated by noise | Noise dominated (total time) | Noise dominated (detector-on time) | Marked lightcurve |
|---|---|---|---|---|---|---|---|
| A | 7039 | 5006 | 7 | 7 | 0.10% | 0.14% | 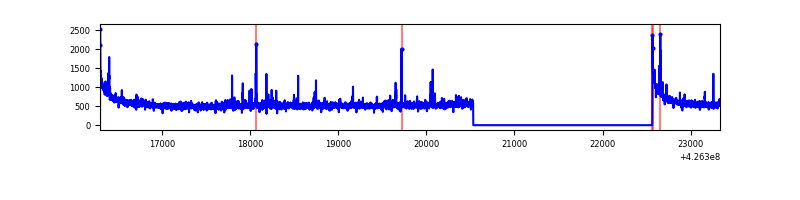 |
| B | 7039 | 5006 | 11 | 11 | 0.16% | 0.22% | 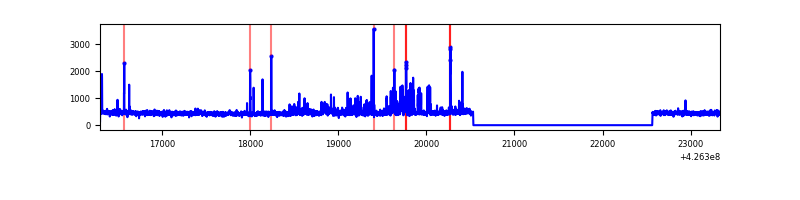 |
| C | 7039 | 5006 | 0 | 0 | 0.00% | 0.00% | 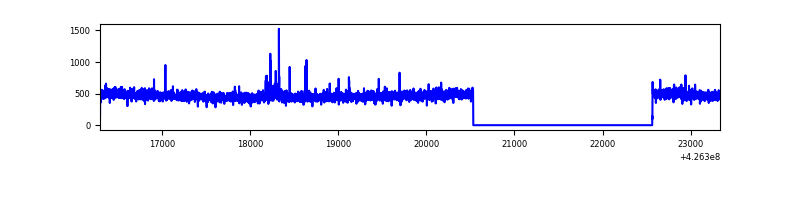 |
| D | 7039 | 5006 | 195 | 195 | 2.77% | 3.90% | 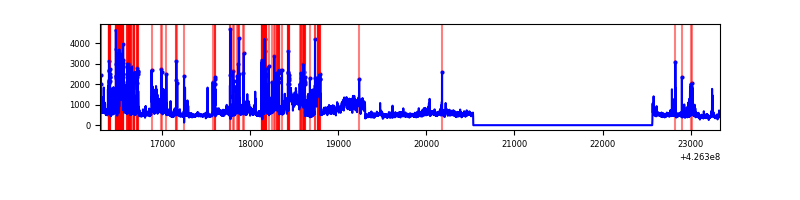 |
Top three noisy pixels from each quadrant. If the there are fewer than three noisy pixels in the level2.evt file, extra rows are filled as -1
| Pixel properties | Quadrant properties | ||||||
|---|---|---|---|---|---|---|---|
| Quadrant | DetID | PixID | Counts | Sigma | Mean | Median | Sigma |
| A | 10 | 83 | 541237 | 4768.2 | 552 | 541 | 113.4 |
| A | 12 | 189 | 89816 | 787.28 | 552 | 541 | 113.4 |
| A | 15 | 223 | 28110 | 243.12 | 552 | 541 | 113.4 |
| B | 0 | 190 | 138815 | 1303.49 | 548 | 533 | 106.1 |
| B | 5 | 255 | 60527 | 565.52 | 548 | 533 | 106.1 |
| B | 4 | 171 | 16823 | 153.56 | 548 | 533 | 106.1 |
| C | 15 | 214 | 210922 | 1677.19 | 536 | 540 | 125.4 |
| C | 8 | 79 | 15604 | 120.09 | 536 | 540 | 125.4 |
| C | 14 | 255 | 6275 | 45.72 | 536 | 540 | 125.4 |
| D | 1 | 52 | 943098 | 7323.55 | 527 | 513 | 128.7 |
| D | 13 | 249 | 527170 | 4091.94 | 527 | 513 | 128.7 |
| D | 12 | 250 | 185618 | 1438.2 | 527 | 513 | 128.7 |
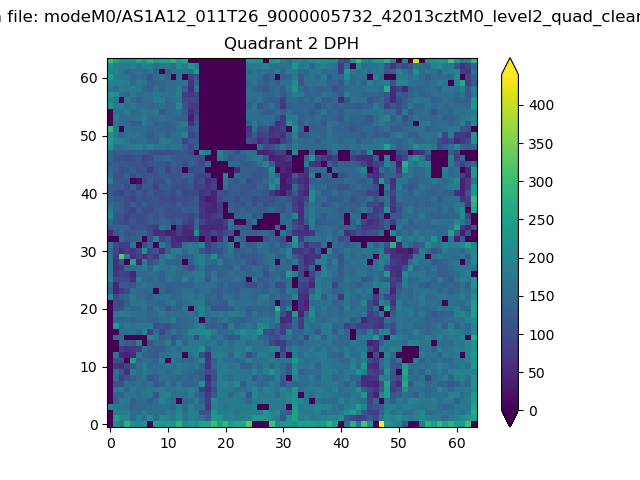
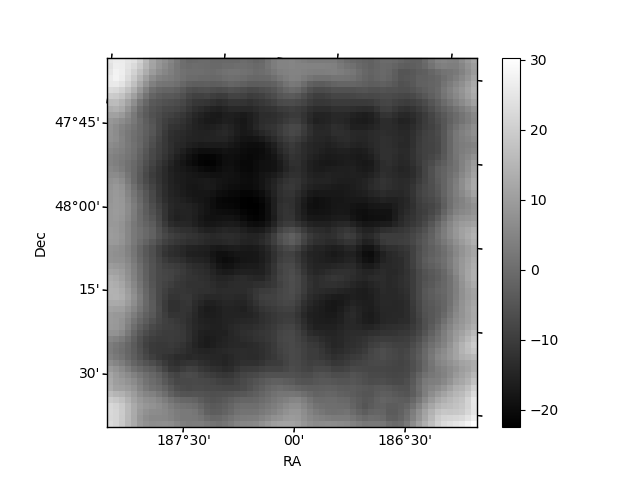
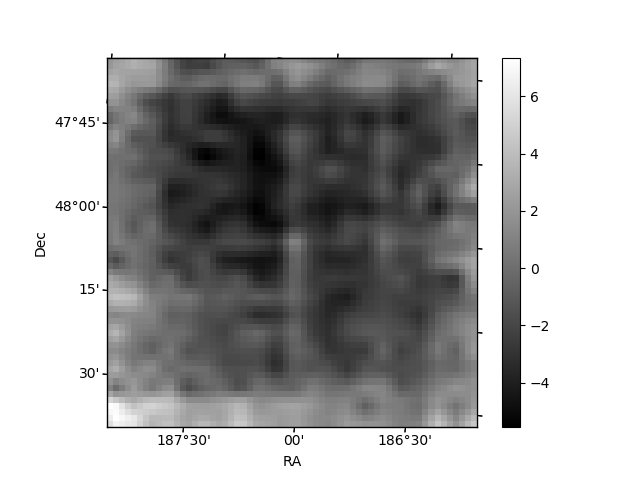
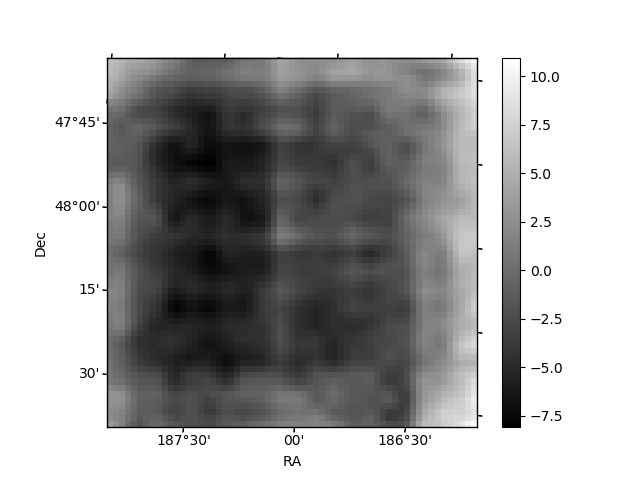
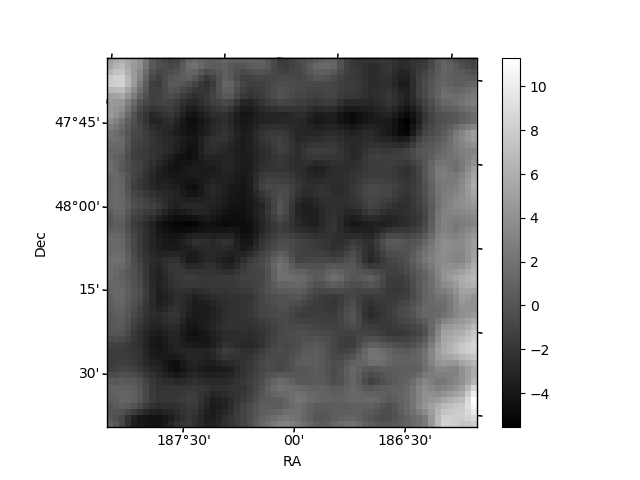
Histogram calculated using DETX and DETY for each event in the final _common_clean file
| Quadrant A | 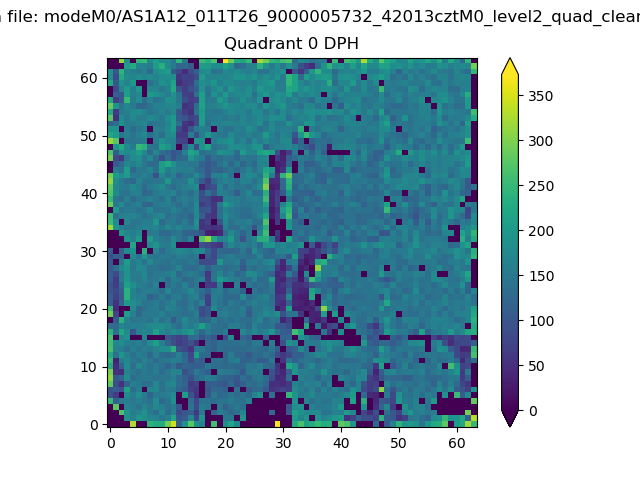 |
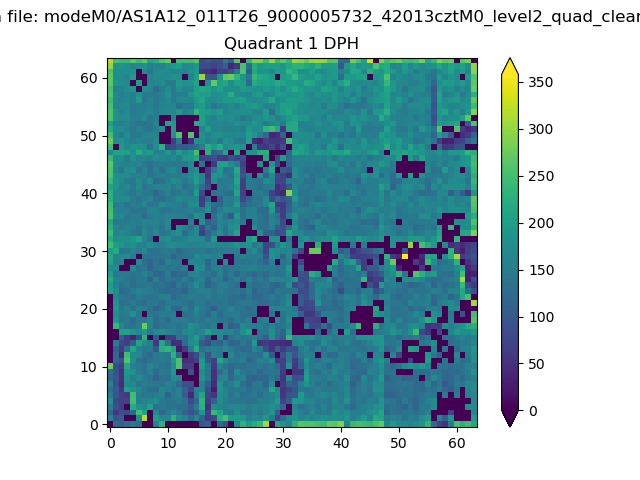 |
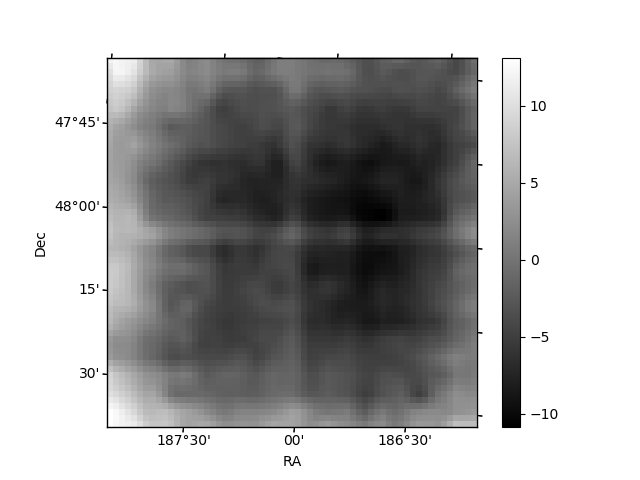
Quadrant B |
|---|---|---|---|
| Quadrant D | 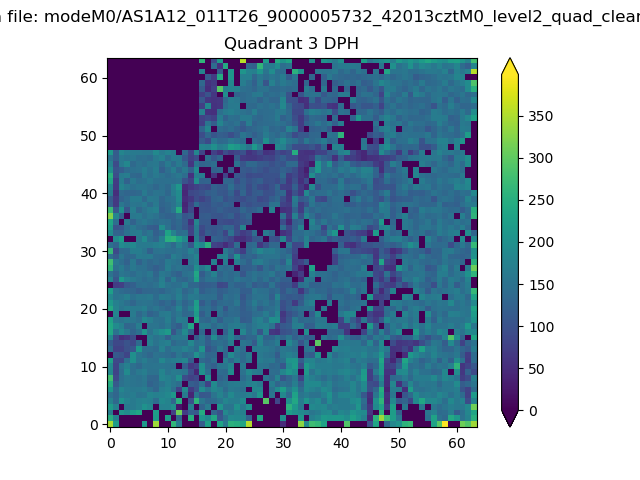 |
 |
Quadrant C |
| Plot type | Count rate plots | Images |
|---|---|---|
| Comparison with Poisson distribution Blue bars denote a histogram of data divided into 1 sec bins. Red curve is a Poisson curve with rate = median count rate of data. |
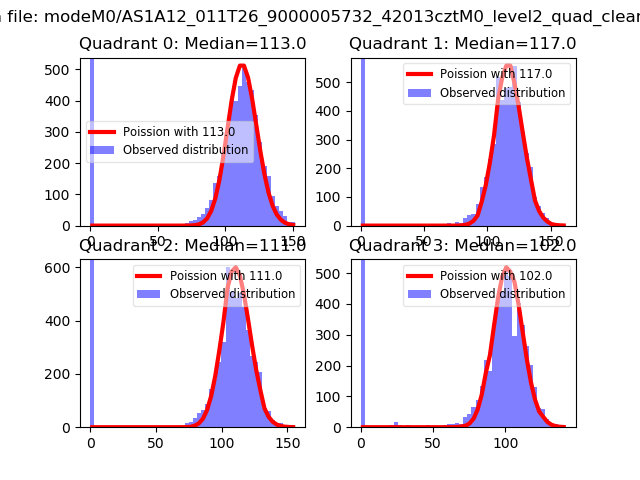 |
 |
| Quadrant-wise count rates Data is divided into 100 sec bins |
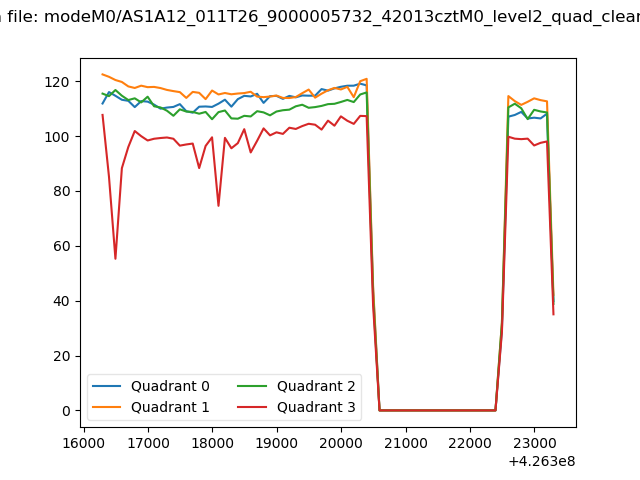 |
|
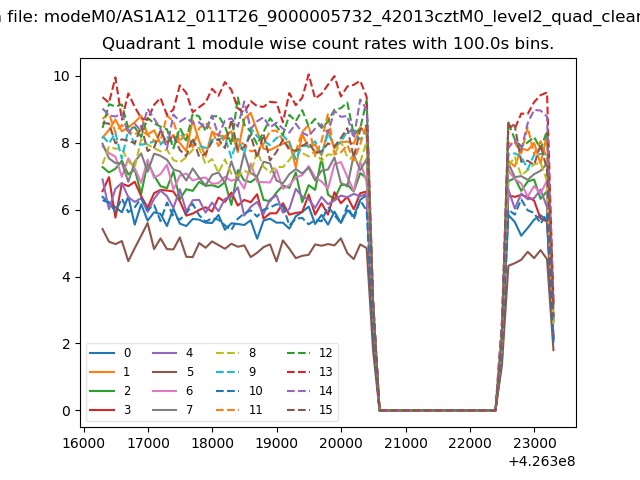
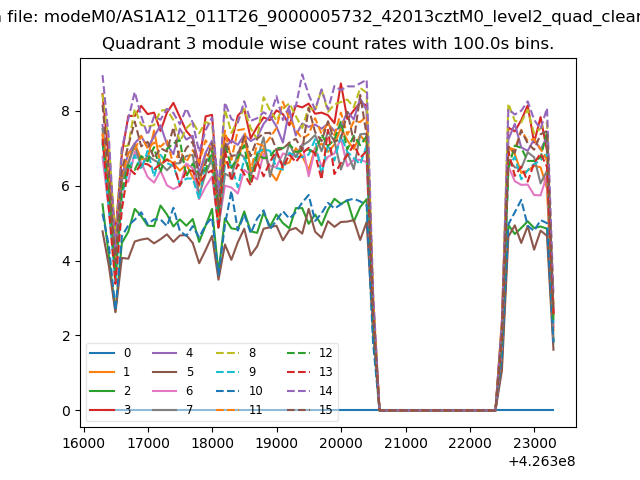
| Module-wise count rates for Quadrant A Data is divided into 100 sec bins |
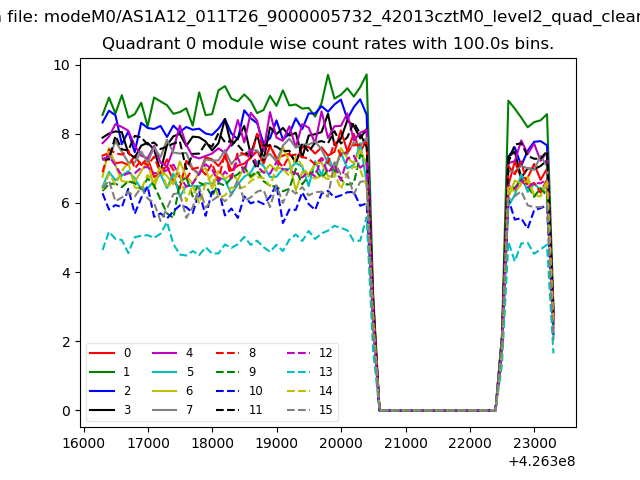 |
 |
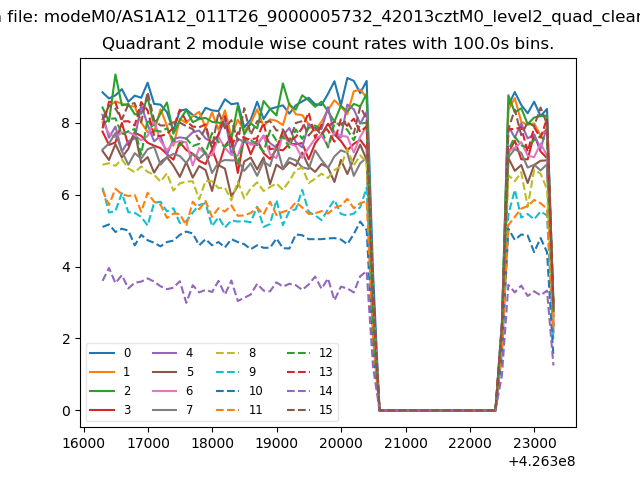
| Module-wise count rates for Quadrant B Data is divided into 100 sec bins |
 |
 |
| Module-wise count rates for Quadrant C Data is divided into 100 sec bins |
 |
 |
| Module-wise count rates for Quadrant D Data is divided into 100 sec bins |
 |
 |
| Parameter | Plot |
|---|---|
| CZT HV Monitor | 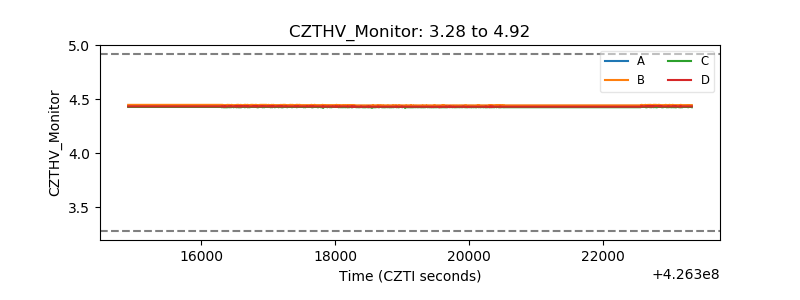 |
| D_VDD |  |
| Temperature 1 | 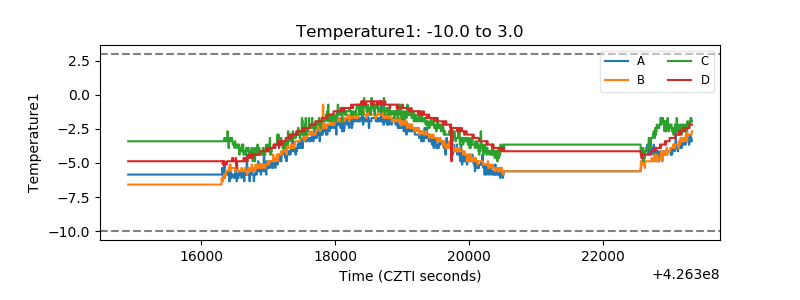 |
| Veto HV Monitor | 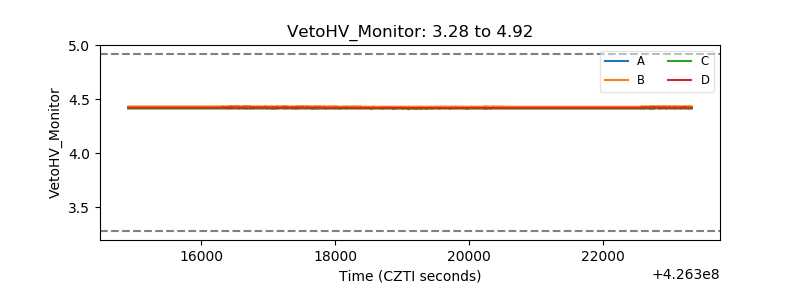 |
| Veto LLD | 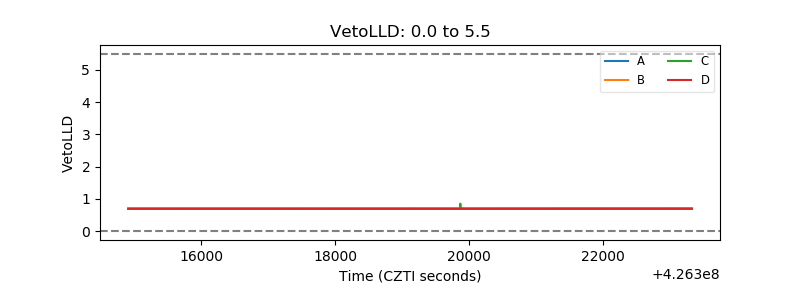 |
| Alpha Counter | 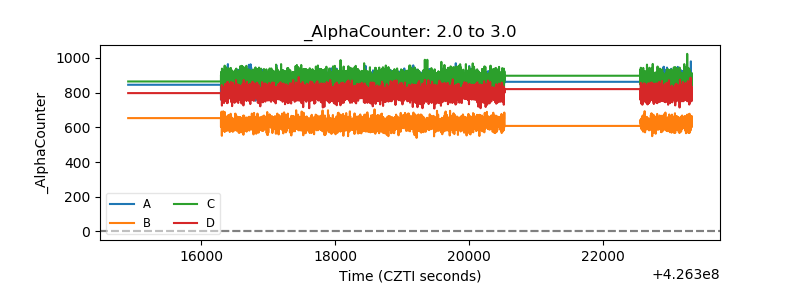 |
| _CPM_Rate | 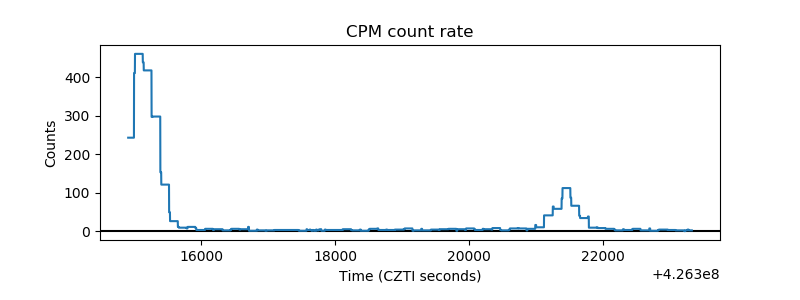 |
| CZT Counter | 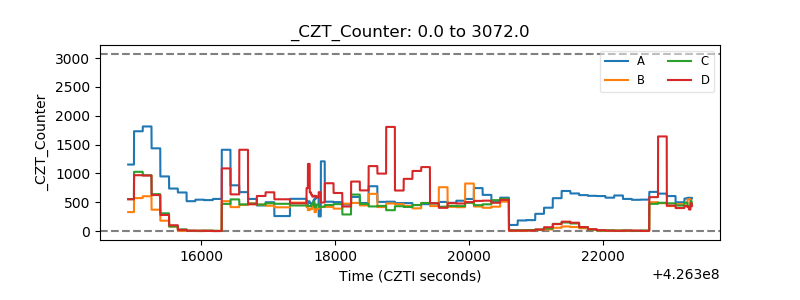 |
| +2.5 Volts monitor | 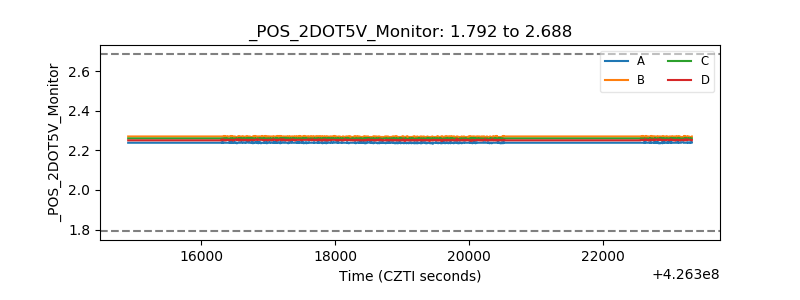 |
| +5 Volts monitor | 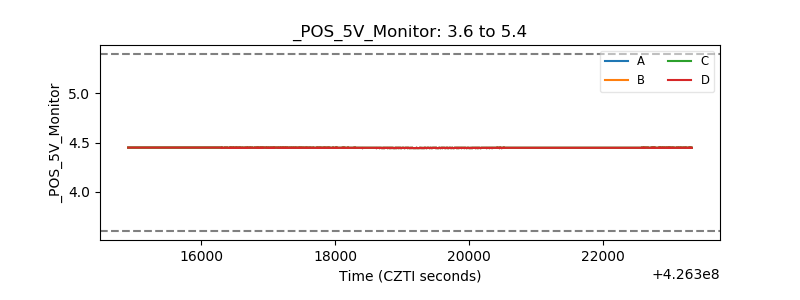 |
| _ROLL_ROT | 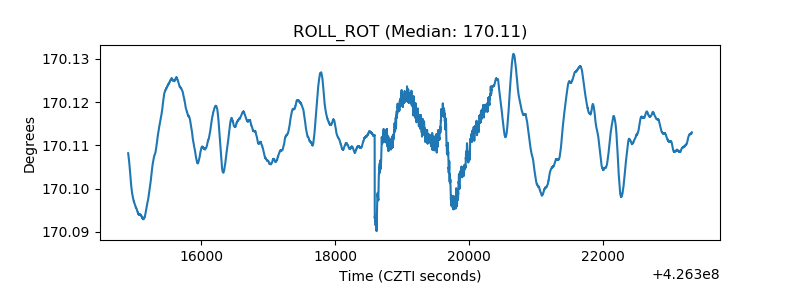 |
| _Roll_DEC | 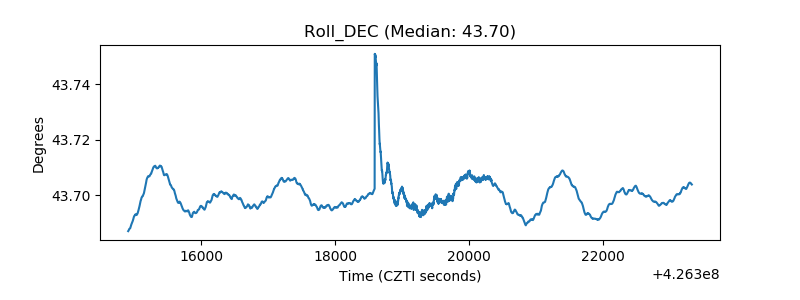 |
| _Roll_RA | 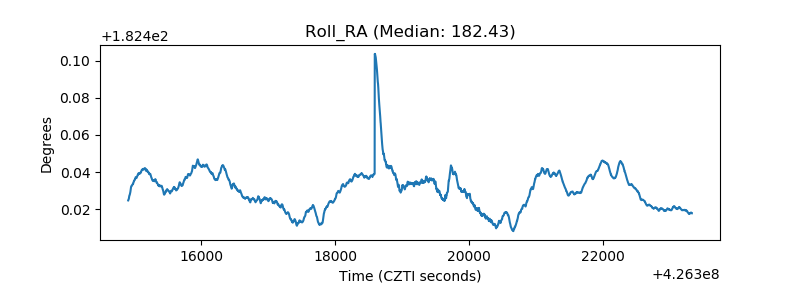 |
| Veto Counter | 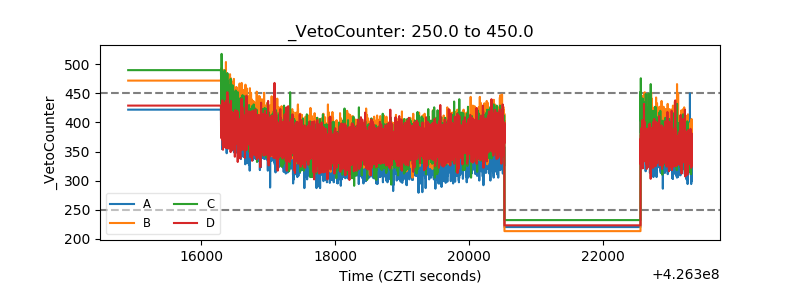 |