| Param | Original file | Final file |
|---|---|---|
| Filename | modeM0/AS1A12_011T26_9000005732_42014cztM0_level2.fits | modeM0/AS1A12_011T26_9000005732_42014cztM0_level2_quad_clean.evt |
| Size (bytes) | 883,019,520 | 230,094,720 |
| Size | 842.1 MB | 219.4 MB |
| Events in quadrant A | 7,971,802 | 1,556,019 |
| Events in quadrant B | 6,789,840 | 1,609,468 |
| Events in quadrant C | 6,477,690 | 1,528,670 |
| Events in quadrant D | 10,373,633 | 1,315,645 |
| Mode M0 | |||
|---|---|---|---|
| Quadrant | BADHDUFLAG | Total packets | Discarded packets |
| A | 0 | 31523 | 4 |
| B | 0 | 29635 | 7 |
| C | 0 | 28012 | 5 |
| D | 0 | 40215 | 14 |
| Mode M9 | |||
|---|---|---|---|
| Quadrant | BADHDUFLAG | Total packets | Discarded packets |
| A | 0 | 59 | 0 |
| B | 0 | 60 | 0 |
| C | 0 | 60 | 0 |
| D | 0 | 60 | 0 |
| Mode SS | |||
|---|---|---|---|
| Quadrant | BADHDUFLAG | Total packets | Discarded packets |
| A | 0 | 284 | 0 |
| B | 0 | 284 | 0 |
| C | 0 | 284 | 0 |
| D | 0 | 284 | 0 |
| Quadrant | Total seconds | Saturated seconds | Saturation percentage |
|---|---|---|---|
| A | 13857 | 124 | 0.894855% |
| B | 13856 | 58 | 0.418591% |
| C | 13857 | 11 | 0.079382% |
| D | 13854 | 975 | 7.037679% |
Noise dominated data is calculated using 1-second bins in cleaned event files. If a bin has >2000 counts, and if more than 50% of those come from <1% of pixels, then it is considered to be noise-dominated and hence unusable.
| Quadrant | # 1 sec bins | Bins with >0 counts | Bins with >2000 counts | High rate bins dominated by noise | Noise dominated (total time) | Noise dominated (detector-on time) | Marked lightcurve |
|---|---|---|---|---|---|---|---|
| A | 19718 | 13860 | 68 | 68 | 0.34% | 0.49% | 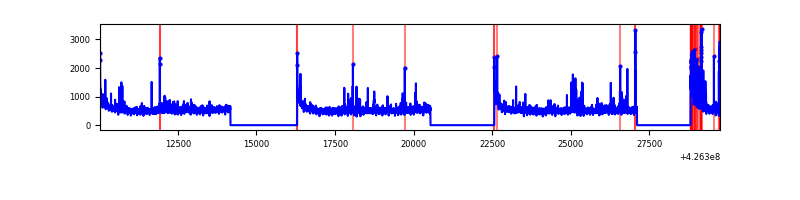 |
| B | 19718 | 13860 | 23 | 23 | 0.12% | 0.17% | 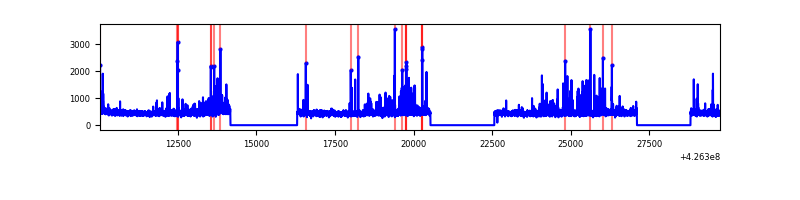 |
| C | 19718 | 13860 | 6 | 6 | 0.03% | 0.04% | 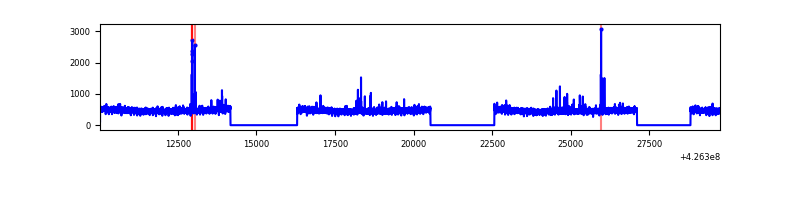 |
| D | 19718 | 13858 | 879 | 879 | 4.46% | 6.34% | 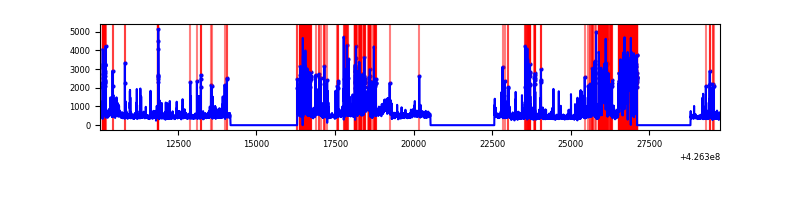 |
Top three noisy pixels from each quadrant. If the there are fewer than three noisy pixels in the level2.evt file, extra rows are filled as -1
| Pixel properties | Quadrant properties | ||||||
|---|---|---|---|---|---|---|---|
| Quadrant | DetID | PixID | Counts | Sigma | Mean | Median | Sigma |
| A | 10 | 83 | 1376523 | 4417.5 | 1532 | 1501 | 311.3 |
| A | 15 | 223 | 416932 | 1334.65 | 1532 | 1501 | 311.3 |
| A | 12 | 189 | 184369 | 587.5 | 1532 | 1501 | 311.3 |
| B | 0 | 190 | 443474 | 1529.33 | 1521 | 1481 | 289.0 |
| B | 5 | 255 | 106214 | 362.38 | 1521 | 1481 | 289.0 |
| B | 4 | 171 | 85460 | 290.57 | 1521 | 1481 | 289.0 |
| C | 15 | 214 | 577442 | 1680.81 | 1488 | 1496 | 342.7 |
| C | 15 | 111 | 59166 | 168.3 | 1488 | 1496 | 342.7 |
| C | 8 | 79 | 26361 | 72.56 | 1488 | 1496 | 342.7 |
| D | 2 | 249 | 1798408 | 5109.9 | 1438 | 1398 | 351.7 |
| D | 13 | 249 | 1223354 | 3474.7 | 1438 | 1398 | 351.7 |
| D | 1 | 52 | 1130114 | 3209.57 | 1438 | 1398 | 351.7 |
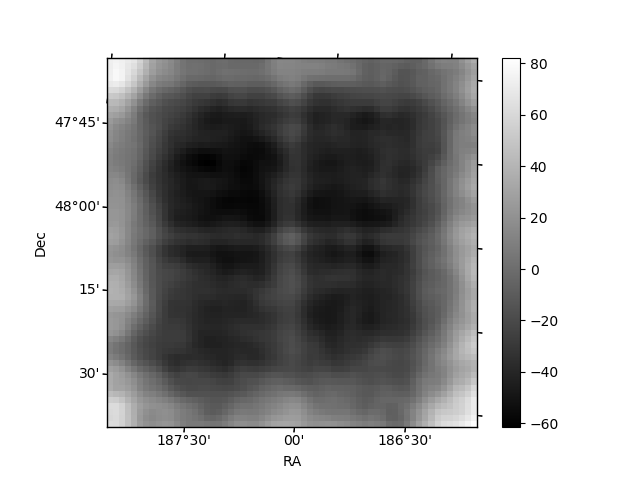
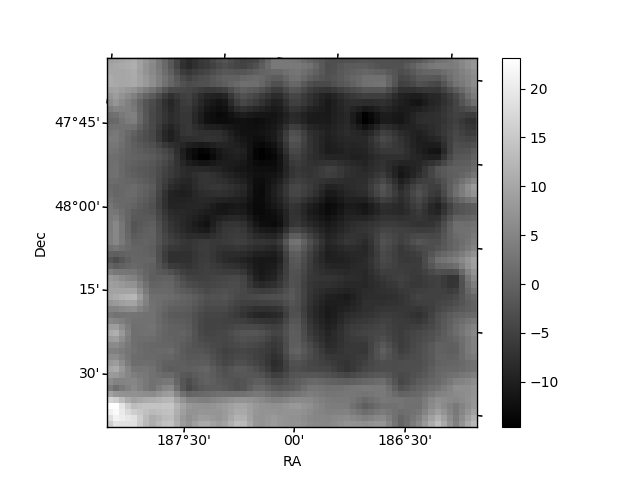
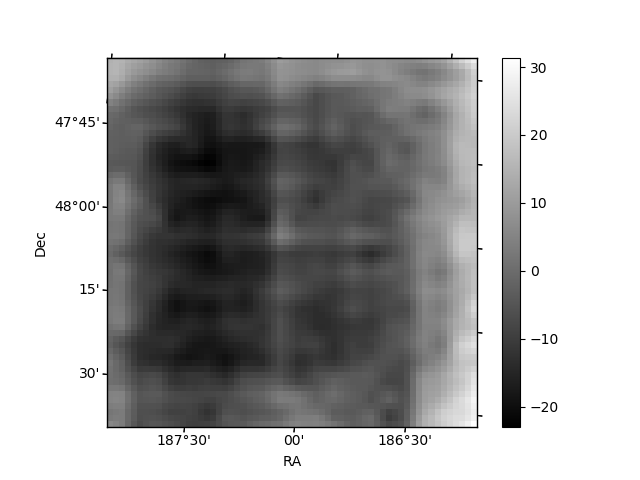
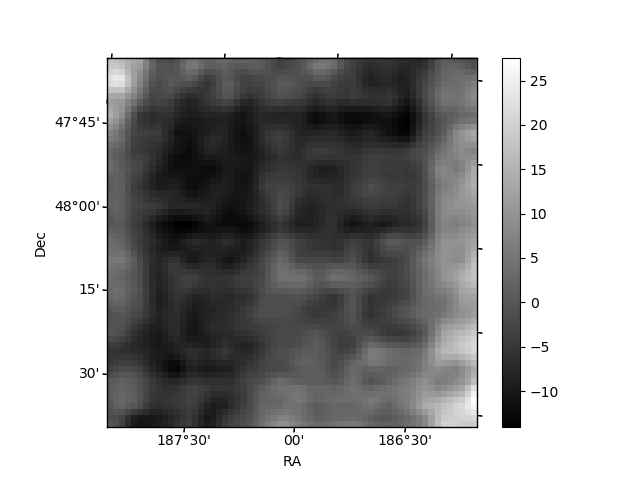
Histogram calculated using DETX and DETY for each event in the final _common_clean file
| Quadrant A | 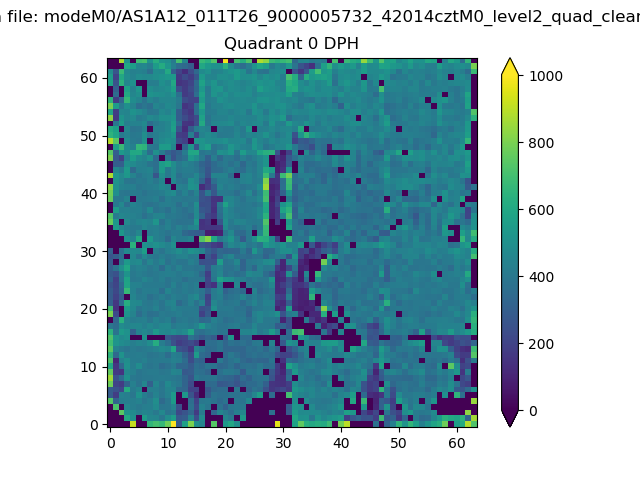 |
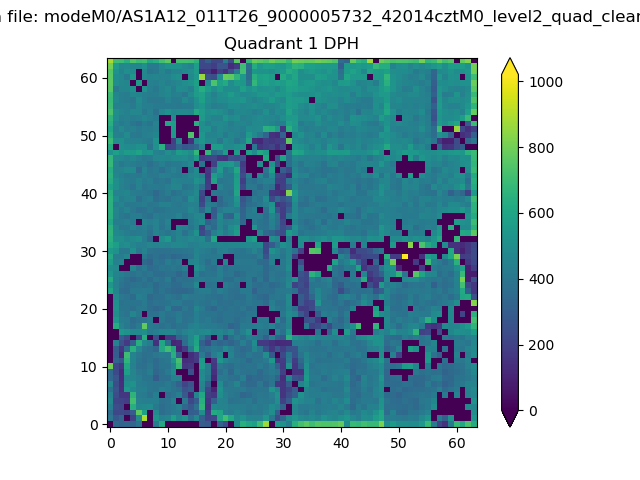 |
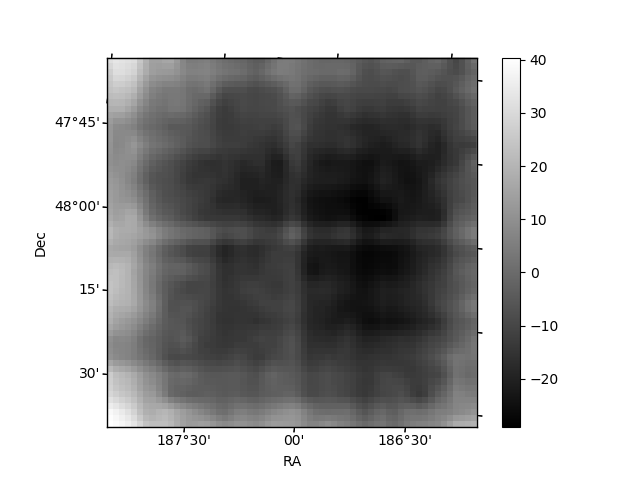
Quadrant B |
|---|---|---|---|
| Quadrant D | 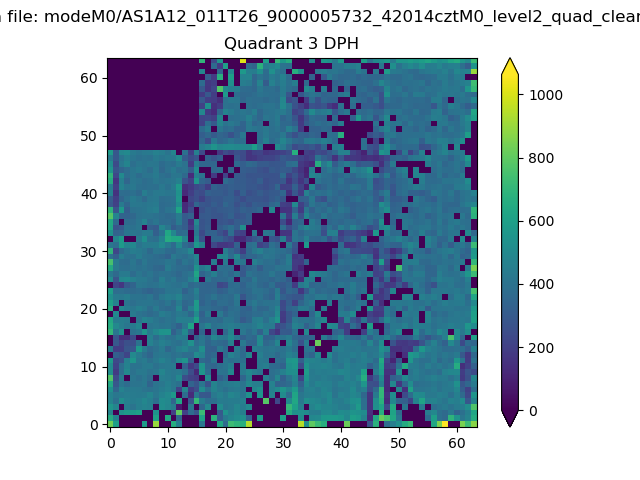 |
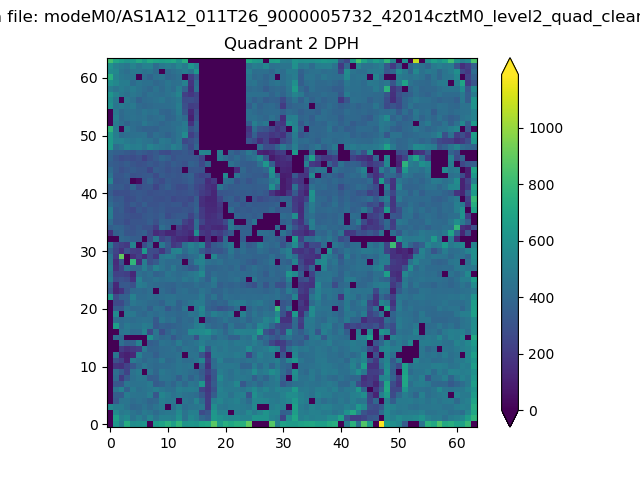 |
Quadrant C |
| Plot type | Count rate plots | Images |
|---|---|---|
| Comparison with Poisson distribution Blue bars denote a histogram of data divided into 1 sec bins. Red curve is a Poisson curve with rate = median count rate of data. |
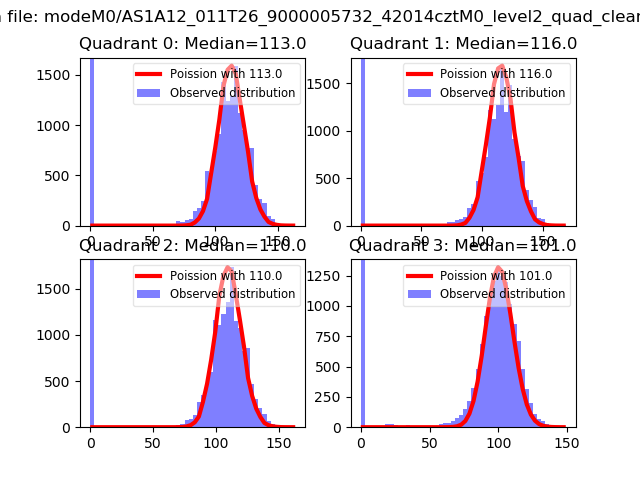 |
 |
| Quadrant-wise count rates Data is divided into 100 sec bins |
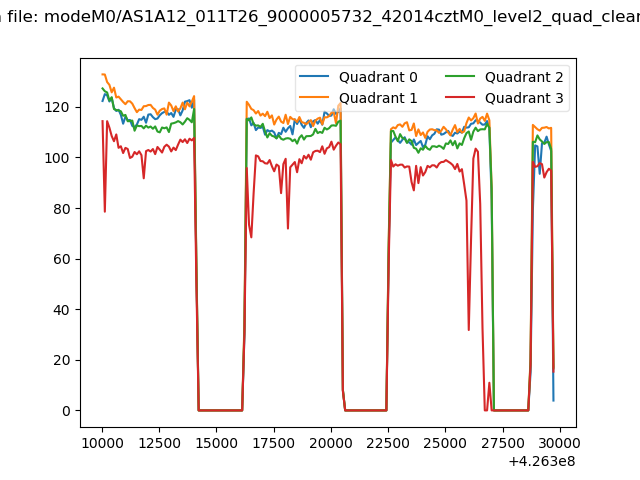 |
|
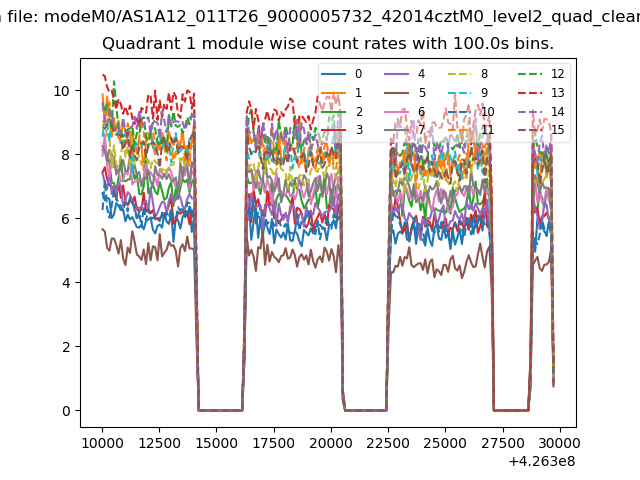
| Module-wise count rates for Quadrant A Data is divided into 100 sec bins |
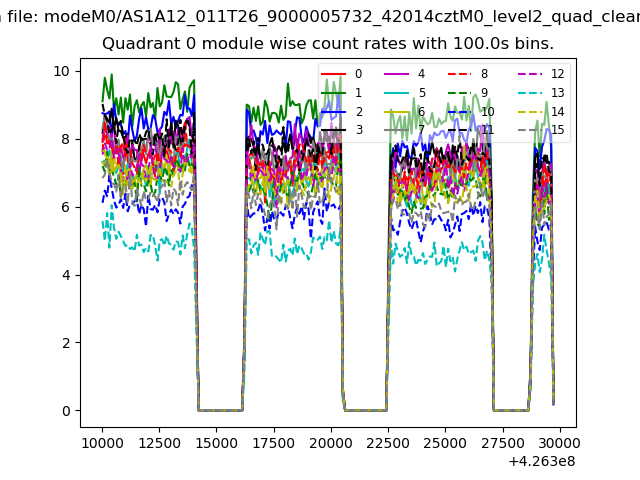 |
 |
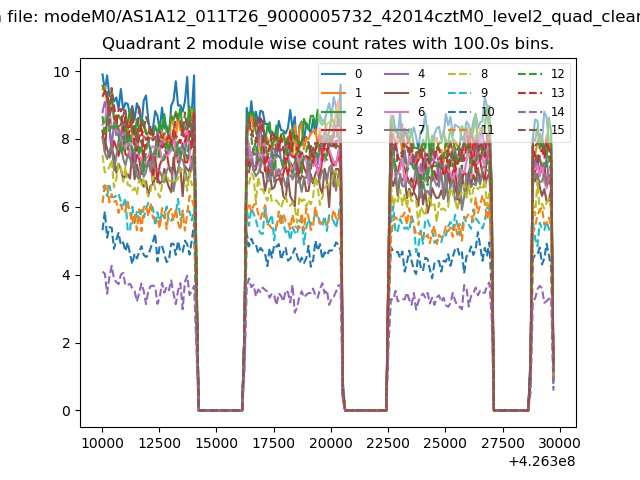
| Module-wise count rates for Quadrant B Data is divided into 100 sec bins |
 |
 |
| Module-wise count rates for Quadrant C Data is divided into 100 sec bins |
 |
 |
| Module-wise count rates for Quadrant D Data is divided into 100 sec bins |
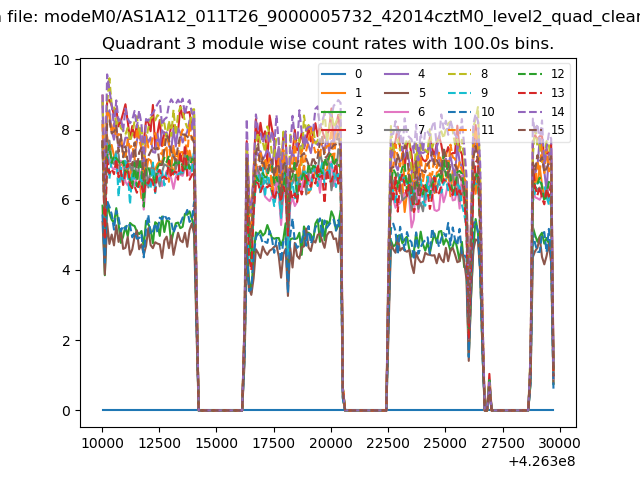 |
 |
| Parameter | Plot |
|---|---|
| CZT HV Monitor | 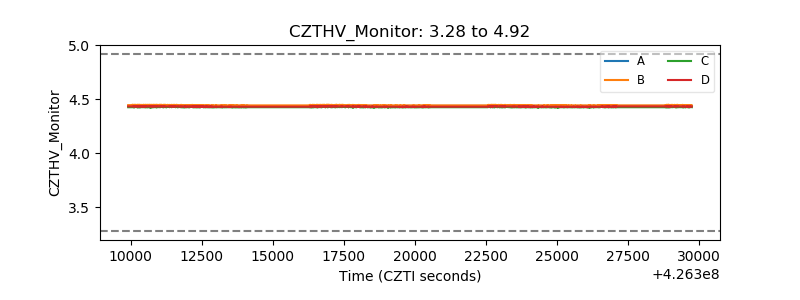 |
| D_VDD | 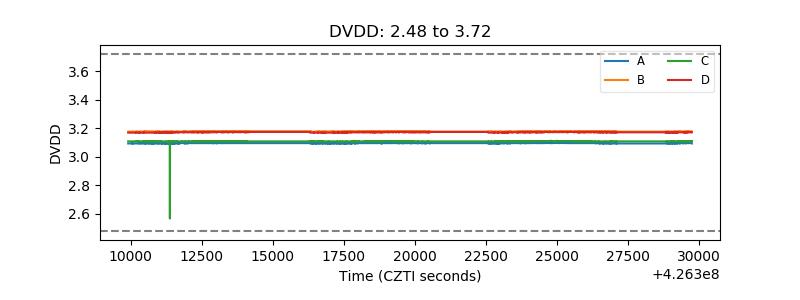 |
| Temperature 1 | 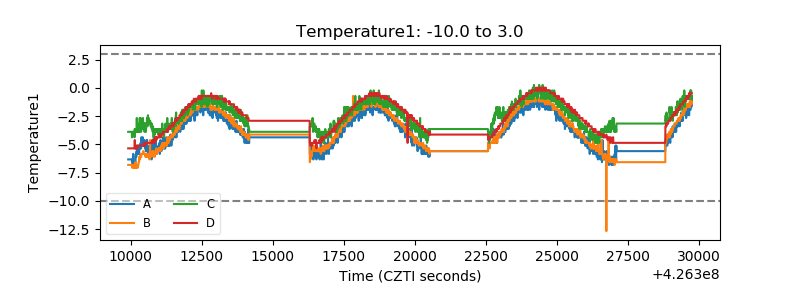 |
| Veto HV Monitor |  |
| Veto LLD | 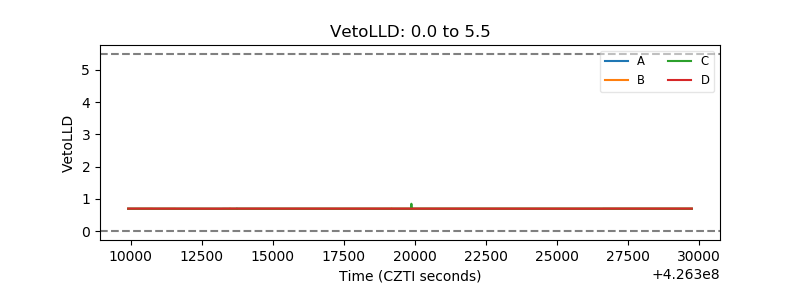 |
| Alpha Counter | 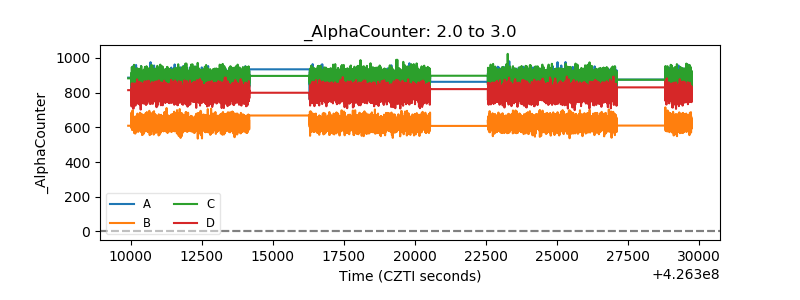 |
| _CPM_Rate | 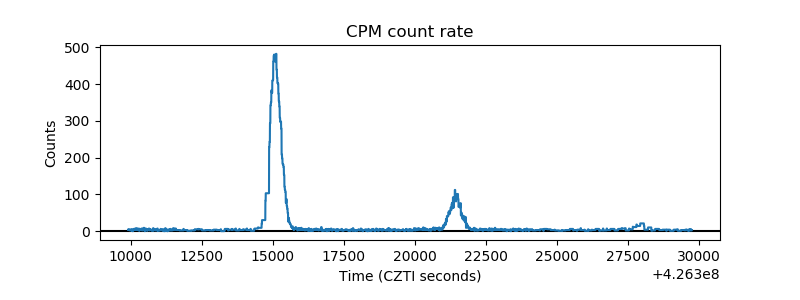 |
| CZT Counter |  |
| +2.5 Volts monitor |  |
| +5 Volts monitor | 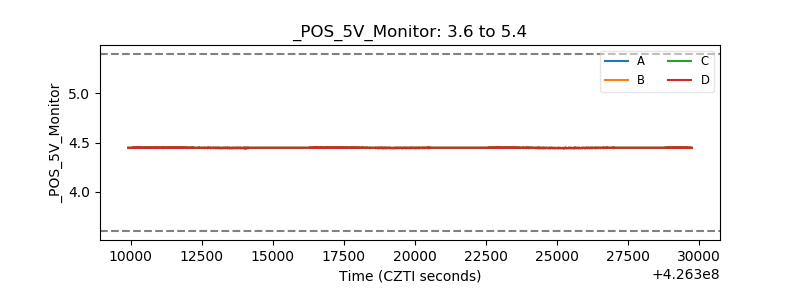 |
| _ROLL_ROT | 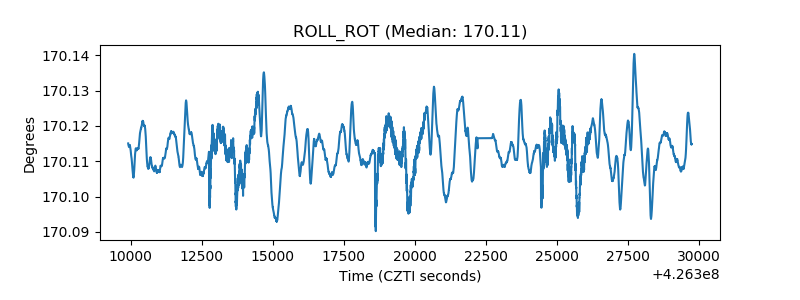 |
| _Roll_DEC | 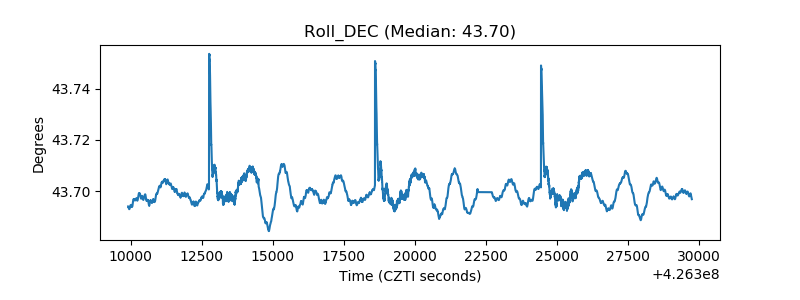 |
| _Roll_RA | 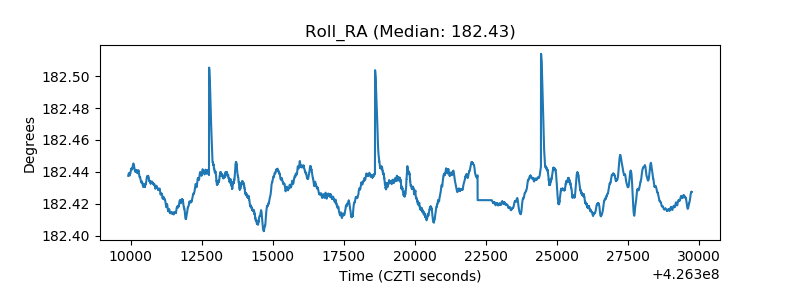 |
| Veto Counter | 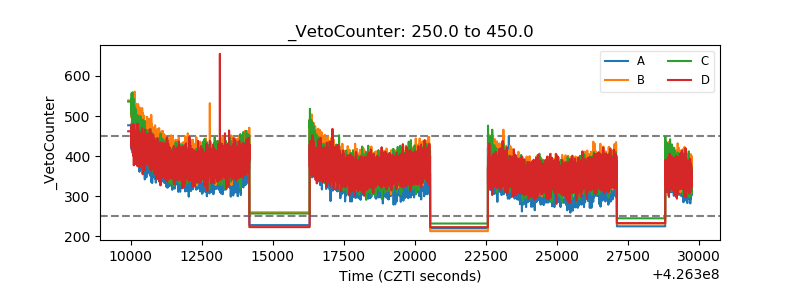 |