| Param | Original file | Final file |
|---|---|---|
| Filename | modeM0/AS1A12_011T26_9000005732_42015cztM0_level2.fits | modeM0/AS1A12_011T26_9000005732_42015cztM0_level2_quad_clean.evt |
| Size (bytes) | 343,126,080 | 93,101,760 |
| Size | 327.2 MB | 88.8 MB |
| Events in quadrant A | 3,592,678 | 612,866 |
| Events in quadrant B | 2,823,276 | 635,589 |
| Events in quadrant C | 2,617,685 | 610,248 |
| Events in quadrant D | 3,218,933 | 557,287 |
| Mode M0 | |||
|---|---|---|---|
| Quadrant | BADHDUFLAG | Total packets | Discarded packets |
| A | 0 | 14066 | 2 |
| B | 0 | 12403 | 2 |
| C | 0 | 11554 | 2 |
| D | 0 | 13577 | 2 |
| Mode M9 | |||
|---|---|---|---|
| Quadrant | BADHDUFLAG | Total packets | Discarded packets |
| A | 0 | 21 | 0 |
| B | 0 | 22 | 0 |
| C | 0 | 22 | 0 |
| D | 0 | 22 | 0 |
| Mode SS | |||
|---|---|---|---|
| Quadrant | BADHDUFLAG | Total packets | Discarded packets |
| A | 0 | 118 | 0 |
| B | 0 | 118 | 0 |
| C | 0 | 118 | 0 |
| D | 0 | 118 | 0 |
| Quadrant | Total seconds | Saturated seconds | Saturation percentage |
|---|---|---|---|
| A | 5762 | 127 | 2.204096% |
| B | 5762 | 43 | 0.746269% |
| C | 5762 | 4 | 0.069420% |
| D | 5762 | 98 | 1.700798% |
Noise dominated data is calculated using 1-second bins in cleaned event files. If a bin has >2000 counts, and if more than 50% of those come from <1% of pixels, then it is considered to be noise-dominated and hence unusable.
| Quadrant | # 1 sec bins | Bins with >0 counts | Bins with >2000 counts | High rate bins dominated by noise | Noise dominated (total time) | Noise dominated (detector-on time) | Marked lightcurve |
|---|---|---|---|---|---|---|---|
| A | 7165 | 5763 | 63 | 63 | 0.88% | 1.09% | 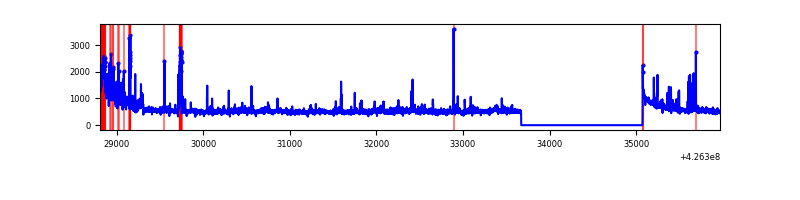 |
| B | 7165 | 5763 | 22 | 22 | 0.31% | 0.38% | 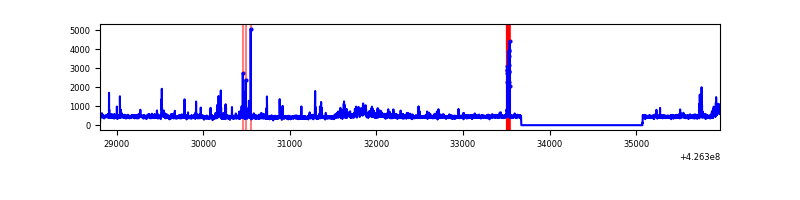 |
| C | 7165 | 5763 | 0 | 0 | 0.00% | 0.00% | 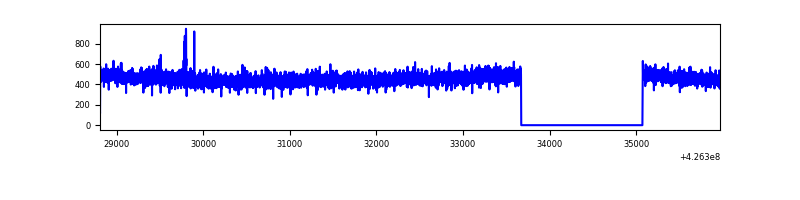 |
| D | 7165 | 5763 | 105 | 105 | 1.47% | 1.82% | 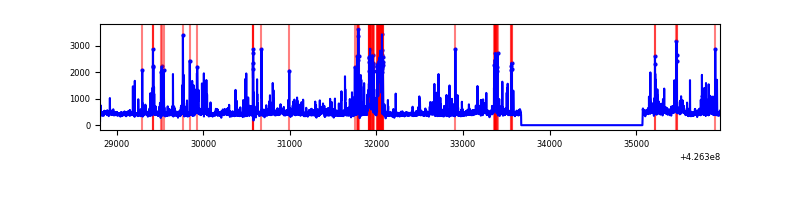 |
Top three noisy pixels from each quadrant. If the there are fewer than three noisy pixels in the level2.evt file, extra rows are filled as -1
| Pixel properties | Quadrant properties | ||||||
|---|---|---|---|---|---|---|---|
| Quadrant | DetID | PixID | Counts | Sigma | Mean | Median | Sigma |
| A | 10 | 83 | 609894 | 4812.66 | 616 | 603 | 126.6 |
| A | 15 | 223 | 474322 | 3741.8 | 616 | 603 | 126.6 |
| A | 12 | 189 | 83503 | 654.81 | 616 | 603 | 126.6 |
| B | 15 | 54 | 109503 | 912.3 | 614 | 596 | 119.4 |
| B | 3 | 112 | 95771 | 797.27 | 614 | 596 | 119.4 |
| B | 0 | 190 | 73277 | 608.84 | 614 | 596 | 119.4 |
| C | 15 | 214 | 242154 | 1715.15 | 604 | 606 | 140.8 |
| C | 12 | 249 | 9903 | 66.01 | 604 | 606 | 140.8 |
| C | 8 | 79 | 4881 | 30.36 | 604 | 606 | 140.8 |
| D | 13 | 249 | 298556 | 2008.37 | 604 | 587 | 148.4 |
| D | 12 | 233 | 103655 | 694.7 | 604 | 587 | 148.4 |
| D | 11 | 6 | 102215 | 684.99 | 604 | 587 | 148.4 |
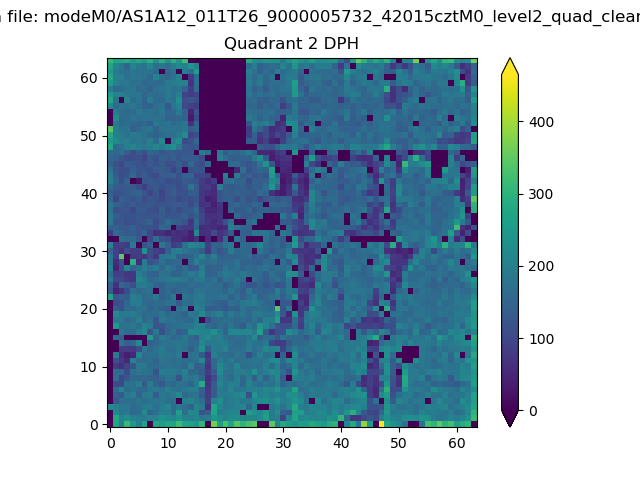
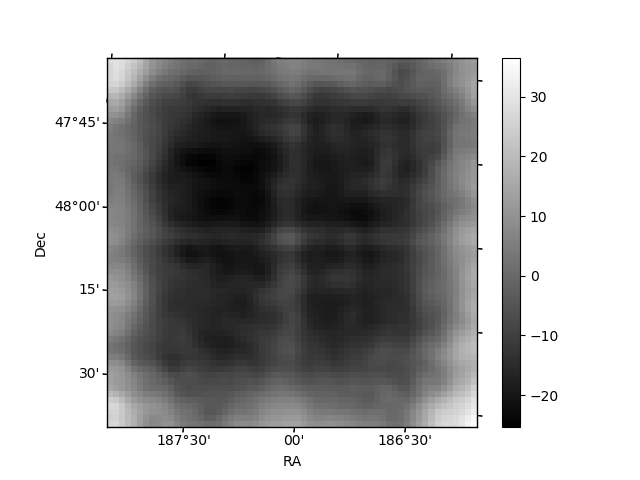
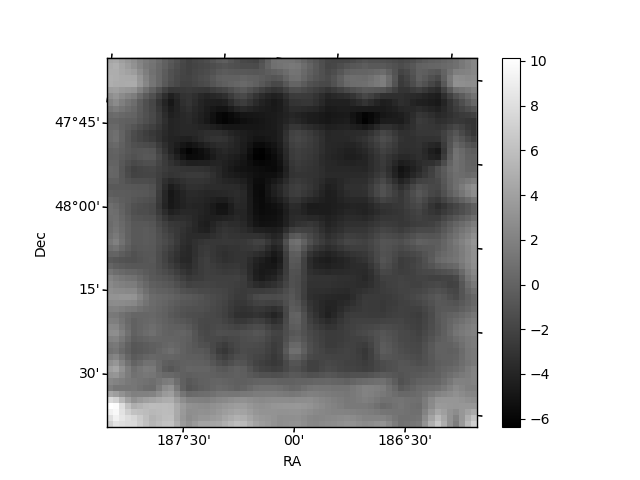
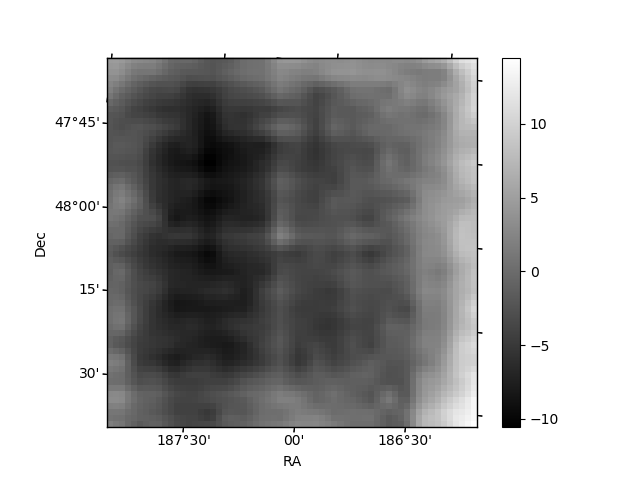
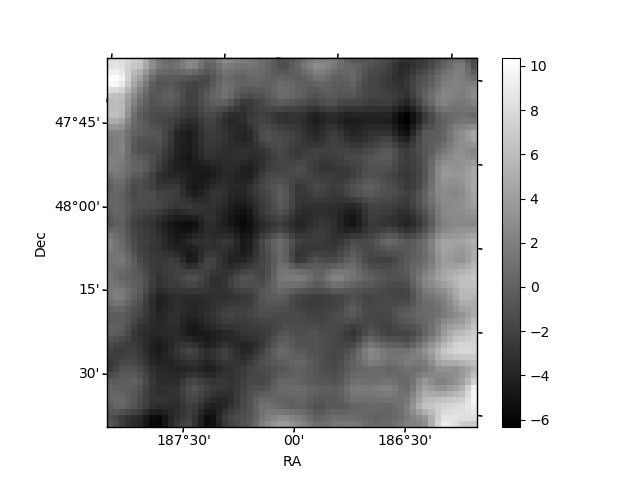
Histogram calculated using DETX and DETY for each event in the final _common_clean file
| Quadrant A | 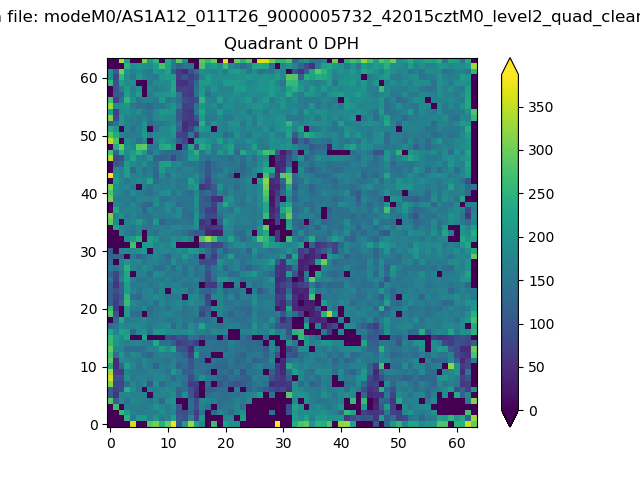 |
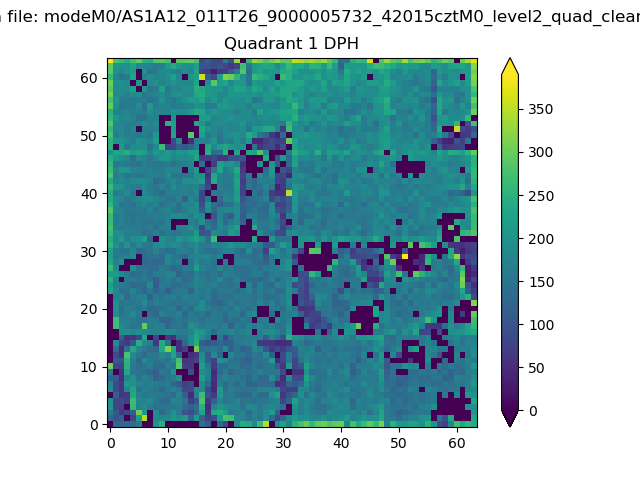 |
Quadrant B |
|---|---|---|---|
| Quadrant D | 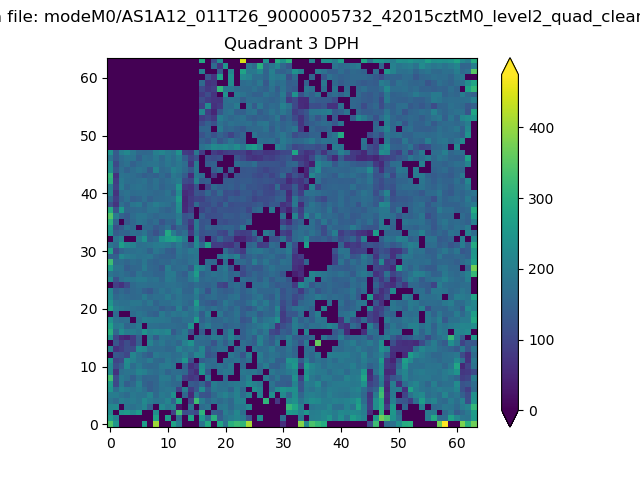 |
 |
Quadrant C |
| Plot type | Count rate plots | Images |
|---|---|---|
| Comparison with Poisson distribution Blue bars denote a histogram of data divided into 1 sec bins. Red curve is a Poisson curve with rate = median count rate of data. |
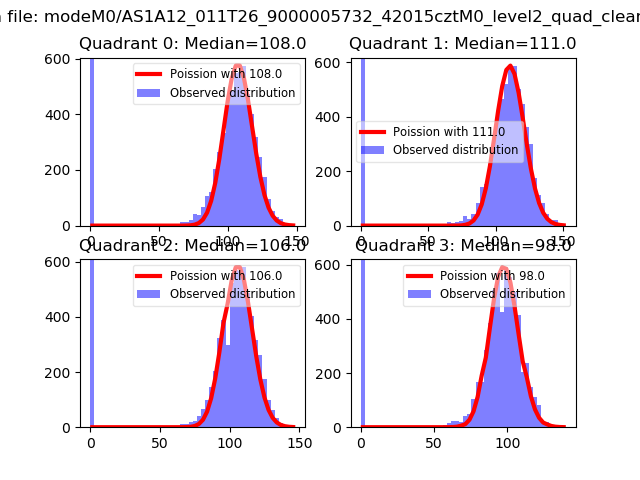 |
 |
| Quadrant-wise count rates Data is divided into 100 sec bins |
 |
|
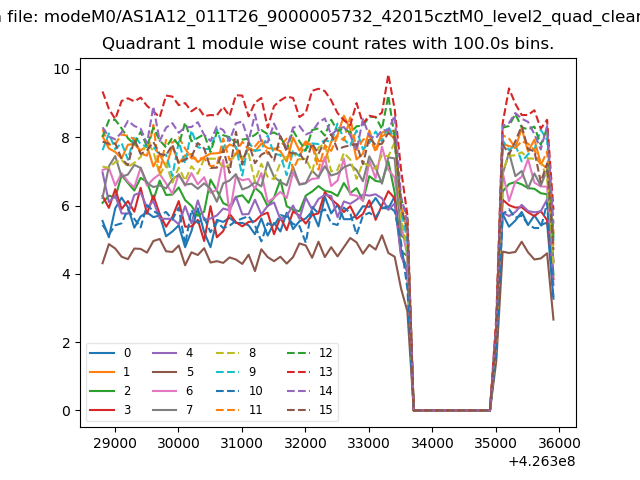
| Module-wise count rates for Quadrant A Data is divided into 100 sec bins |
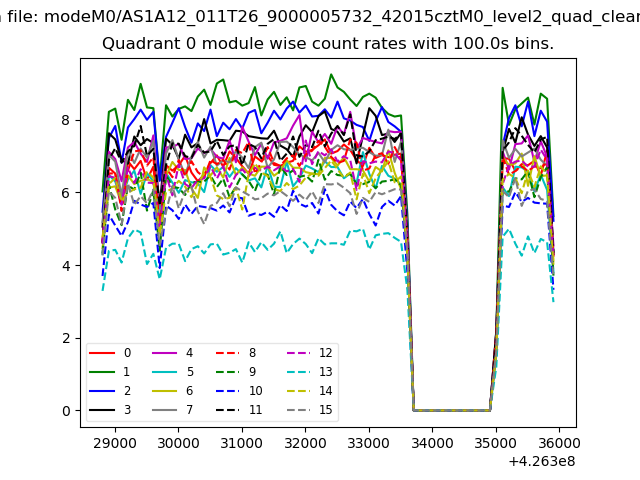 |
 |
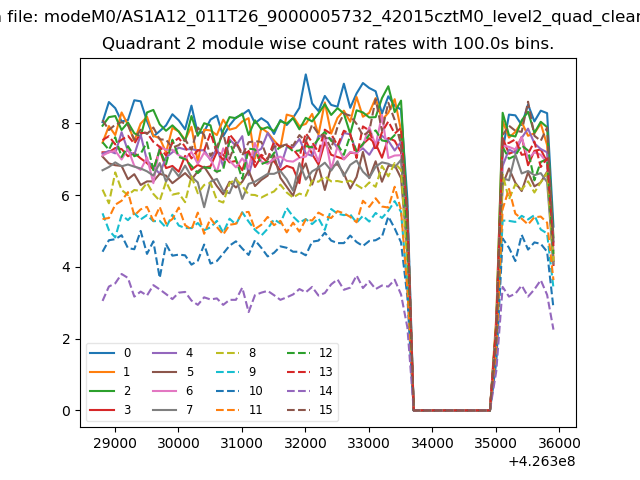
| Module-wise count rates for Quadrant B Data is divided into 100 sec bins |
 |
 |
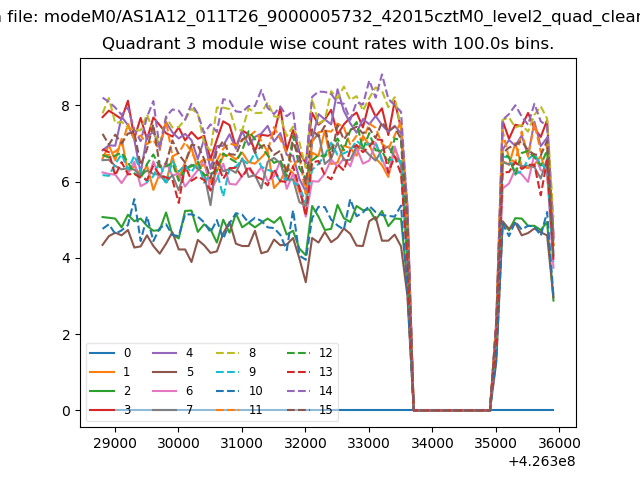
| Module-wise count rates for Quadrant C Data is divided into 100 sec bins |
 |
 |
| Module-wise count rates for Quadrant D Data is divided into 100 sec bins |
 |
 |
| Parameter | Plot |
|---|---|
| CZT HV Monitor | 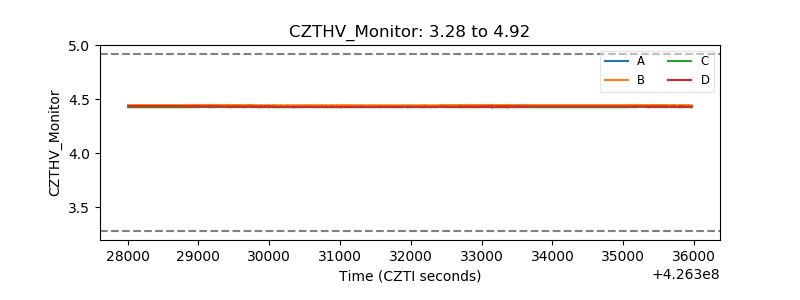 |
| D_VDD | 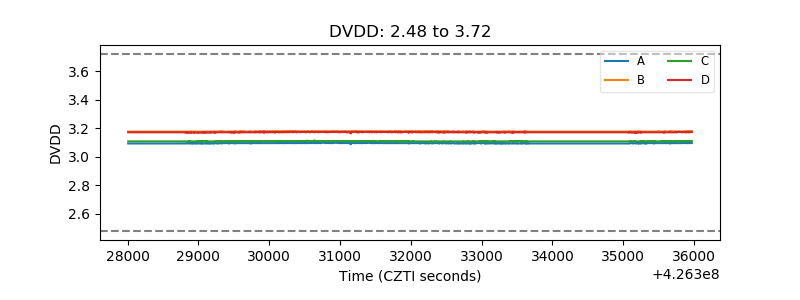 |
| Temperature 1 | 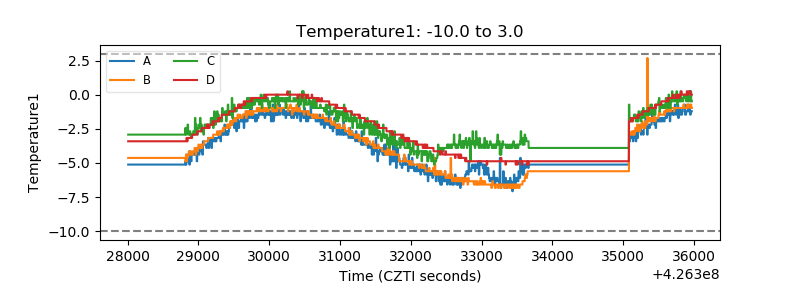 |
| Veto HV Monitor | 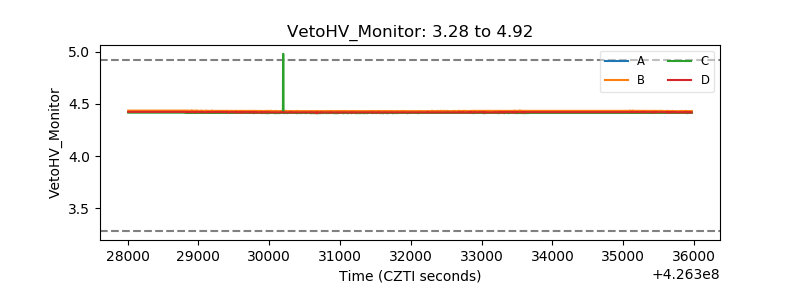 |
| Veto LLD | 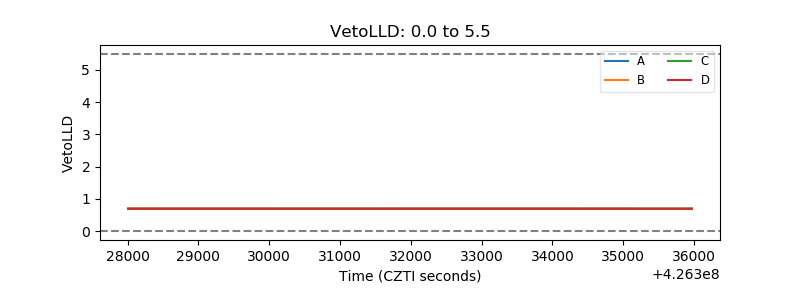 |
| Alpha Counter | 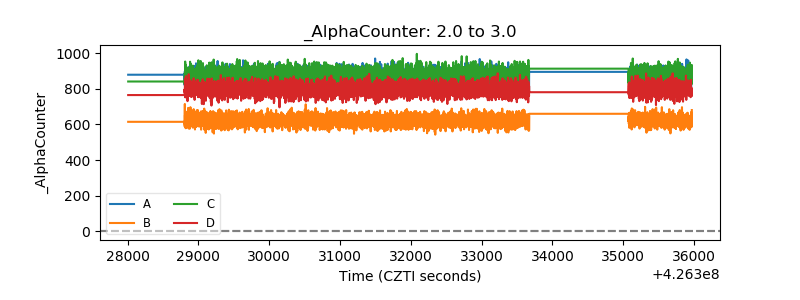 |
| _CPM_Rate | 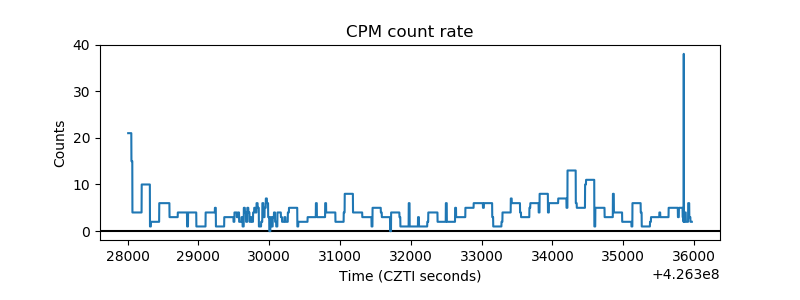 |
| CZT Counter | 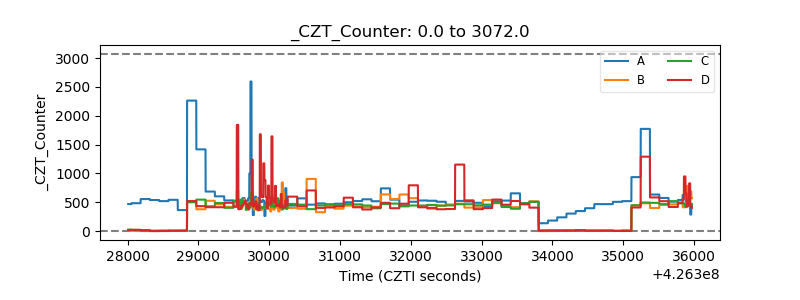 |
| +2.5 Volts monitor | 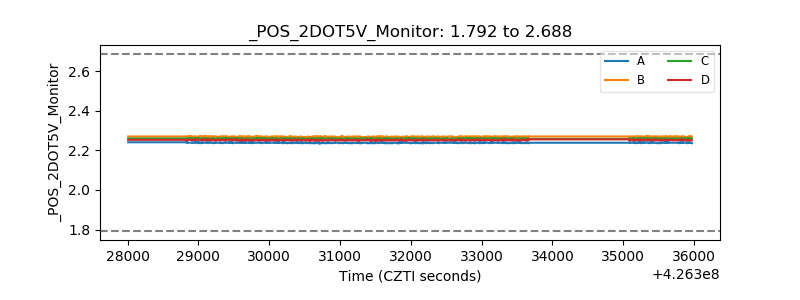 |
| +5 Volts monitor | 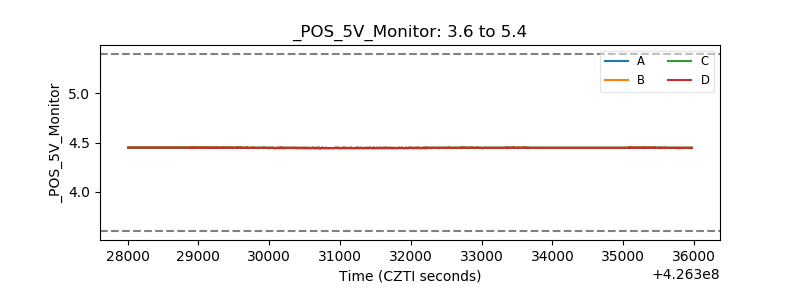 |
| _ROLL_ROT | 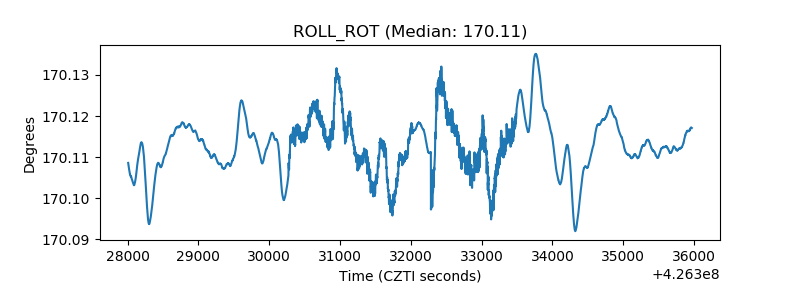 |
| _Roll_DEC | 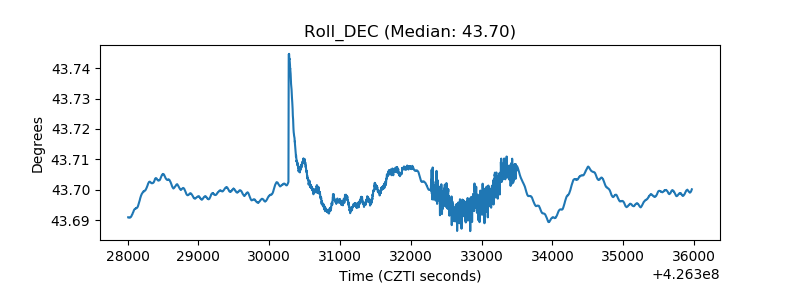 |
| _Roll_RA | 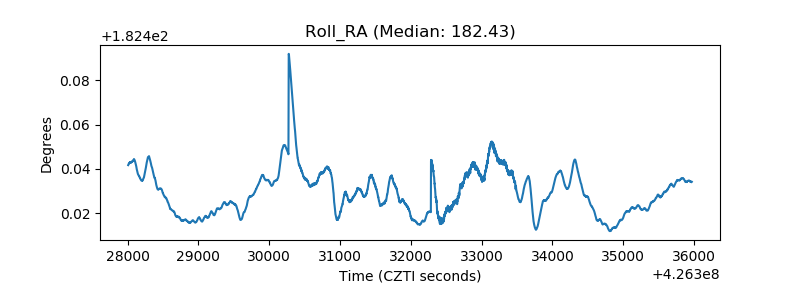 |
| Veto Counter | 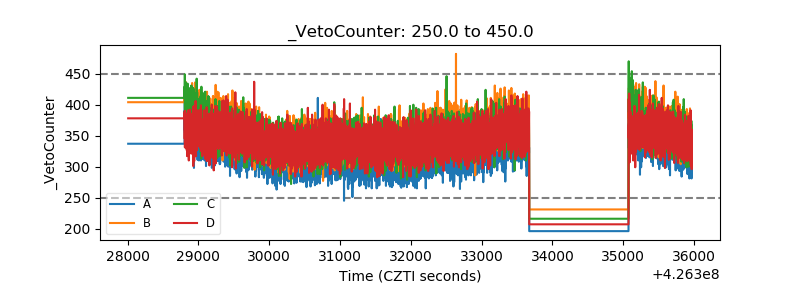 |