| Param | Original file | Final file |
|---|---|---|
| Filename | modeM0/AS1A12_011T26_9000005732_42016cztM0_level2.fits | modeM0/AS1A12_011T26_9000005732_42016cztM0_level2_quad_clean.evt |
| Size (bytes) | 439,565,760 | 115,974,720 |
| Size | 419.2 MB | 110.6 MB |
| Events in quadrant A | 4,481,772 | 766,783 |
| Events in quadrant B | 3,495,653 | 792,513 |
| Events in quadrant C | 3,364,974 | 759,916 |
| Events in quadrant D | 4,370,962 | 692,235 |
| Mode M0 | |||
|---|---|---|---|
| Quadrant | BADHDUFLAG | Total packets | Discarded packets |
| A | 0 | 17600 | 5 |
| B | 0 | 15444 | 2 |
| C | 0 | 14618 | 2 |
| D | 0 | 17937 | 2 |
| Mode M9 | |||
|---|---|---|---|
| Quadrant | BADHDUFLAG | Total packets | Discarded packets |
| A | 0 | 17 | 0 |
| B | 0 | 18 | 0 |
| C | 0 | 18 | 0 |
| D | 0 | 18 | 0 |
| Mode SS | |||
|---|---|---|---|
| Quadrant | BADHDUFLAG | Total packets | Discarded packets |
| A | 0 | 146 | 0 |
| B | 0 | 146 | 0 |
| C | 0 | 146 | 0 |
| D | 0 | 146 | 0 |
| Quadrant | Total seconds | Saturated seconds | Saturation percentage |
|---|---|---|---|
| A | 7178 | 120 | 1.671775% |
| B | 7179 | 27 | 0.376097% |
| C | 7179 | 13 | 0.181084% |
| D | 7179 | 119 | 1.657612% |
Noise dominated data is calculated using 1-second bins in cleaned event files. If a bin has >2000 counts, and if more than 50% of those come from <1% of pixels, then it is considered to be noise-dominated and hence unusable.
| Quadrant | # 1 sec bins | Bins with >0 counts | Bins with >2000 counts | High rate bins dominated by noise | Noise dominated (total time) | Noise dominated (detector-on time) | Marked lightcurve |
|---|---|---|---|---|---|---|---|
| A | 19854 | 7180 | 82 | 82 | 0.41% | 1.14% | 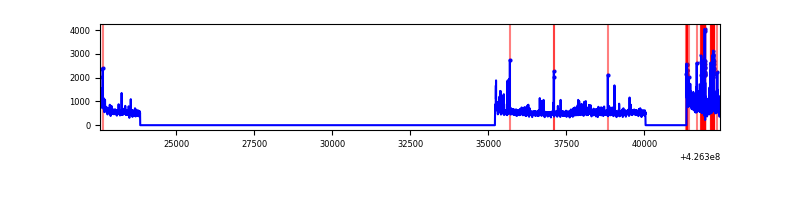 |
| B | 19853 | 7181 | 9 | 9 | 0.05% | 0.13% | 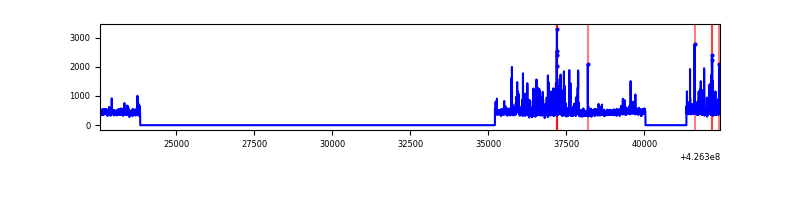 |
| C | 19853 | 7181 | 11 | 11 | 0.06% | 0.15% | 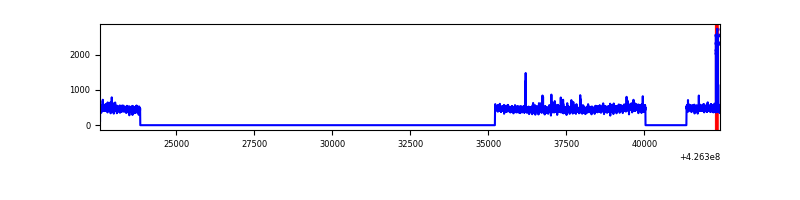 |
| D | 19853 | 7181 | 100 | 100 | 0.50% | 1.39% | 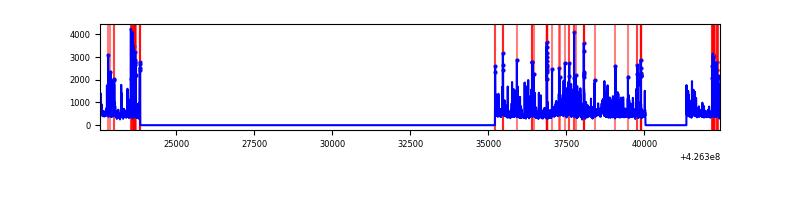 |
Top three noisy pixels from each quadrant. If the there are fewer than three noisy pixels in the level2.evt file, extra rows are filled as -1
| Pixel properties | Quadrant properties | ||||||
|---|---|---|---|---|---|---|---|
| Quadrant | DetID | PixID | Counts | Sigma | Mean | Median | Sigma |
| A | 10 | 83 | 763856 | 4790.44 | 772 | 754 | 159.3 |
| A | 15 | 223 | 608923 | 3817.84 | 772 | 754 | 159.3 |
| A | 12 | 189 | 89038 | 554.21 | 772 | 754 | 159.3 |
| B | 0 | 190 | 214446 | 1452.85 | 768 | 747 | 147.1 |
| B | 4 | 171 | 164780 | 1115.19 | 768 | 747 | 147.1 |
| B | 3 | 112 | 36930 | 245.99 | 768 | 747 | 147.1 |
| C | 15 | 214 | 303777 | 1714.81 | 755 | 758 | 176.7 |
| C | 9 | 54 | 66505 | 372.07 | 755 | 758 | 176.7 |
| C | 8 | 79 | 14296 | 76.61 | 755 | 758 | 176.7 |
| D | 13 | 249 | 447474 | 2443.58 | 752 | 729 | 182.8 |
| D | 2 | 120 | 233332 | 1272.28 | 752 | 729 | 182.8 |
| D | 2 | 249 | 159165 | 866.6 | 752 | 729 | 182.8 |
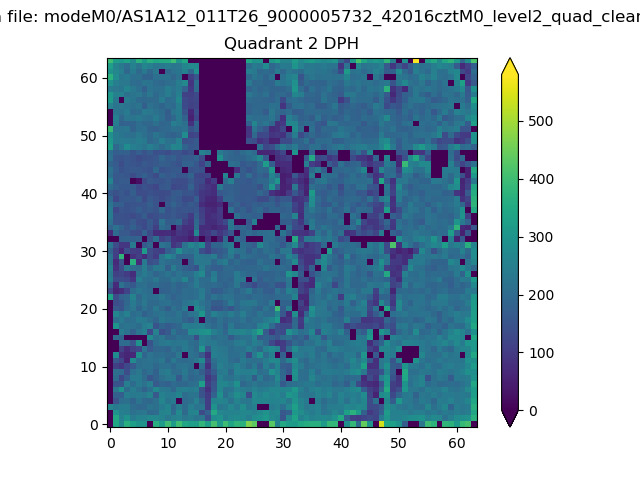
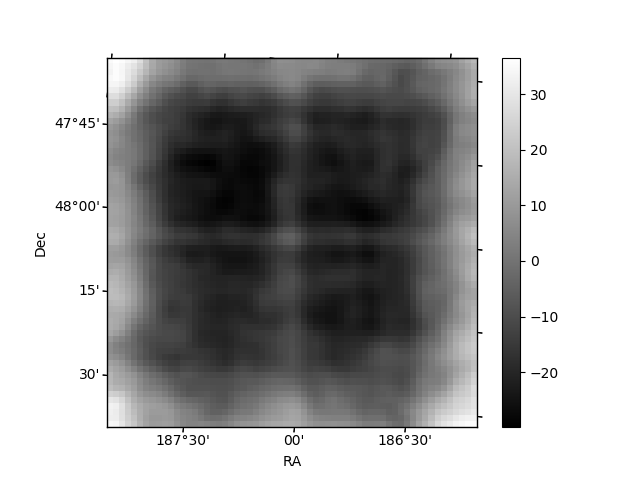
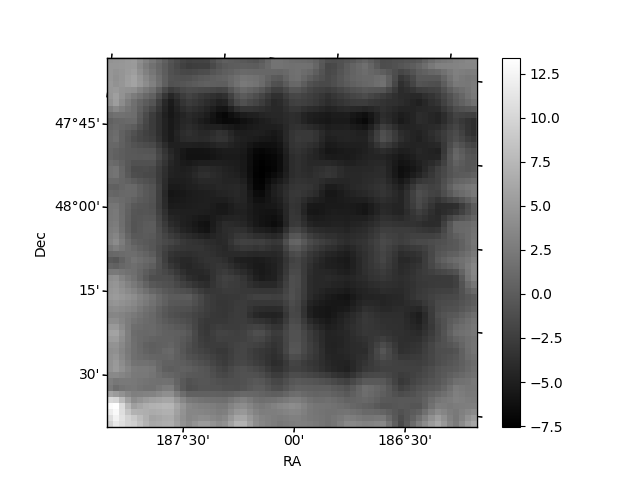
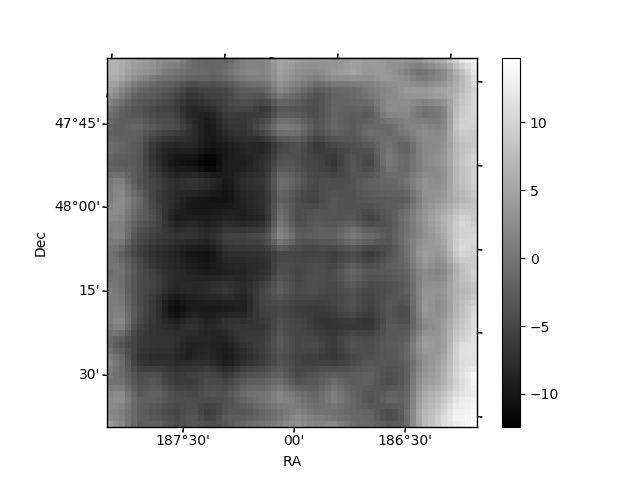
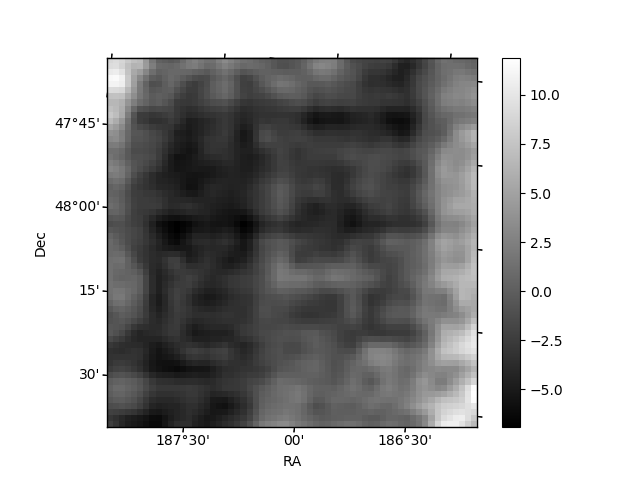
Histogram calculated using DETX and DETY for each event in the final _common_clean file
| Quadrant A | 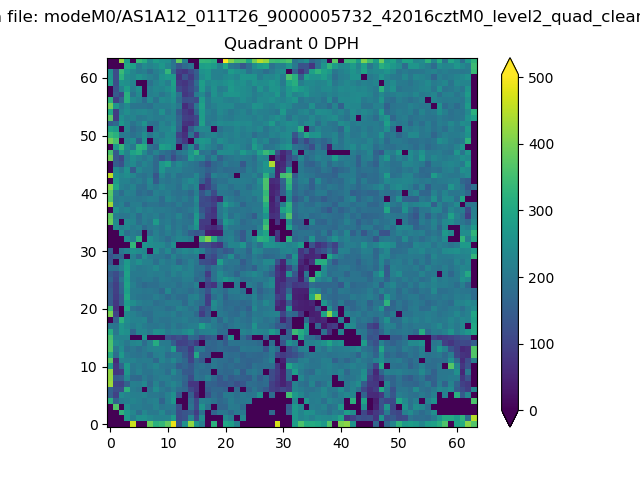 |
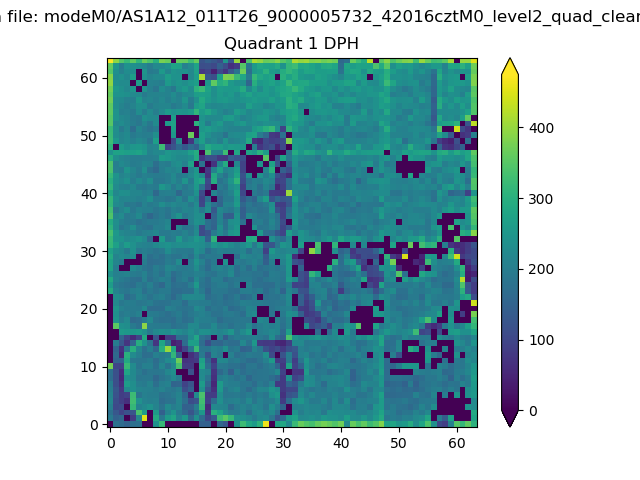 |
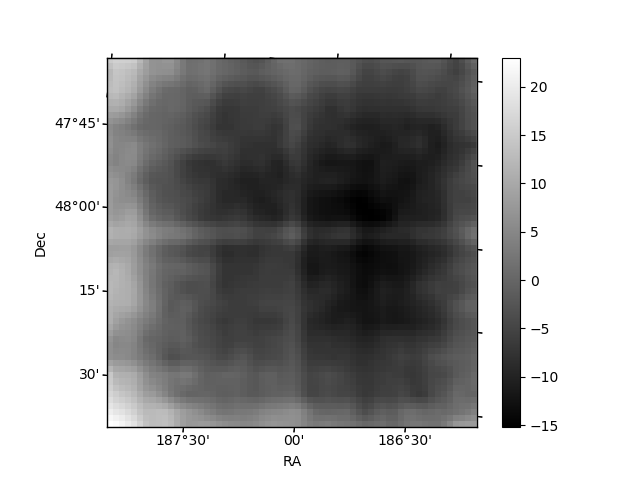
Quadrant B |
|---|---|---|---|
| Quadrant D | 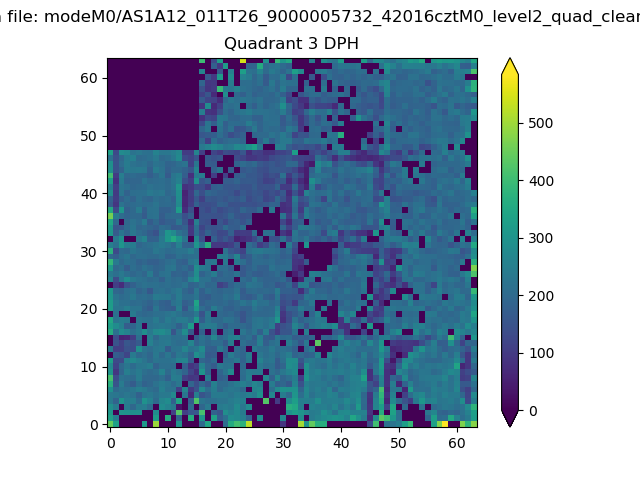 |
 |
Quadrant C |
| Plot type | Count rate plots | Images |
|---|---|---|
| Comparison with Poisson distribution Blue bars denote a histogram of data divided into 1 sec bins. Red curve is a Poisson curve with rate = median count rate of data. |
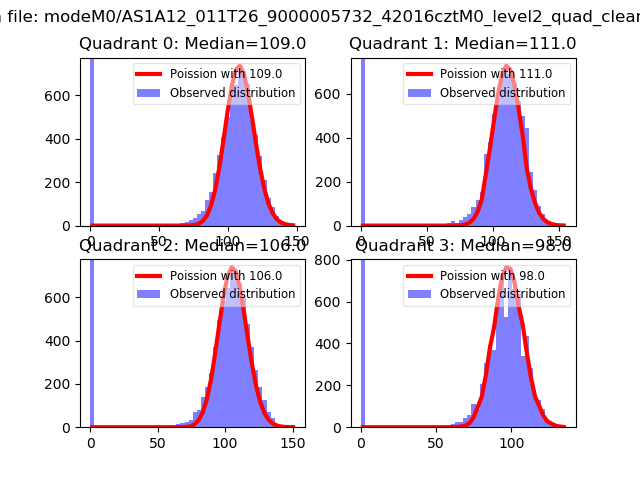 |
 |
| Quadrant-wise count rates Data is divided into 100 sec bins |
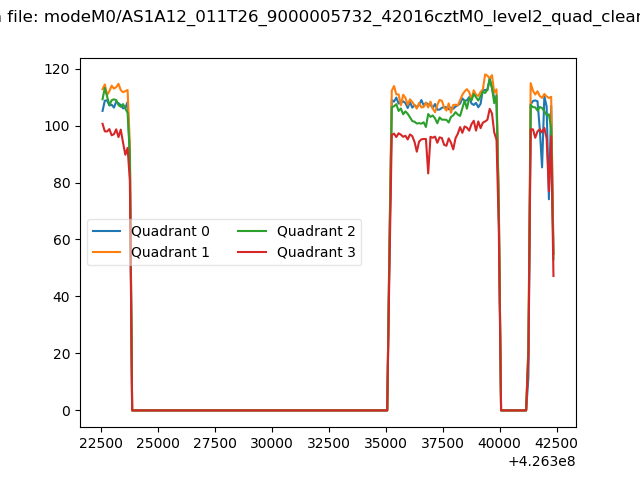 |
|
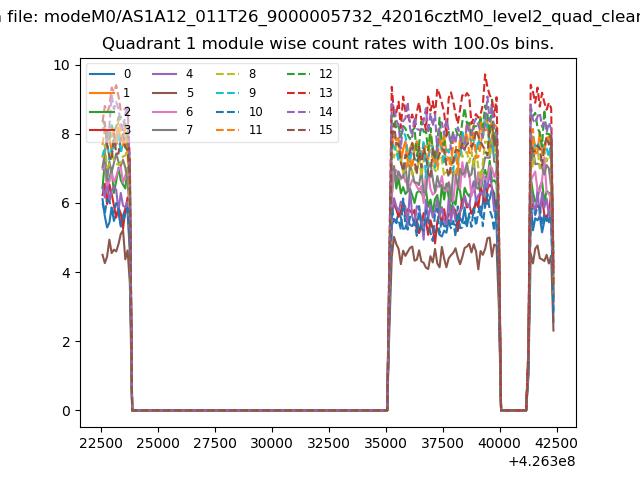
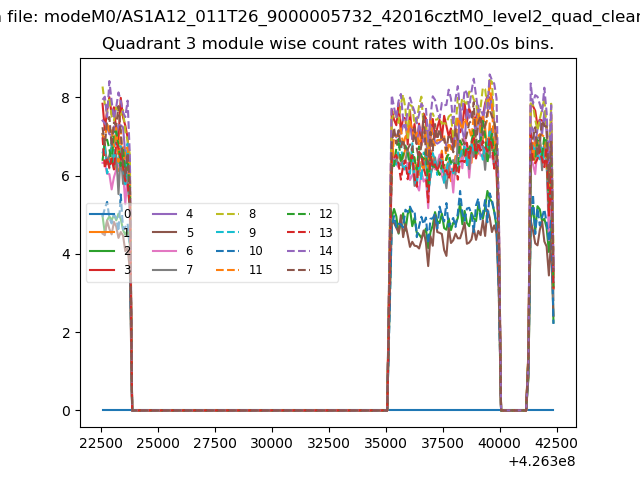
| Module-wise count rates for Quadrant A Data is divided into 100 sec bins |
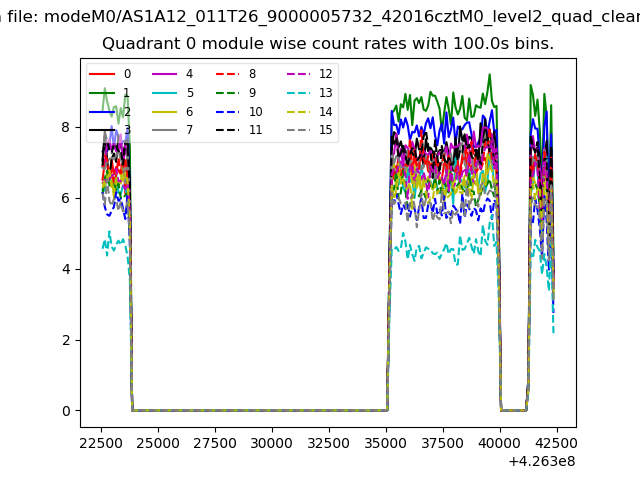 |
 |
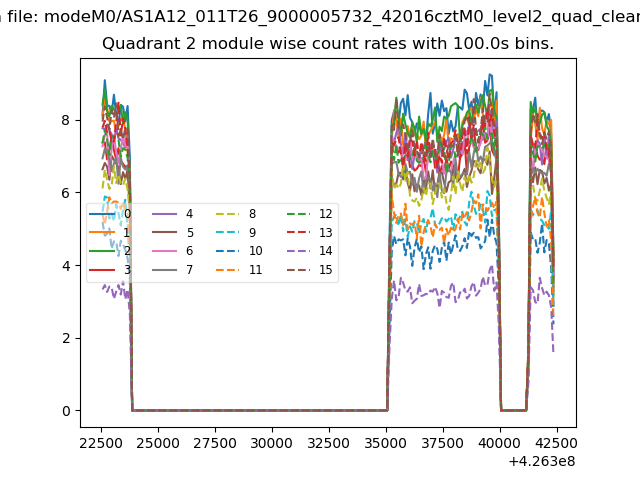
| Module-wise count rates for Quadrant B Data is divided into 100 sec bins |
 |
 |
| Module-wise count rates for Quadrant C Data is divided into 100 sec bins |
 |
 |
| Module-wise count rates for Quadrant D Data is divided into 100 sec bins |
 |
 |
| Parameter | Plot |
|---|---|
| CZT HV Monitor | 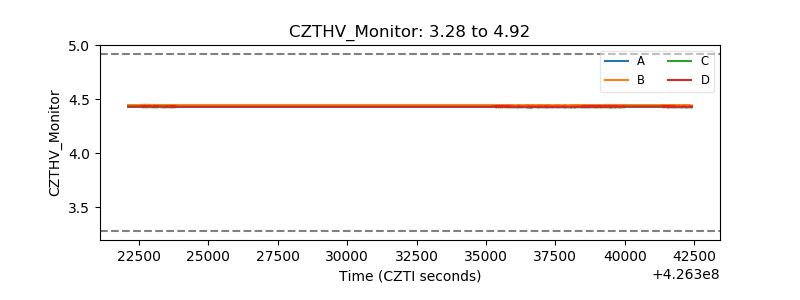 |
| D_VDD | 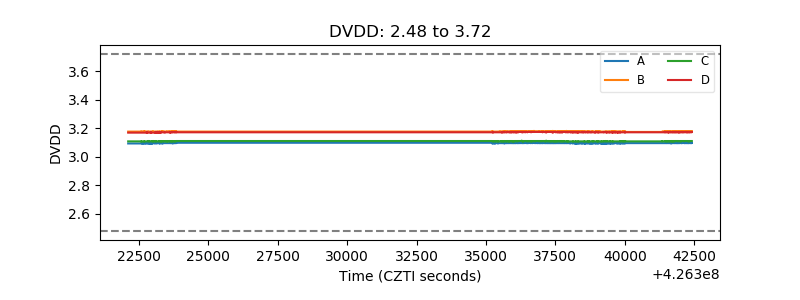 |
| Temperature 1 | 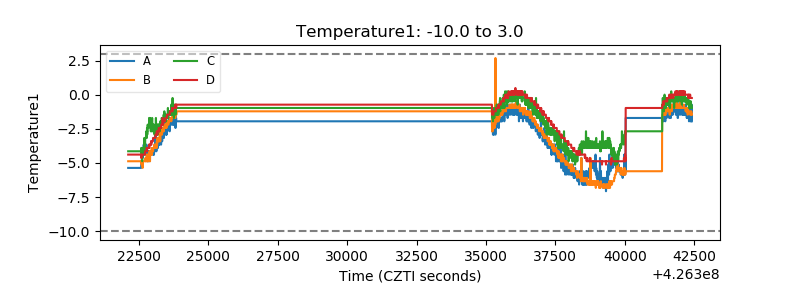 |
| Veto HV Monitor | 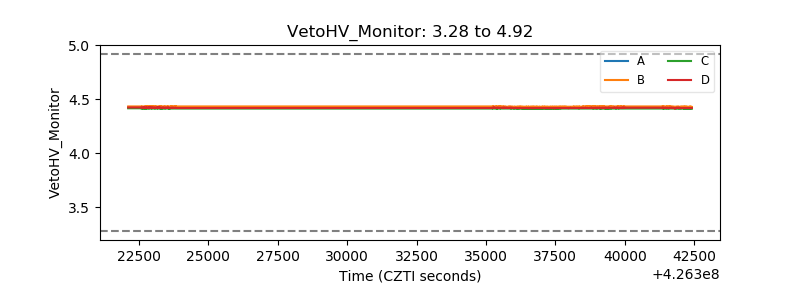 |
| Veto LLD | 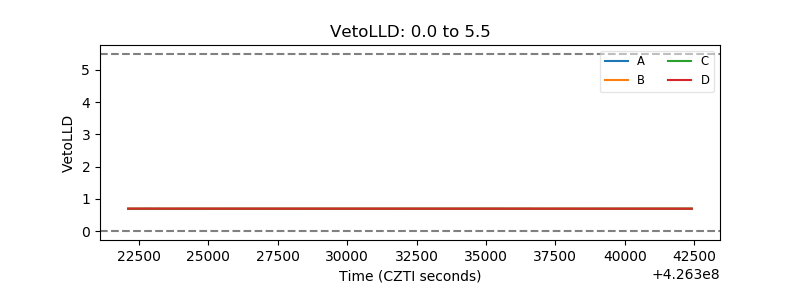 |
| Alpha Counter | 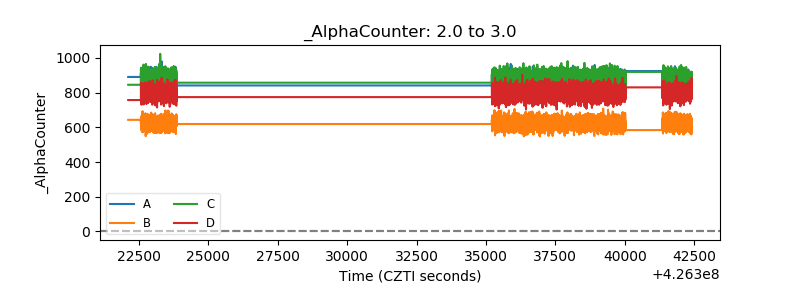 |
| _CPM_Rate | 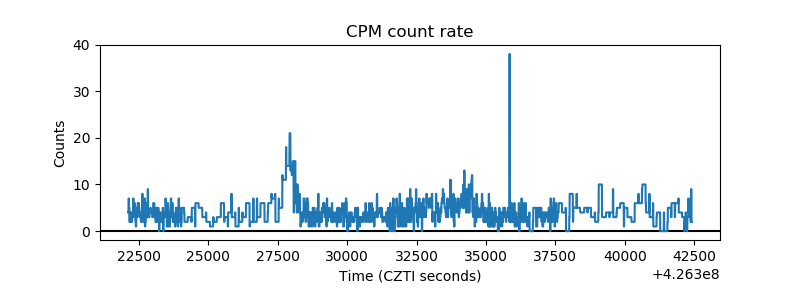 |
| CZT Counter | 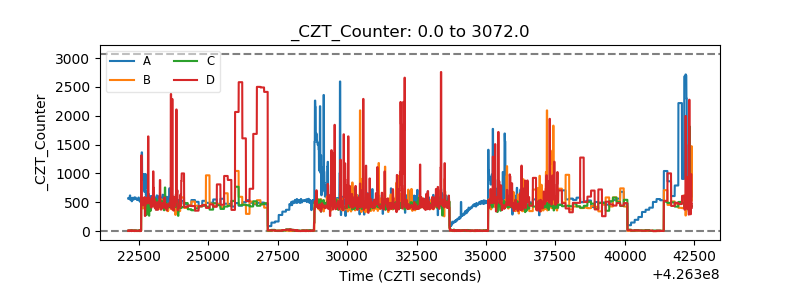 |
| +2.5 Volts monitor | 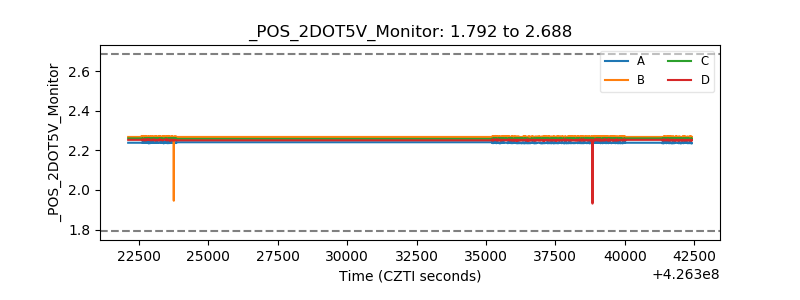 |
| +5 Volts monitor |  |
| _ROLL_ROT | 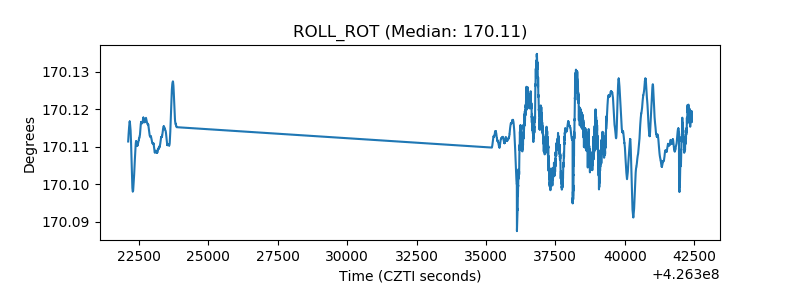 |
| _Roll_DEC | 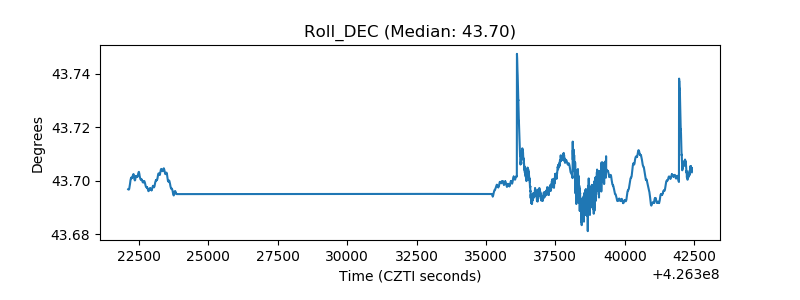 |
| _Roll_RA | 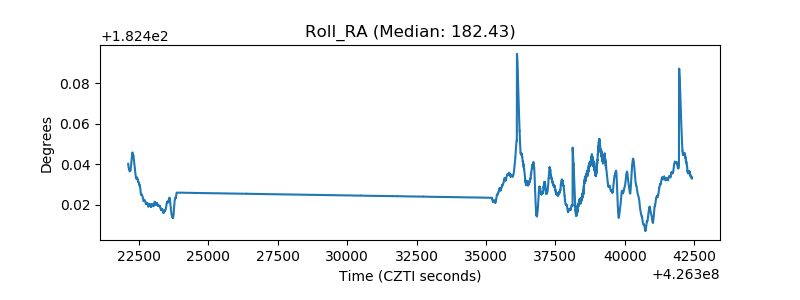 |
| Veto Counter | 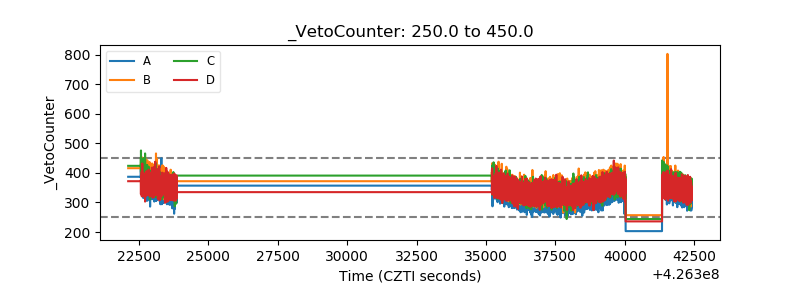 |