| Param | Original file | Final file |
|---|---|---|
| Filename | modeM0/AS1A12_011T26_9000005732_42019cztM0_level2.fits | modeM0/AS1A12_011T26_9000005732_42019cztM0_level2_quad_clean.evt |
| Size (bytes) | 431,628,480 | 105,814,080 |
| Size | 411.6 MB | 100.9 MB |
| Events in quadrant A | 4,843,241 | 692,817 |
| Events in quadrant B | 3,350,950 | 723,485 |
| Events in quadrant C | 3,130,441 | 694,010 |
| Events in quadrant D | 4,135,669 | 629,681 |
| Mode M0 | |||
|---|---|---|---|
| Quadrant | BADHDUFLAG | Total packets | Discarded packets |
| A | 0 | 18636 | 2 |
| B | 0 | 14641 | 2 |
| C | 0 | 13619 | 2 |
| D | 0 | 16925 | 2 |
| Mode M9 | |||
|---|---|---|---|
| Quadrant | BADHDUFLAG | Total packets | Discarded packets |
| A | 0 | 16 | 0 |
| B | 0 | 16 | 0 |
| C | 0 | 17 | 0 |
| D | 0 | 17 | 0 |
| Mode SS | |||
|---|---|---|---|
| Quadrant | BADHDUFLAG | Total packets | Discarded packets |
| A | 0 | 134 | 0 |
| B | 0 | 134 | 0 |
| C | 0 | 134 | 0 |
| D | 0 | 134 | 0 |
| Quadrant | Total seconds | Saturated seconds | Saturation percentage |
|---|---|---|---|
| A | 6654 | 261 | 3.922453% |
| B | 6654 | 42 | 0.631199% |
| C | 6654 | 15 | 0.225428% |
| D | 6654 | 213 | 3.201082% |
Noise dominated data is calculated using 1-second bins in cleaned event files. If a bin has >2000 counts, and if more than 50% of those come from <1% of pixels, then it is considered to be noise-dominated and hence unusable.
| Quadrant | # 1 sec bins | Bins with >0 counts | Bins with >2000 counts | High rate bins dominated by noise | Noise dominated (total time) | Noise dominated (detector-on time) | Marked lightcurve |
|---|---|---|---|---|---|---|---|
| A | 7968 | 6654 | 201 | 201 | 2.52% | 3.02% | 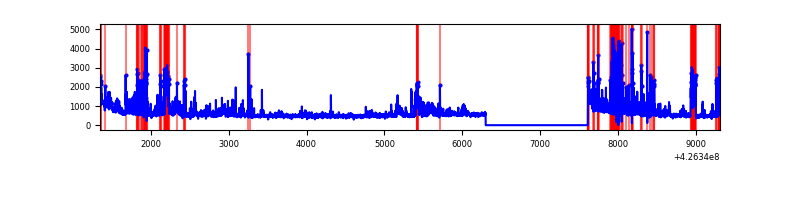 |
| B | 7968 | 6655 | 21 | 21 | 0.26% | 0.32% | 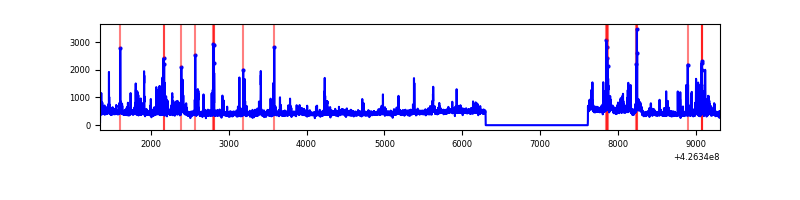 |
| C | 7968 | 6655 | 11 | 11 | 0.14% | 0.17% | 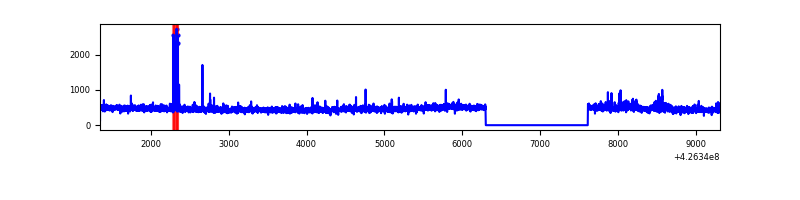 |
| D | 7968 | 6655 | 193 | 193 | 2.42% | 2.90% | 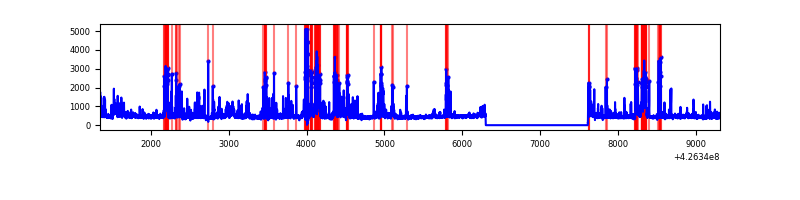 |
Top three noisy pixels from each quadrant. If the there are fewer than three noisy pixels in the level2.evt file, extra rows are filled as -1
| Pixel properties | Quadrant properties | ||||||
|---|---|---|---|---|---|---|---|
| Quadrant | DetID | PixID | Counts | Sigma | Mean | Median | Sigma |
| A | 15 | 223 | 1233859 | 8645.3 | 698 | 682 | 142.6 |
| A | 10 | 83 | 698360 | 4891.14 | 698 | 682 | 142.6 |
| A | 12 | 189 | 155772 | 1087.27 | 698 | 682 | 142.6 |
| B | 0 | 190 | 223286 | 1647.3 | 704 | 684 | 135.1 |
| B | 4 | 171 | 193720 | 1428.51 | 704 | 684 | 135.1 |
| B | 0 | 186 | 86918 | 638.15 | 704 | 684 | 135.1 |
| C | 15 | 214 | 278843 | 1705.4 | 695 | 698 | 163.1 |
| C | 9 | 54 | 73269 | 444.96 | 695 | 698 | 163.1 |
| C | 8 | 79 | 43769 | 264.08 | 695 | 698 | 163.1 |
| D | 2 | 249 | 587937 | 3461.18 | 689 | 669 | 169.7 |
| D | 5 | 32 | 182633 | 1072.44 | 689 | 669 | 169.7 |
| D | 13 | 249 | 156856 | 920.52 | 689 | 669 | 169.7 |
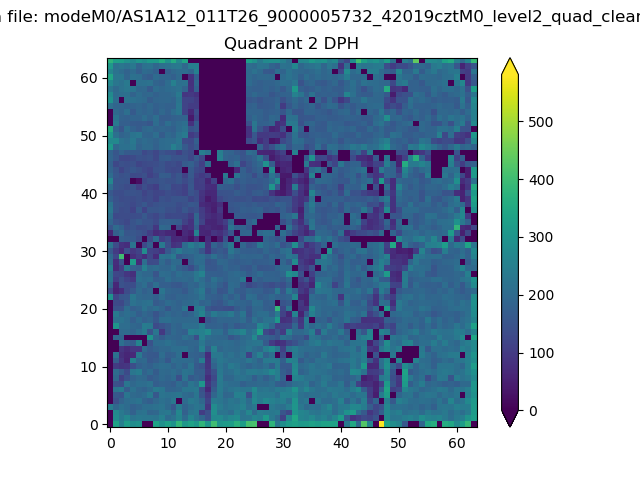
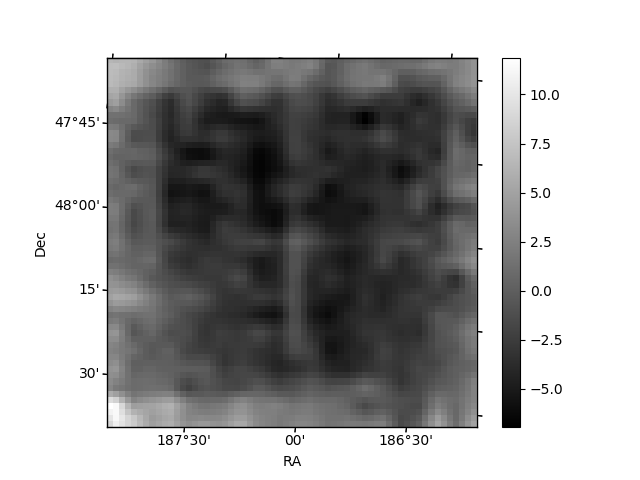
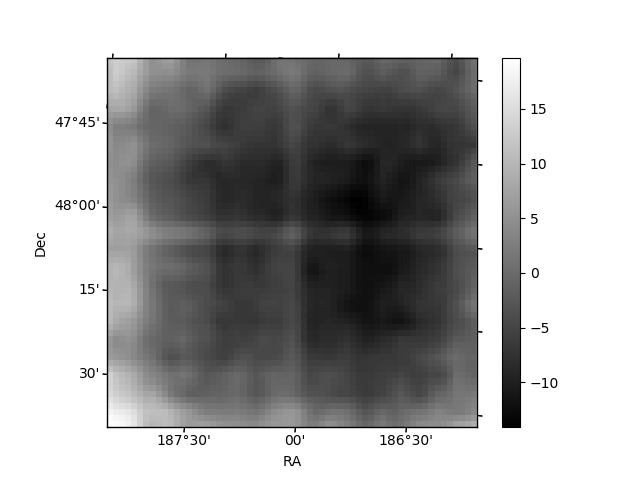
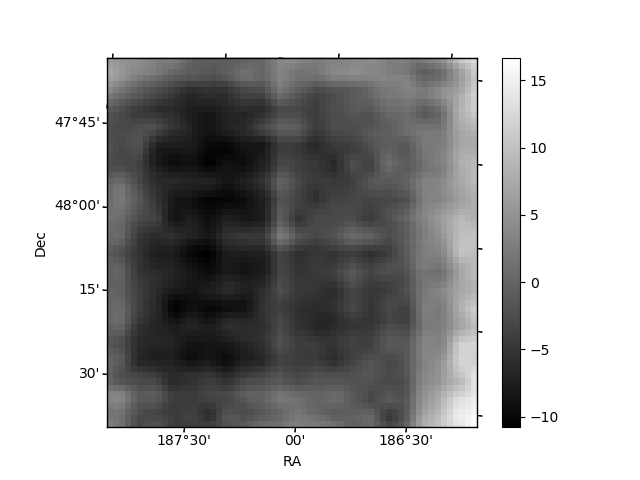
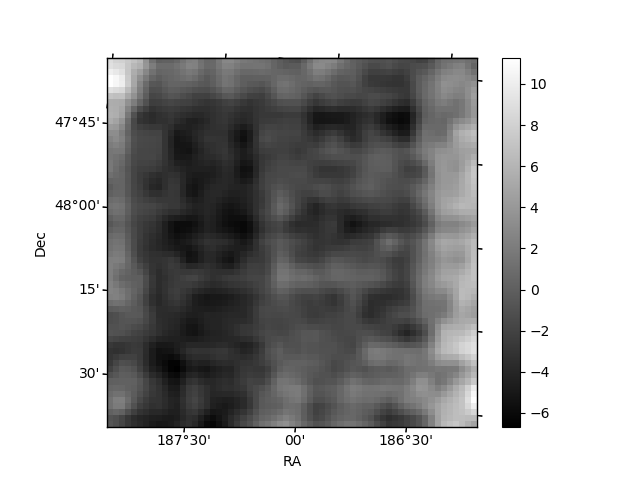
Histogram calculated using DETX and DETY for each event in the final _common_clean file
| Quadrant A | 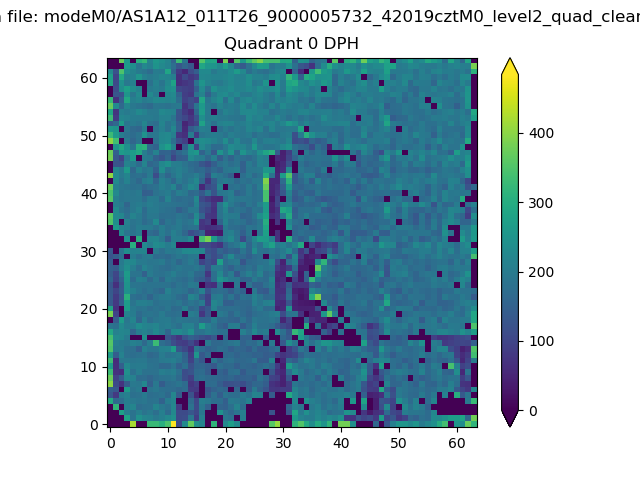 |
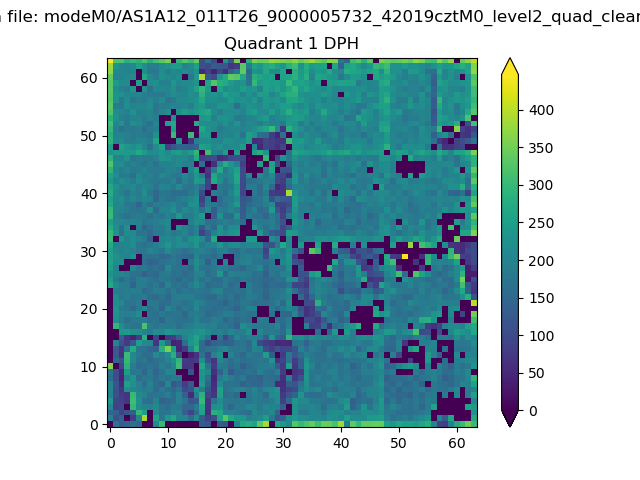 |
Quadrant B |
|---|---|---|---|
| Quadrant D | 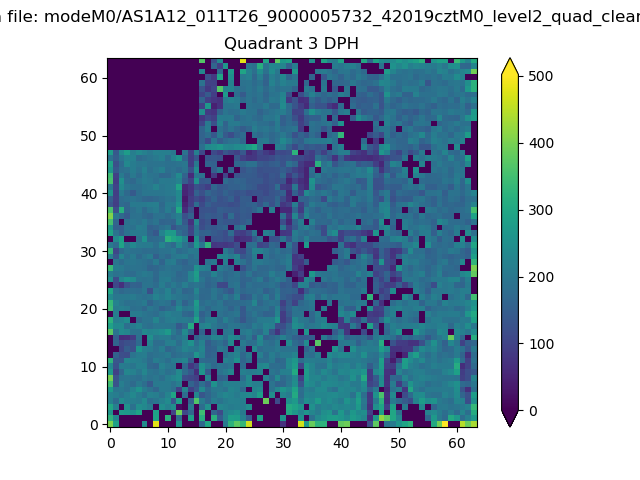 |
 |
Quadrant C |
| Plot type | Count rate plots | Images |
|---|---|---|
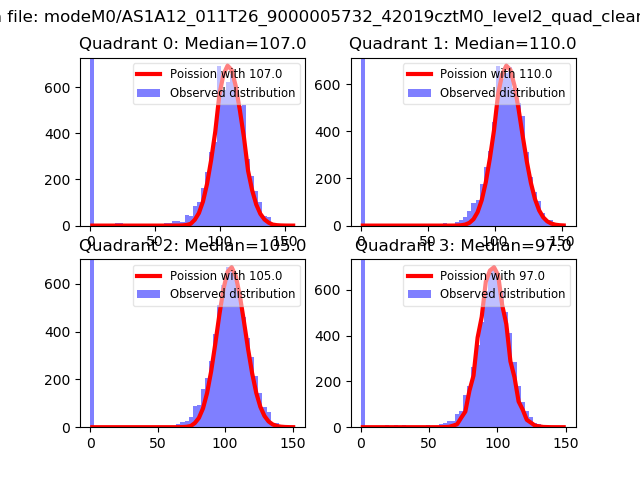
| Comparison with Poisson distribution Blue bars denote a histogram of data divided into 1 sec bins. Red curve is a Poisson curve with rate = median count rate of data. |
 |
 |
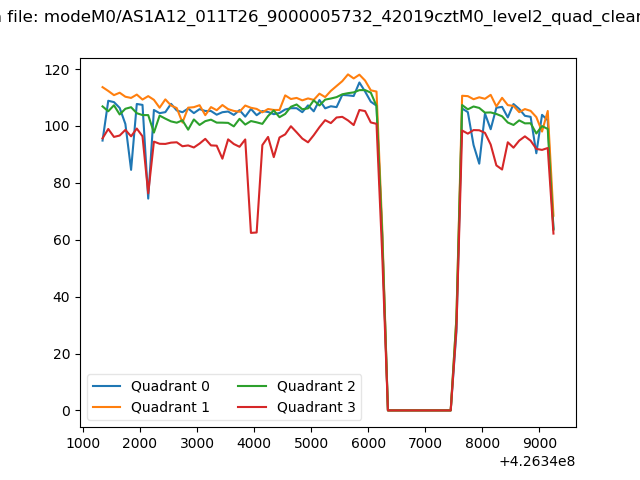
| Quadrant-wise count rates Data is divided into 100 sec bins |
 |
|
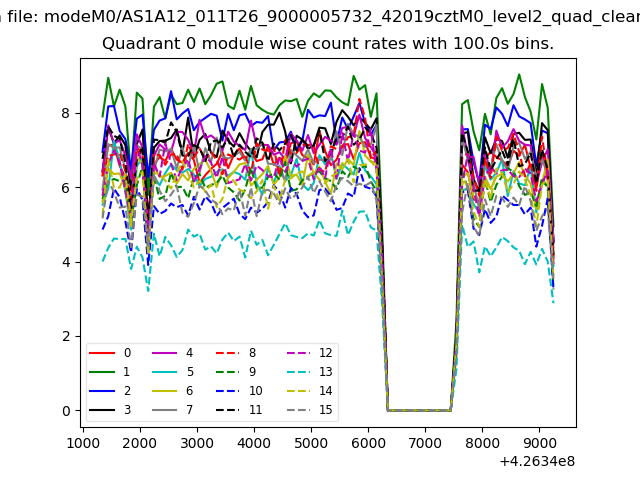
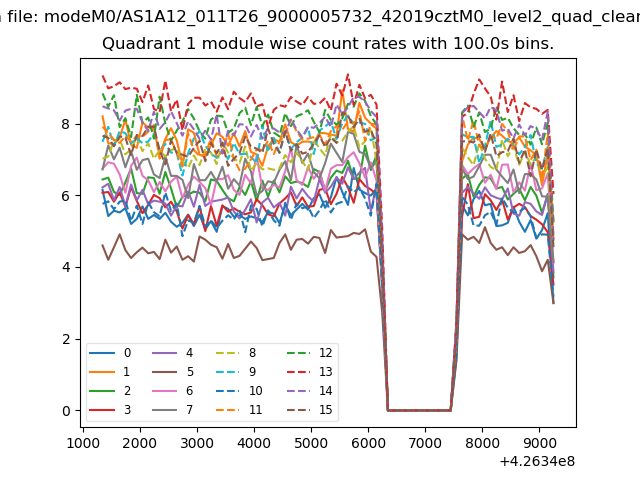
| Module-wise count rates for Quadrant A Data is divided into 100 sec bins |
 |
 |
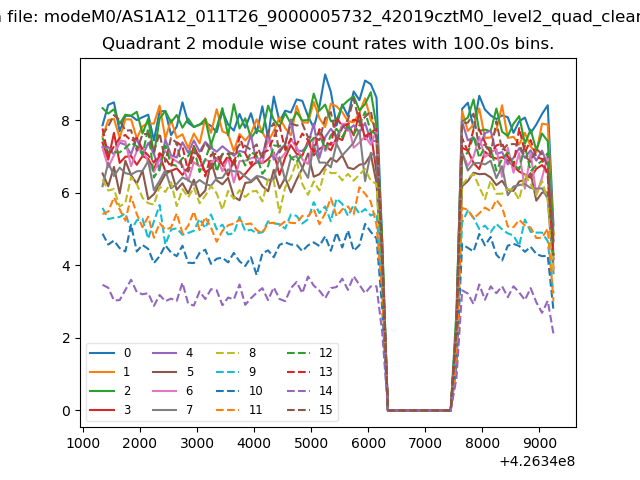
| Module-wise count rates for Quadrant B Data is divided into 100 sec bins |
 |
 |
| Module-wise count rates for Quadrant C Data is divided into 100 sec bins |
 |
 |
| Module-wise count rates for Quadrant D Data is divided into 100 sec bins |
 |
 |
| Parameter | Plot |
|---|---|
| CZT HV Monitor | 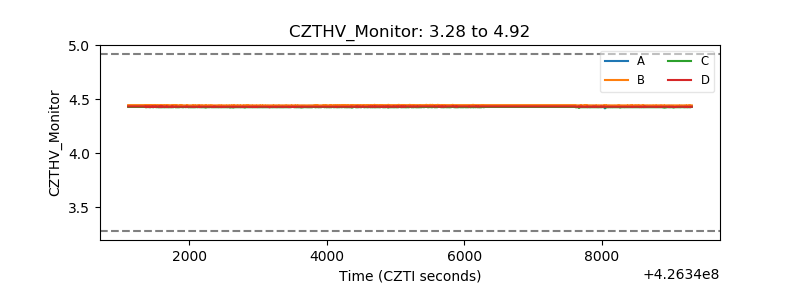 |
| D_VDD | 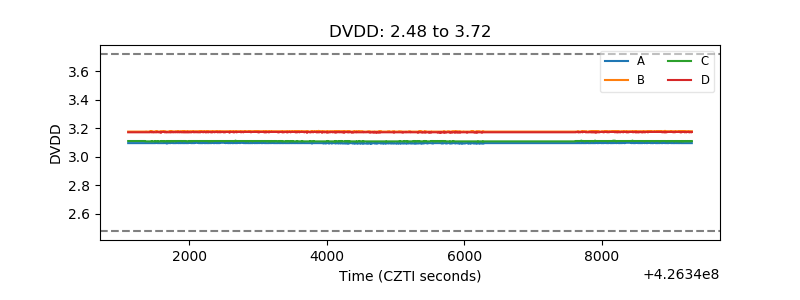 |
| Temperature 1 | 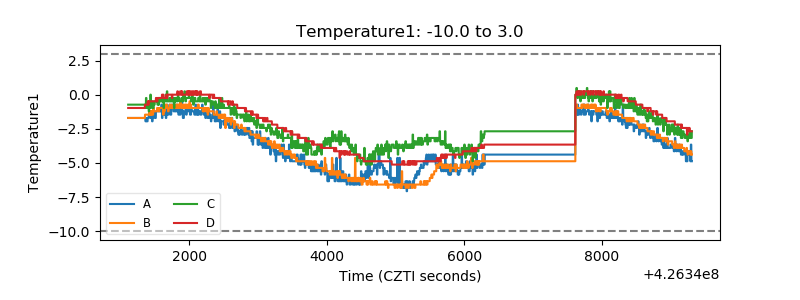 |
| Veto HV Monitor | 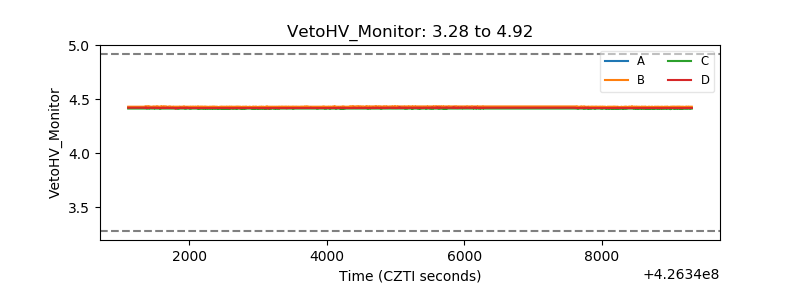 |
| Veto LLD |  |
| Alpha Counter | 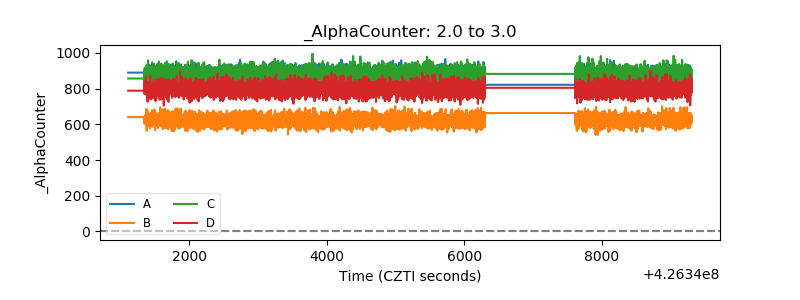 |
| _CPM_Rate | 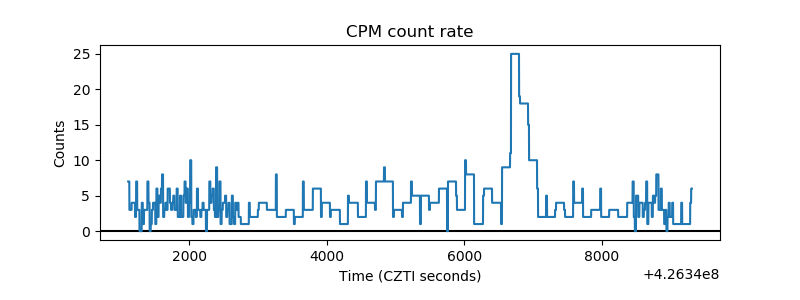 |
| CZT Counter | 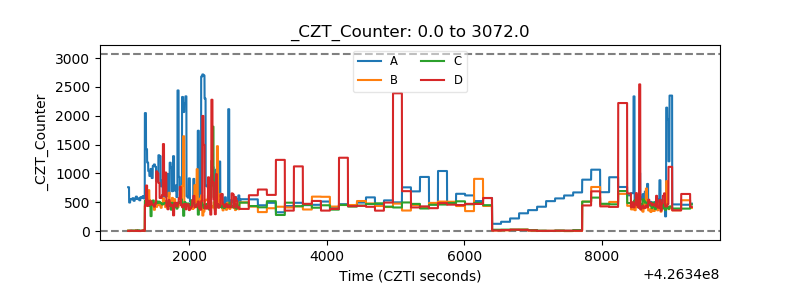 |
| +2.5 Volts monitor | 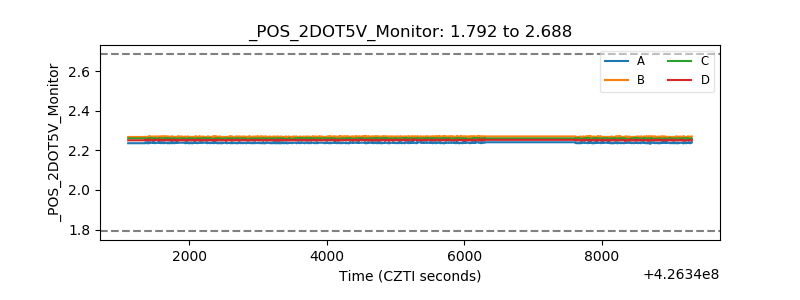 |
| +5 Volts monitor |  |
| _ROLL_ROT | 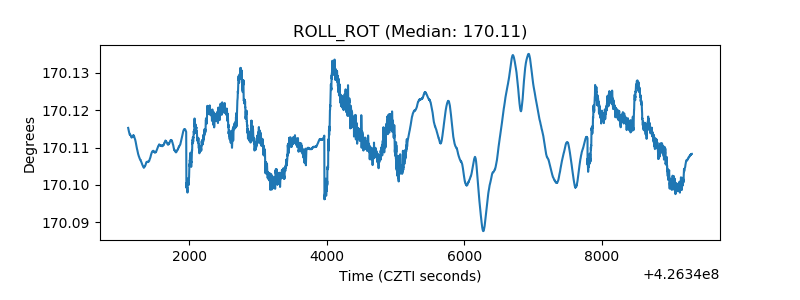 |
| _Roll_DEC | 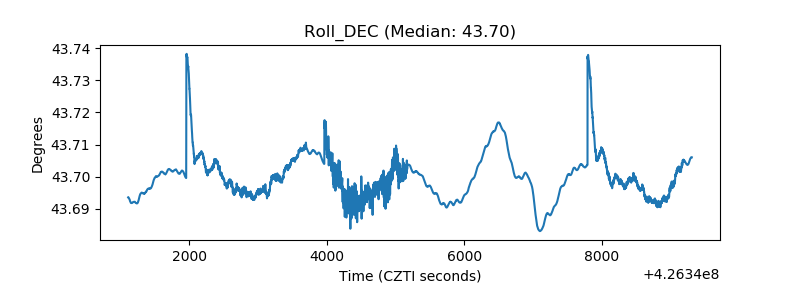 |
| _Roll_RA | 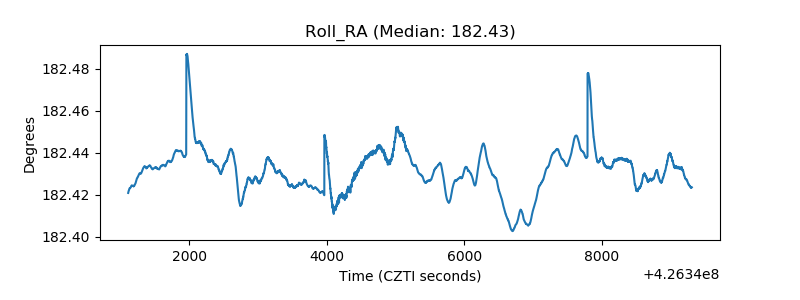 |
| Veto Counter | 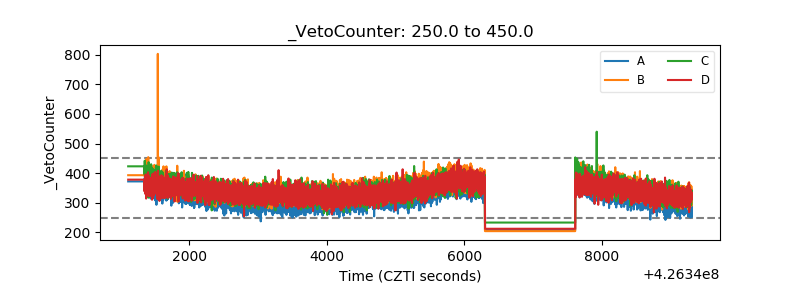 |