| Param | Original file | Final file |
|---|---|---|
| Filename | modeM0/AS1A12_006T12_9000005734_42019cztM0_level2.fits | modeM0/AS1A12_006T12_9000005734_42019cztM0_level2_quad_clean.evt |
| Size (bytes) | 551,108,160 | 125,542,080 |
| Size | 525.6 MB | 119.7 MB |
| Events in quadrant A | 7,510,428 | 742,040 |
| Events in quadrant B | 3,769,904 | 894,492 |
| Events in quadrant C | 3,862,948 | 840,520 |
| Events in quadrant D | 4,632,083 | 764,747 |
| Mode M0 | |||
|---|---|---|---|
| Quadrant | BADHDUFLAG | Total packets | Discarded packets |
| A | 0 | 27451 | 2 |
| B | 0 | 16745 | 2 |
| C | 0 | 16642 | 2 |
| D | 0 | 19541 | 3 |
| Mode M9 | |||
|---|---|---|---|
| Quadrant | BADHDUFLAG | Total packets | Discarded packets |
| A | 0 | 29 | 0 |
| B | 0 | 29 | 0 |
| C | 0 | 29 | 0 |
| D | 0 | 29 | 0 |
| Mode SS | |||
|---|---|---|---|
| Quadrant | BADHDUFLAG | Total packets | Discarded packets |
| A | 0 | 166 | 0 |
| B | 0 | 166 | 0 |
| C | 0 | 166 | 0 |
| D | 0 | 166 | 0 |
| Quadrant | Total seconds | Saturated seconds | Saturation percentage |
|---|---|---|---|
| A | 8043 | 1307 | 16.250155% |
| B | 8043 | 33 | 0.410295% |
| C | 8043 | 7 | 0.087032% |
| D | 8042 | 219 | 2.723203% |
Noise dominated data is calculated using 1-second bins in cleaned event files. If a bin has >2000 counts, and if more than 50% of those come from <1% of pixels, then it is considered to be noise-dominated and hence unusable.
| Quadrant | # 1 sec bins | Bins with >0 counts | Bins with >2000 counts | High rate bins dominated by noise | Noise dominated (total time) | Noise dominated (detector-on time) | Marked lightcurve |
|---|---|---|---|---|---|---|---|
| A | 10968 | 8045 | 1109 | 1109 | 10.11% | 13.78% | 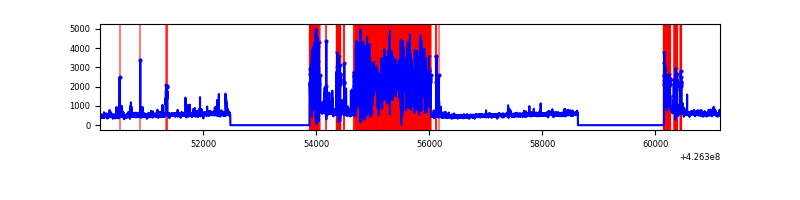 |
| B | 10968 | 8045 | 13 | 13 | 0.12% | 0.16% | 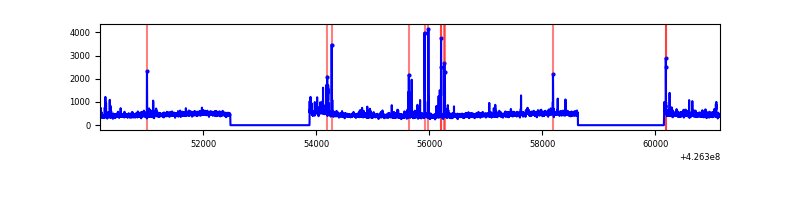 |
| C | 10968 | 8045 | 0 | 0 | 0.00% | 0.00% | 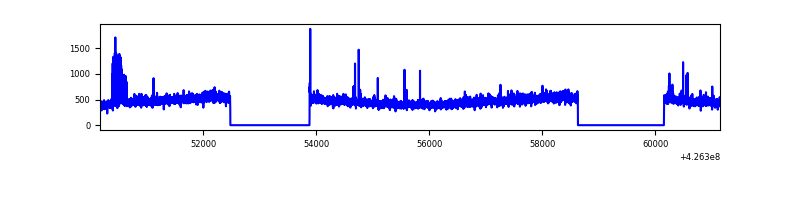 |
| D | 10967 | 8044 | 217 | 217 | 1.98% | 2.70% | 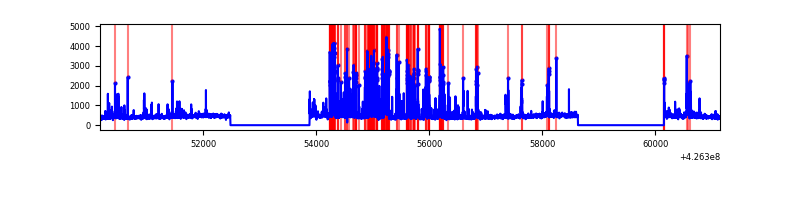 |
Top three noisy pixels from each quadrant. If the there are fewer than three noisy pixels in the level2.evt file, extra rows are filled as -1
| Pixel properties | Quadrant properties | ||||||
|---|---|---|---|---|---|---|---|
| Quadrant | DetID | PixID | Counts | Sigma | Mean | Median | Sigma |
| A | 15 | 223 | 3491386 | 20640.84 | 822 | 805 | 169.1 |
| A | 10 | 83 | 672479 | 3971.81 | 822 | 805 | 169.1 |
| A | 12 | 189 | 135481 | 796.38 | 822 | 805 | 169.1 |
| B | 5 | 255 | 111902 | 644.87 | 886 | 861 | 172.2 |
| B | 0 | 186 | 58359 | 333.92 | 886 | 861 | 172.2 |
| B | 0 | 190 | 54739 | 312.89 | 886 | 861 | 172.2 |
| C | 15 | 214 | 329446 | 1625.75 | 863 | 868 | 202.1 |
| C | 9 | 54 | 113627 | 557.91 | 863 | 868 | 202.1 |
| C | 15 | 111 | 20344 | 96.36 | 863 | 868 | 202.1 |
| D | 2 | 249 | 642211 | 3013.03 | 852 | 825 | 212.9 |
| D | 13 | 249 | 348667 | 1634.05 | 852 | 825 | 212.9 |
| D | 12 | 233 | 87041 | 405.02 | 852 | 825 | 212.9 |
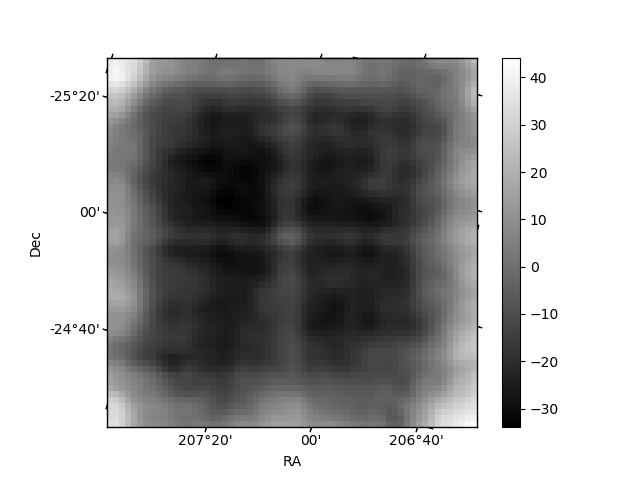
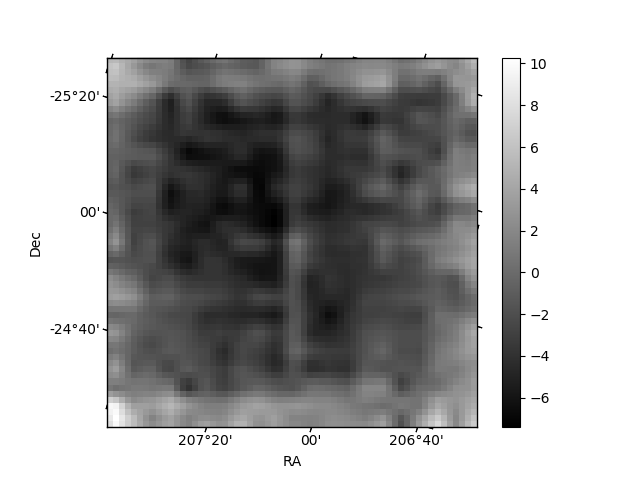
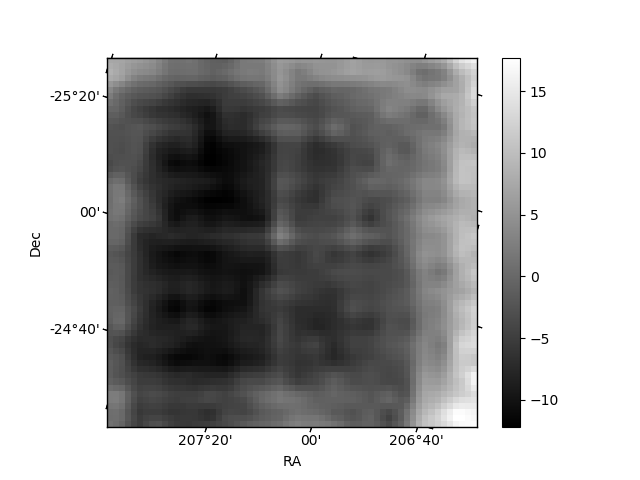
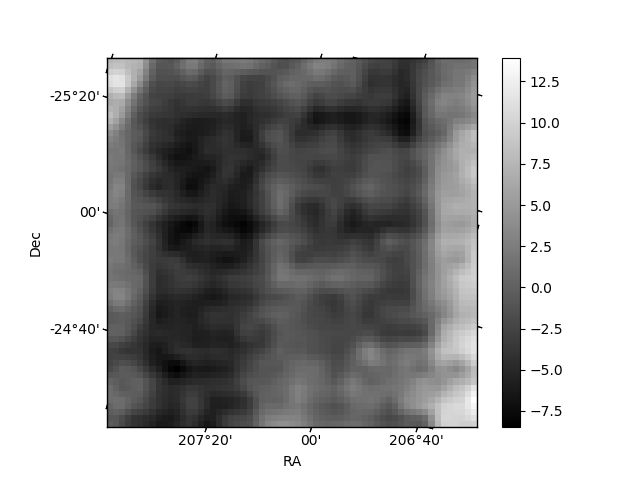
Histogram calculated using DETX and DETY for each event in the final _common_clean file
| Quadrant A | 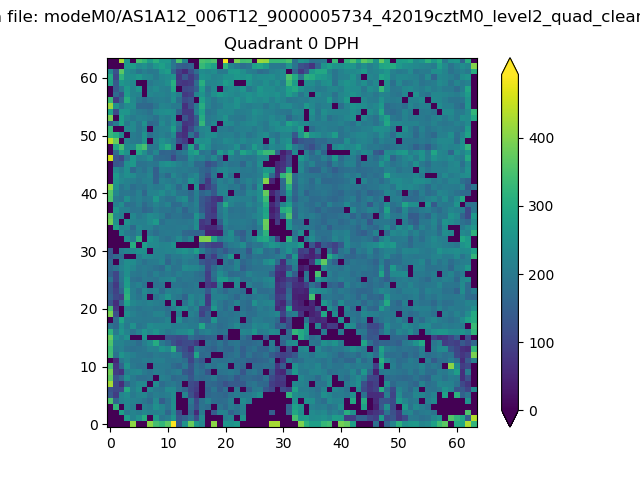 |
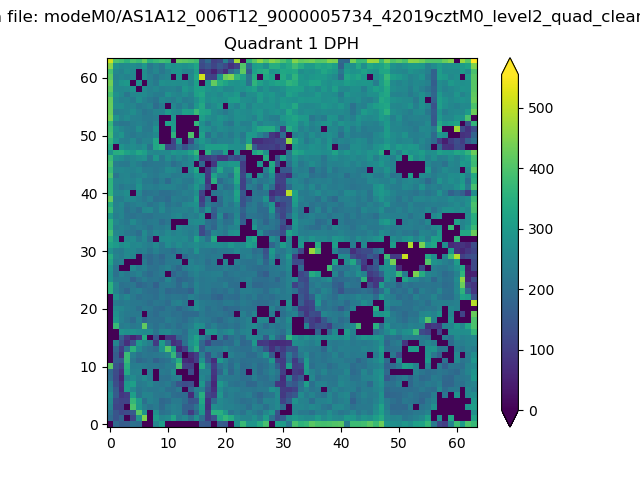 |
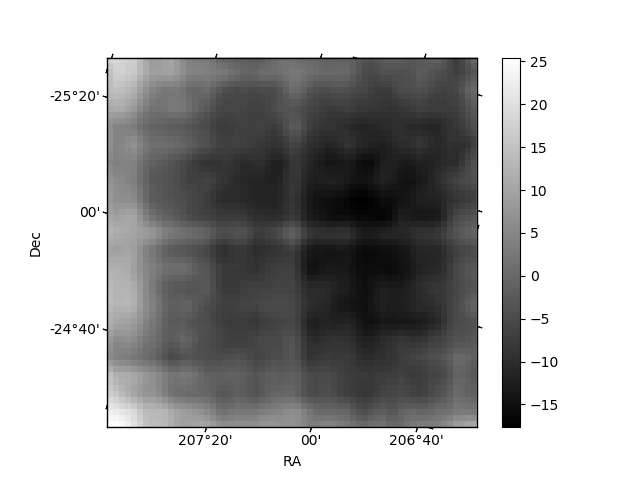
Quadrant B |
|---|---|---|---|
| Quadrant D | 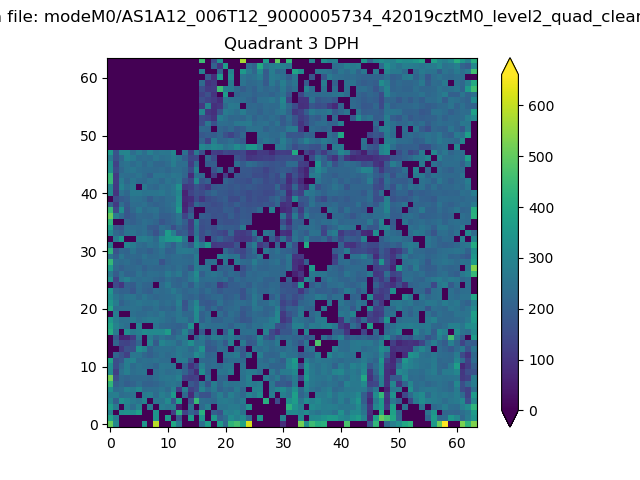 |
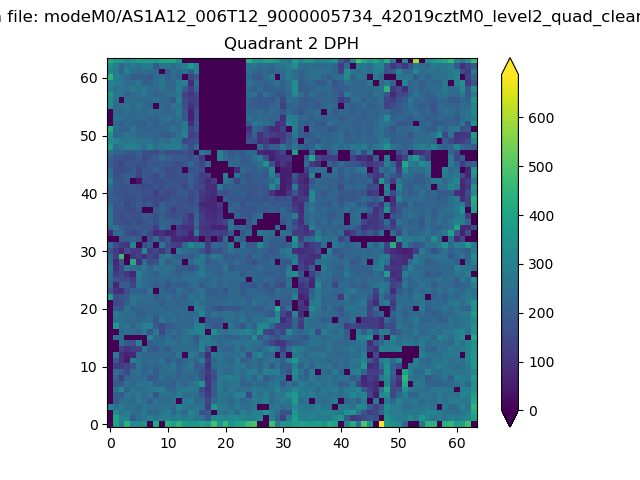 |
Quadrant C |
| Plot type | Count rate plots | Images |
|---|---|---|
| Comparison with Poisson distribution Blue bars denote a histogram of data divided into 1 sec bins. Red curve is a Poisson curve with rate = median count rate of data. |
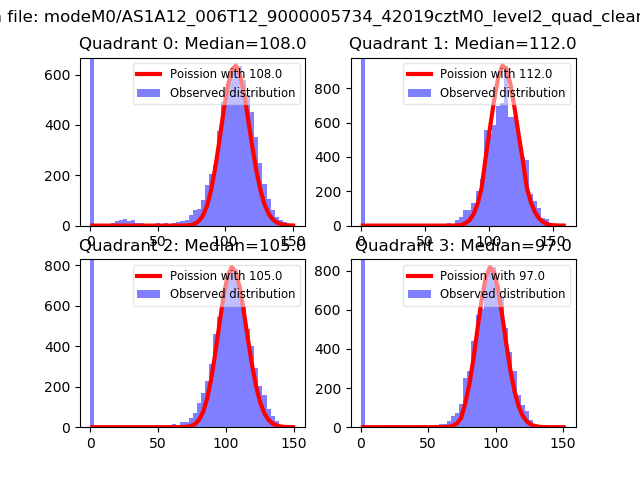 |
 |
| Quadrant-wise count rates Data is divided into 100 sec bins |
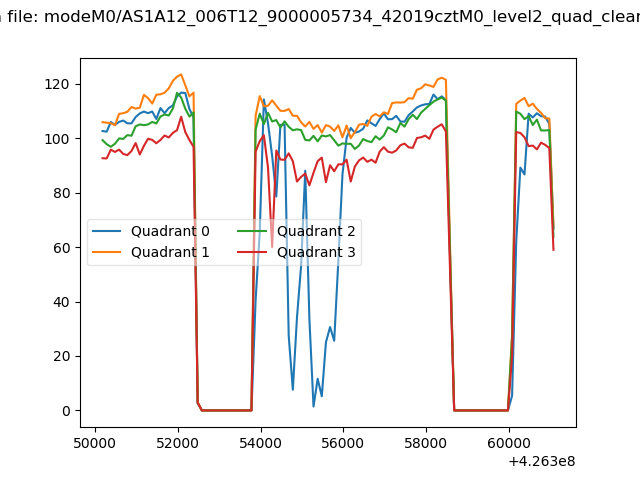 |
|
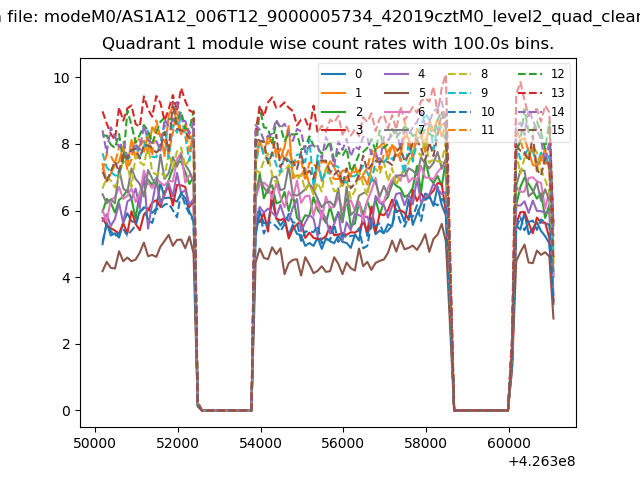
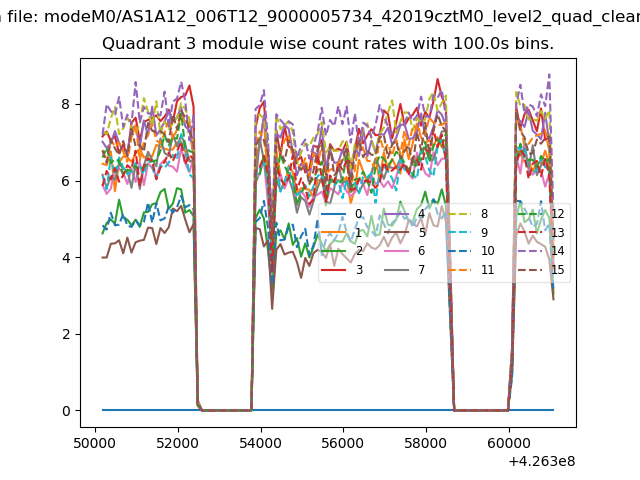
| Module-wise count rates for Quadrant A Data is divided into 100 sec bins |
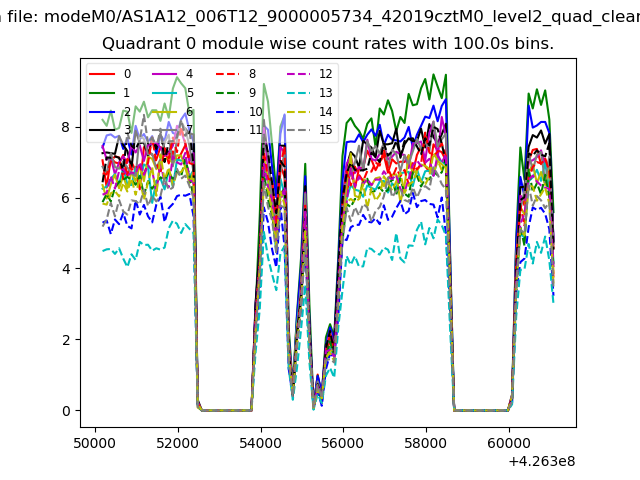 |
 |
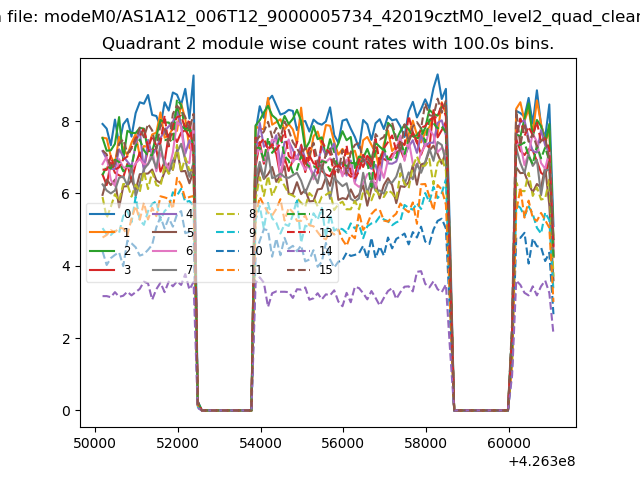
| Module-wise count rates for Quadrant B Data is divided into 100 sec bins |
 |
 |
| Module-wise count rates for Quadrant C Data is divided into 100 sec bins |
 |
 |
| Module-wise count rates for Quadrant D Data is divided into 100 sec bins |
 |
 |
| Parameter | Plot |
|---|---|
| CZT HV Monitor | 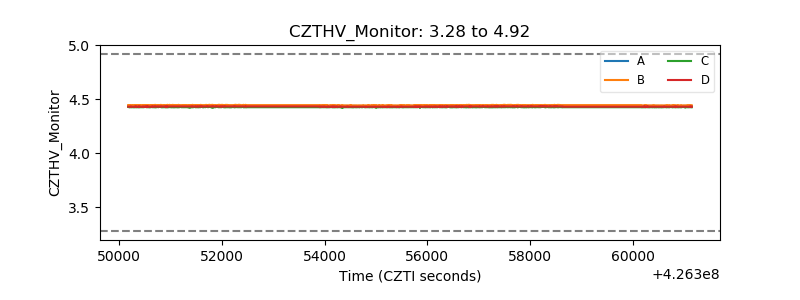 |
| D_VDD | 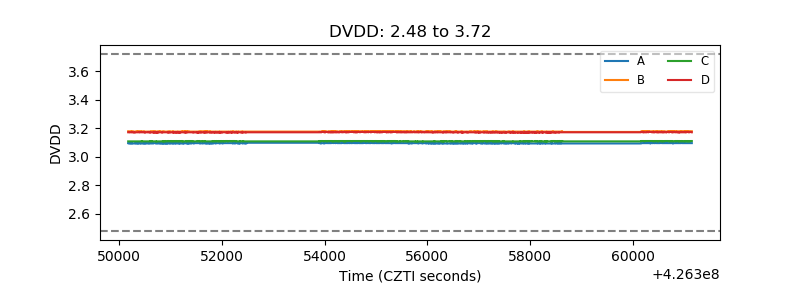 |
| Temperature 1 | 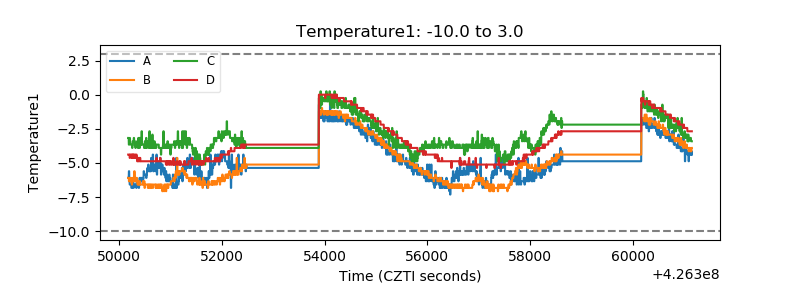 |
| Veto HV Monitor | 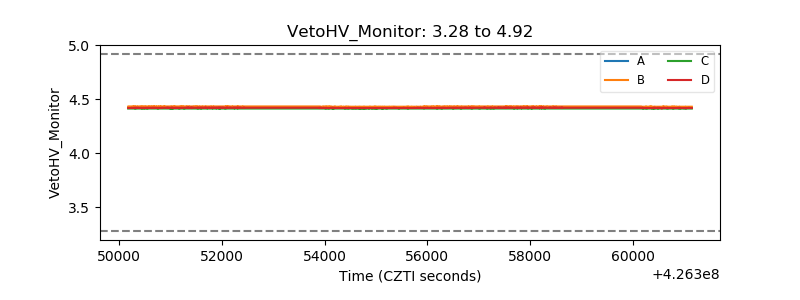 |
| Veto LLD | 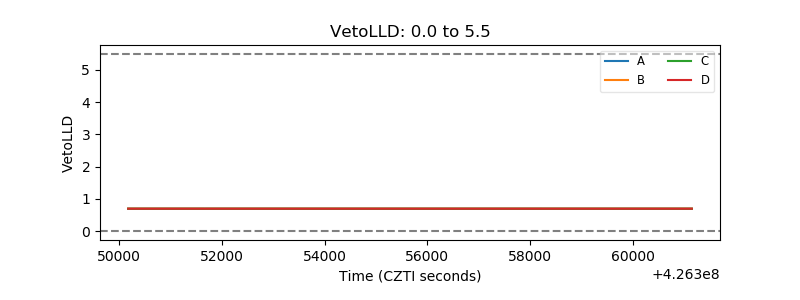 |
| Alpha Counter | 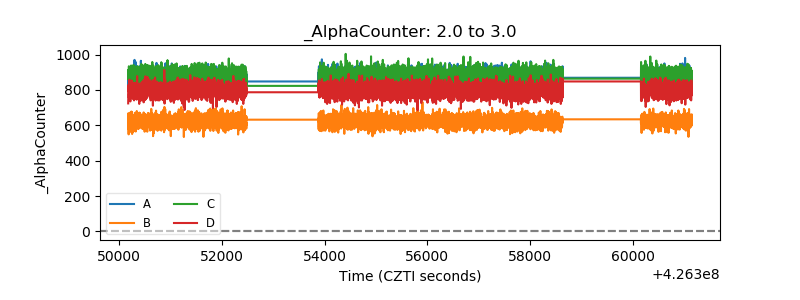 |
| _CPM_Rate |  |
| CZT Counter | 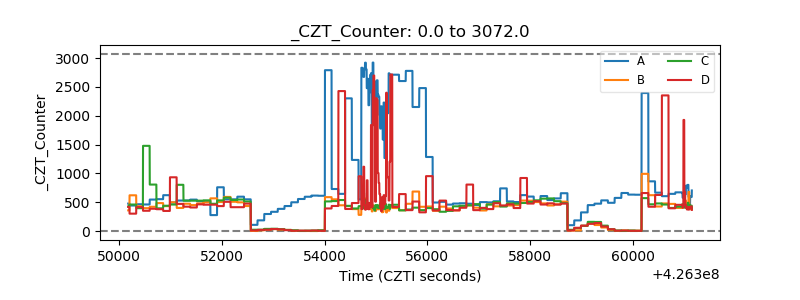 |
| +2.5 Volts monitor | 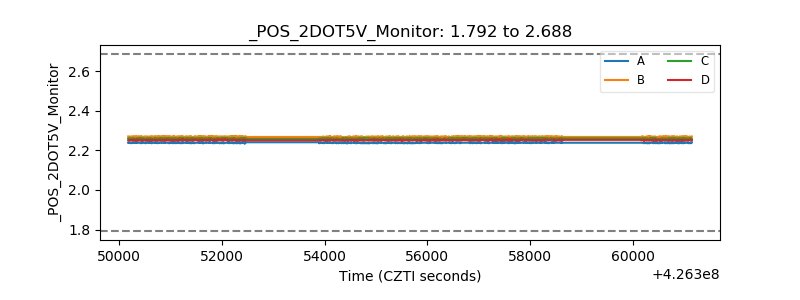 |
| +5 Volts monitor | 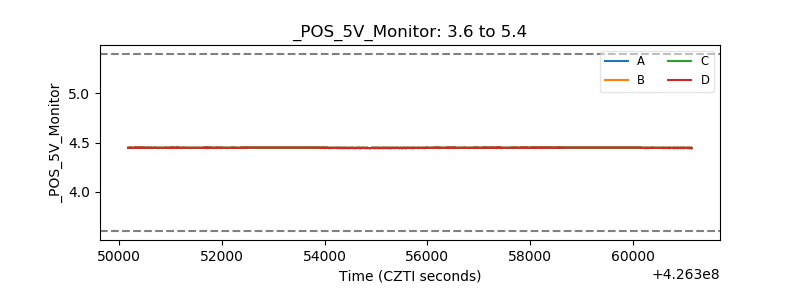 |
| _ROLL_ROT | 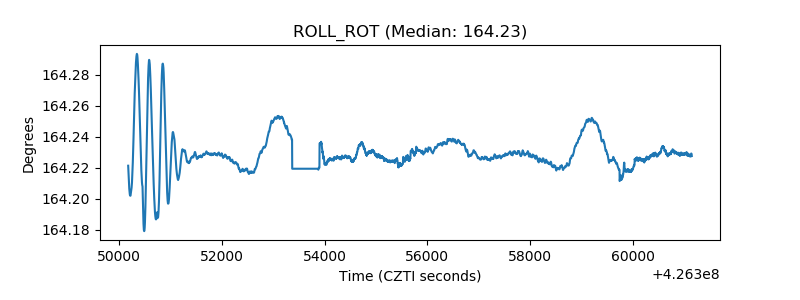 |
| _Roll_DEC | 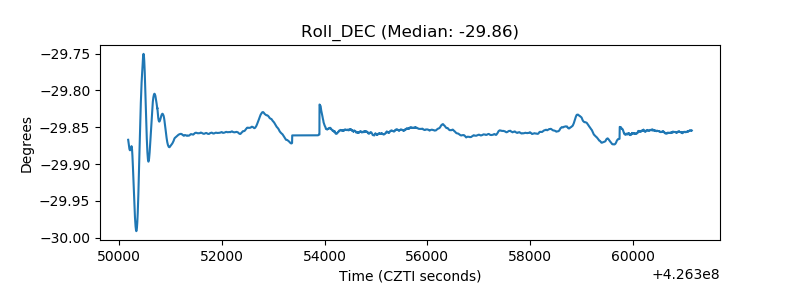 |
| _Roll_RA | 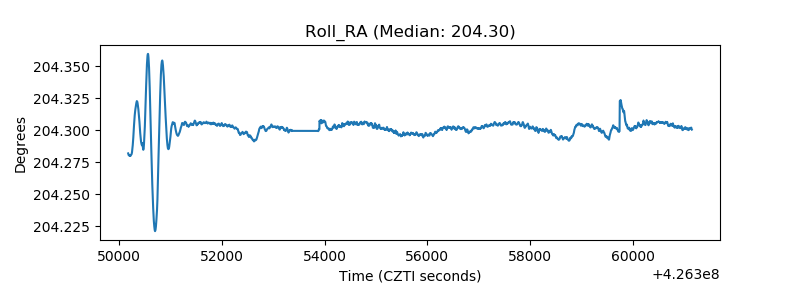 |
| Veto Counter | 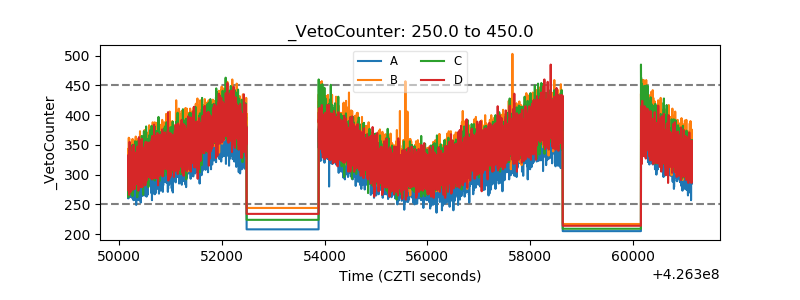 |