| Param | Original file | Final file |
|---|---|---|
| Filename | modeM0/AS1A12_006T12_9000005734_42020cztM0_level2.fits | modeM0/AS1A12_006T12_9000005734_42020cztM0_level2_quad_clean.evt |
| Size (bytes) | 330,986,880 | 87,500,160 |
| Size | 315.7 MB | 83.4 MB |
| Events in quadrant A | 3,326,428 | 584,104 |
| Events in quadrant B | 2,784,187 | 593,406 |
| Events in quadrant C | 2,511,951 | 568,446 |
| Events in quadrant D | 3,205,162 | 522,143 |
| Mode M0 | |||
|---|---|---|---|
| Quadrant | BADHDUFLAG | Total packets | Discarded packets |
| A | 0 | 13184 | 3 |
| B | 0 | 12046 | 2 |
| C | 0 | 11001 | 2 |
| D | 0 | 13506 | 2 |
| Mode M9 | |||
|---|---|---|---|
| Quadrant | BADHDUFLAG | Total packets | Discarded packets |
| A | 0 | 24 | 0 |
| B | 0 | 24 | 0 |
| C | 0 | 24 | 0 |
| D | 0 | 25 | 0 |
| Mode SS | |||
|---|---|---|---|
| Quadrant | BADHDUFLAG | Total packets | Discarded packets |
| A | 0 | 112 | 0 |
| B | 0 | 112 | 0 |
| C | 0 | 112 | 0 |
| D | 0 | 112 | 0 |
| Quadrant | Total seconds | Saturated seconds | Saturation percentage |
|---|---|---|---|
| A | 5442 | 133 | 2.443954% |
| B | 5442 | 132 | 2.425579% |
| C | 5442 | 3 | 0.055127% |
| D | 5442 | 139 | 2.554208% |
Noise dominated data is calculated using 1-second bins in cleaned event files. If a bin has >2000 counts, and if more than 50% of those come from <1% of pixels, then it is considered to be noise-dominated and hence unusable.
| Quadrant | # 1 sec bins | Bins with >0 counts | Bins with >2000 counts | High rate bins dominated by noise | Noise dominated (total time) | Noise dominated (detector-on time) | Marked lightcurve |
|---|---|---|---|---|---|---|---|
| A | 7056 | 5443 | 82 | 82 | 1.16% | 1.51% | 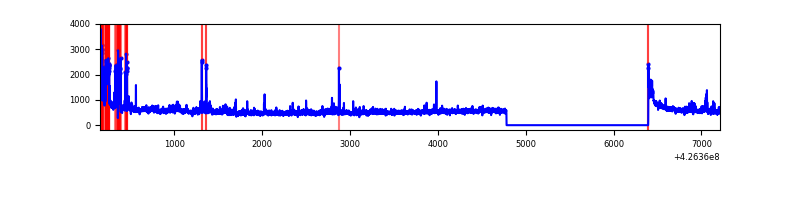 |
| B | 7056 | 5443 | 111 | 111 | 1.57% | 2.04% | 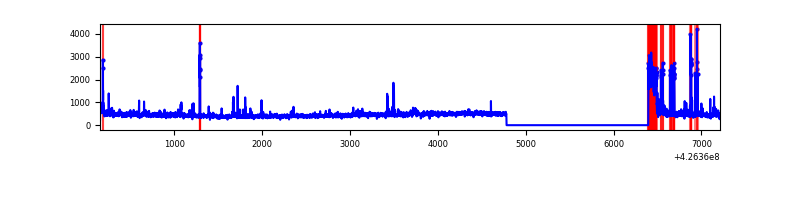 |
| C | 7056 | 5443 | 0 | 0 | 0.00% | 0.00% | 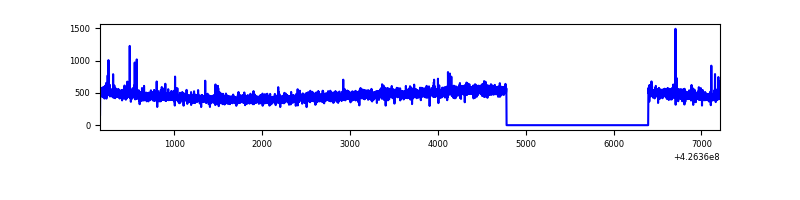 |
| D | 7056 | 5443 | 107 | 107 | 1.52% | 1.97% | 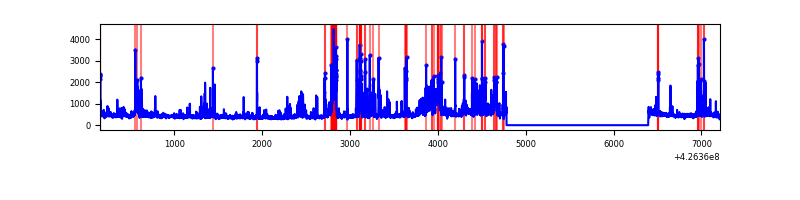 |
Top three noisy pixels from each quadrant. If the there are fewer than three noisy pixels in the level2.evt file, extra rows are filled as -1
| Pixel properties | Quadrant properties | ||||||
|---|---|---|---|---|---|---|---|
| Quadrant | DetID | PixID | Counts | Sigma | Mean | Median | Sigma |
| A | 10 | 83 | 559529 | 4606.67 | 588 | 575 | 121.3 |
| A | 15 | 223 | 373783 | 3075.83 | 588 | 575 | 121.3 |
| A | 12 | 189 | 107602 | 882.07 | 588 | 575 | 121.3 |
| B | 7 | 202 | 235486 | 2009.56 | 588 | 572 | 116.9 |
| B | 0 | 190 | 75400 | 640.11 | 588 | 572 | 116.9 |
| B | 5 | 255 | 69207 | 587.13 | 588 | 572 | 116.9 |
| C | 15 | 214 | 229505 | 1694.74 | 574 | 577 | 135.1 |
| C | 15 | 111 | 12223 | 86.21 | 574 | 577 | 135.1 |
| C | 12 | 249 | 10848 | 76.04 | 574 | 577 | 135.1 |
| D | 13 | 249 | 611406 | 4259.96 | 568 | 551 | 143.4 |
| D | 12 | 6 | 169983 | 1181.58 | 568 | 551 | 143.4 |
| D | 10 | 199 | 67342 | 465.78 | 568 | 551 | 143.4 |
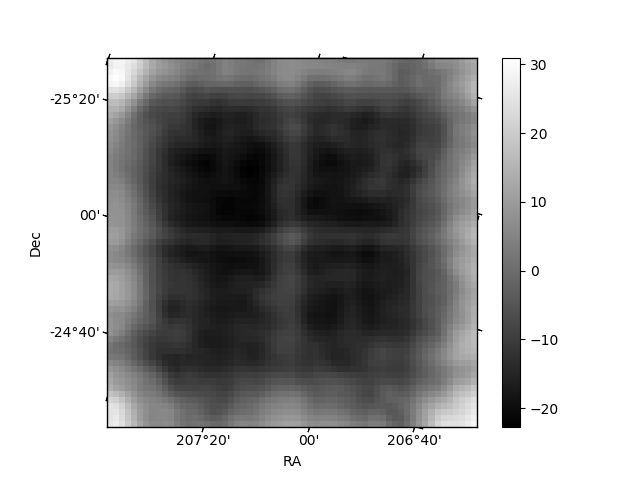
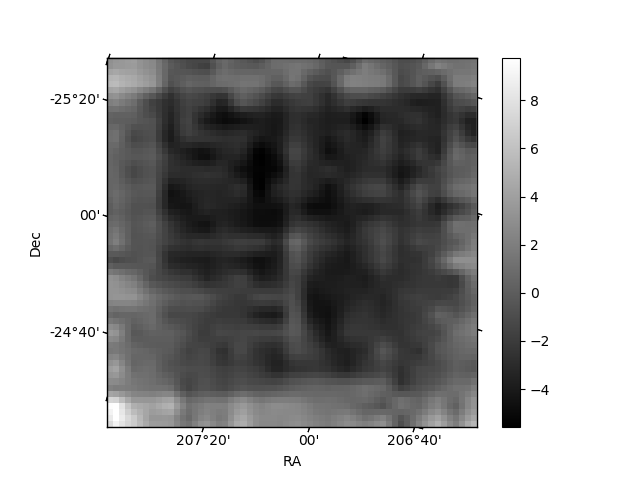
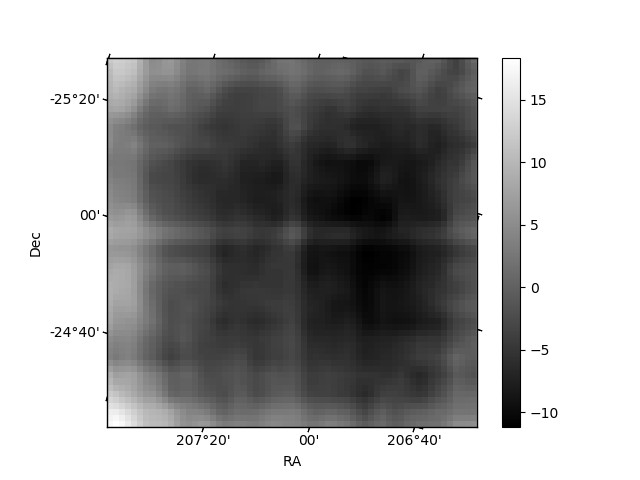
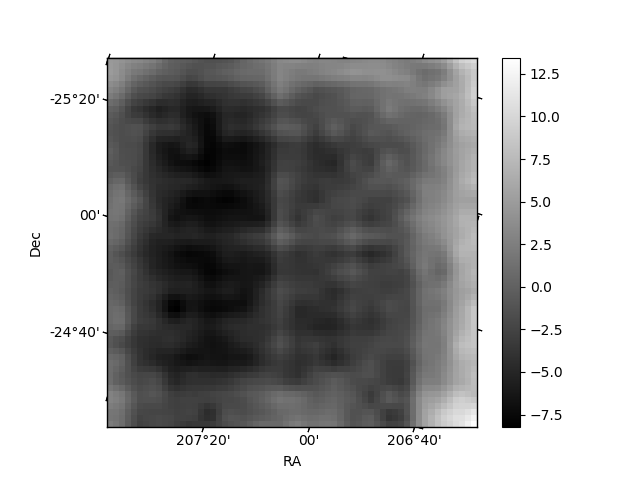
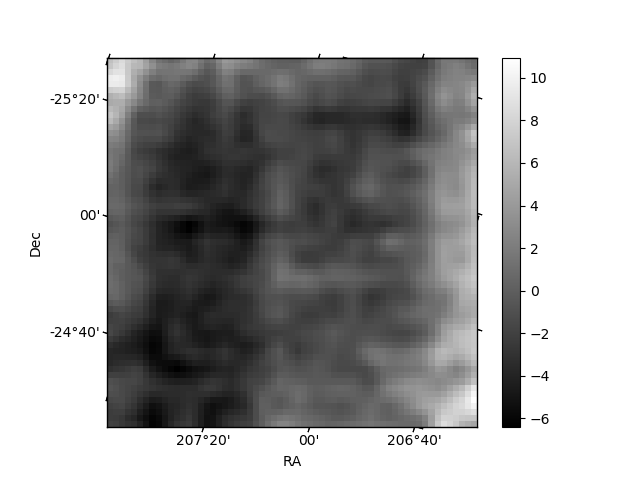
Histogram calculated using DETX and DETY for each event in the final _common_clean file
| Quadrant A | 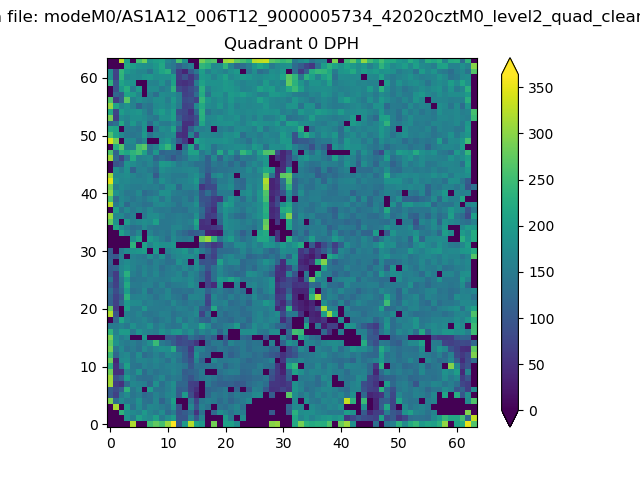 |
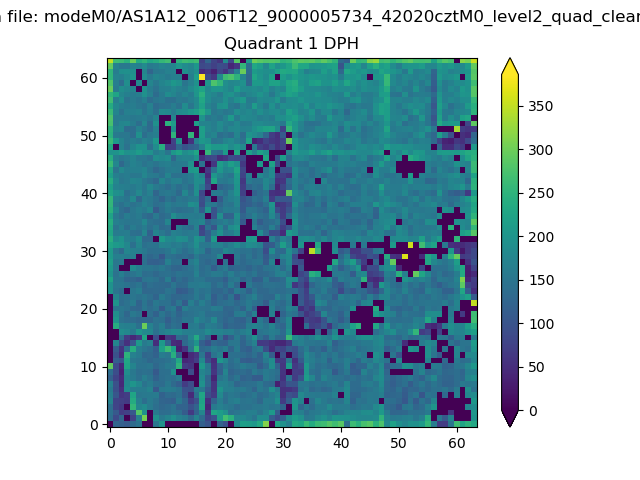 |
Quadrant B |
|---|---|---|---|
| Quadrant D | 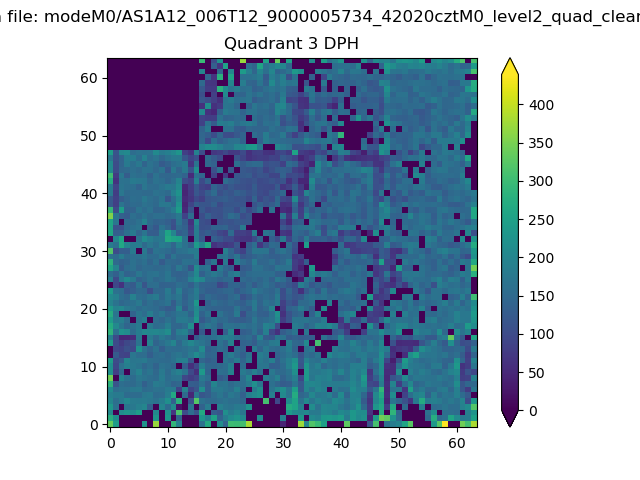 |
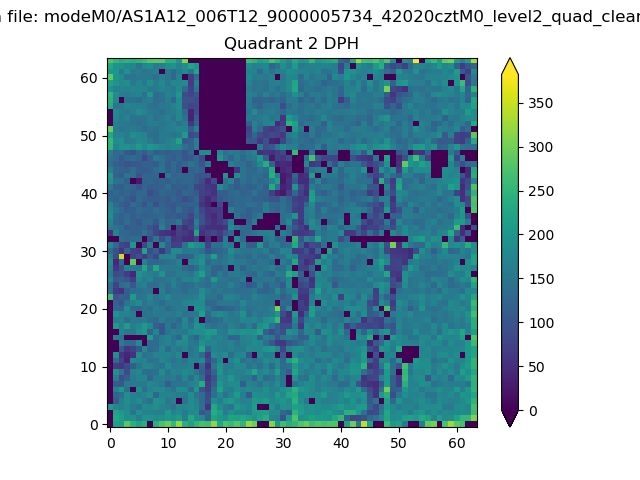 |
Quadrant C |
| Plot type | Count rate plots | Images |
|---|---|---|
| Comparison with Poisson distribution Blue bars denote a histogram of data divided into 1 sec bins. Red curve is a Poisson curve with rate = median count rate of data. |
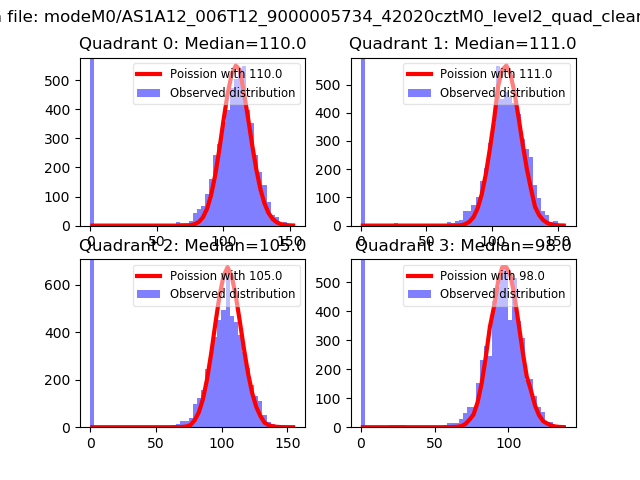 |
 |
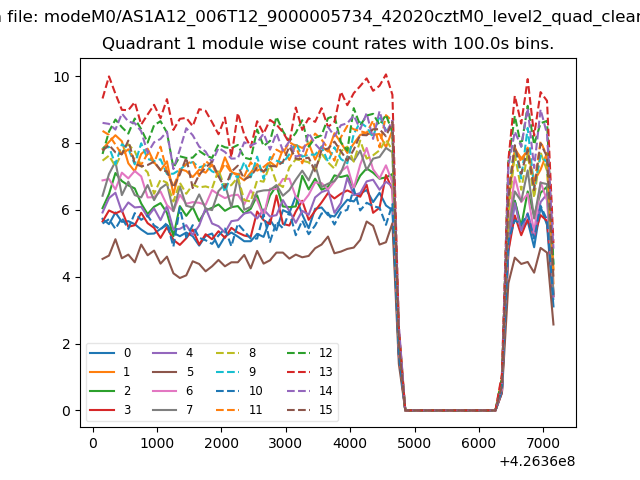
| Quadrant-wise count rates Data is divided into 100 sec bins |
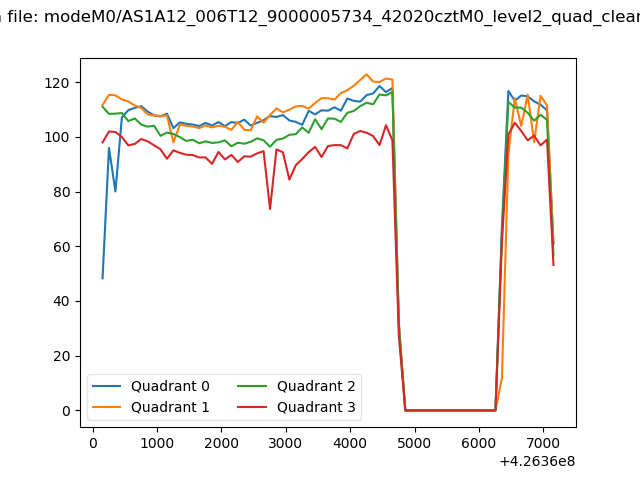 |
|
| Module-wise count rates for Quadrant A Data is divided into 100 sec bins |
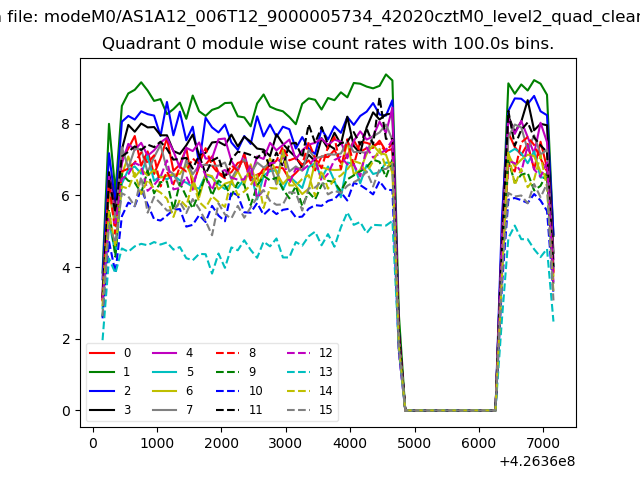 |
 |
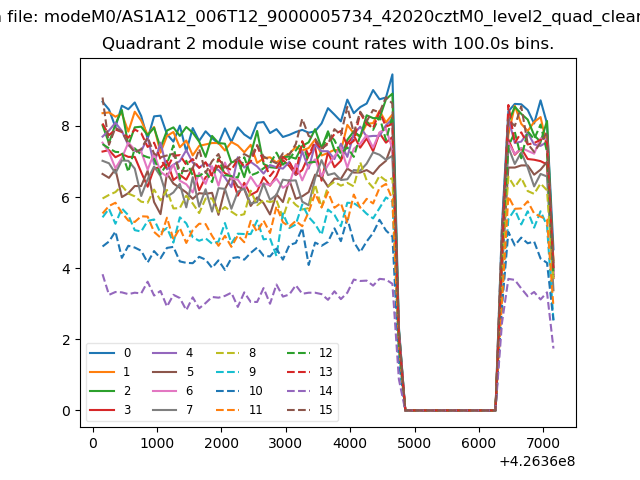
| Module-wise count rates for Quadrant B Data is divided into 100 sec bins |
 |
 |
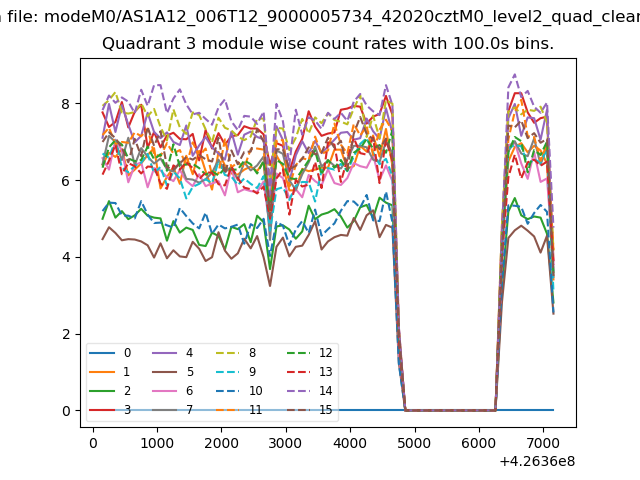
| Module-wise count rates for Quadrant C Data is divided into 100 sec bins |
 |
 |
| Module-wise count rates for Quadrant D Data is divided into 100 sec bins |
 |
 |
| Parameter | Plot |
|---|---|
| CZT HV Monitor | 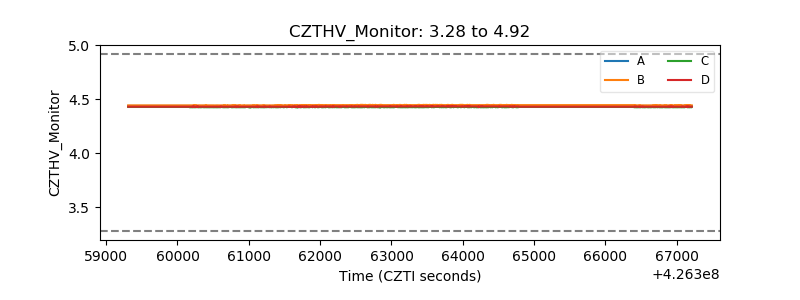 |
| D_VDD | 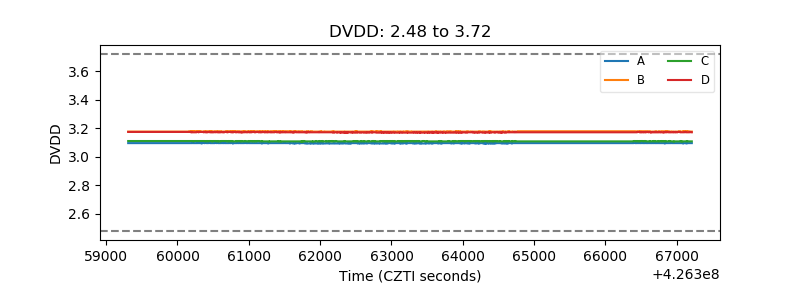 |
| Temperature 1 | 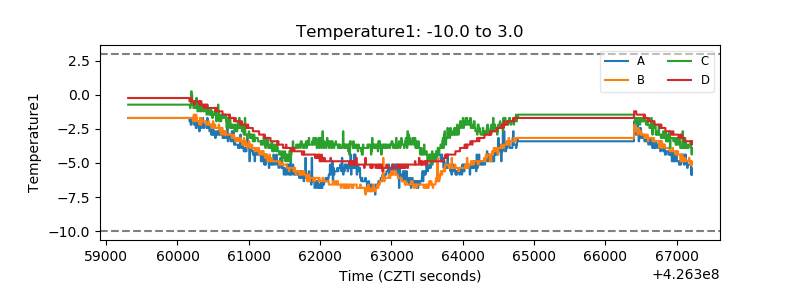 |
| Veto HV Monitor | 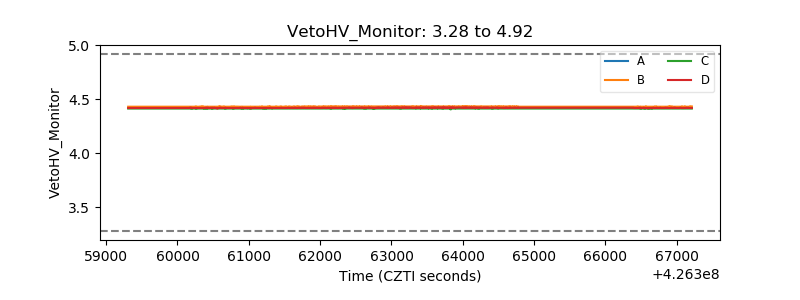 |
| Veto LLD | 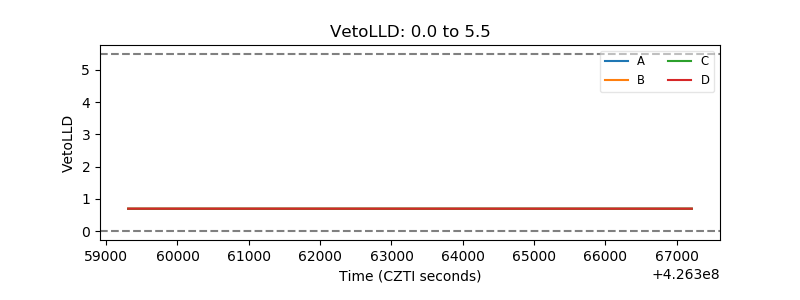 |
| Alpha Counter | 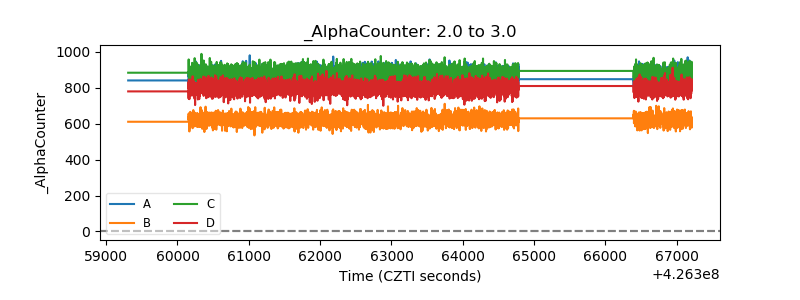 |
| _CPM_Rate | 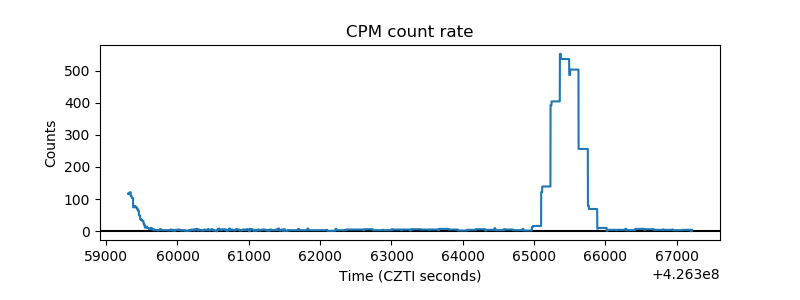 |
| CZT Counter | 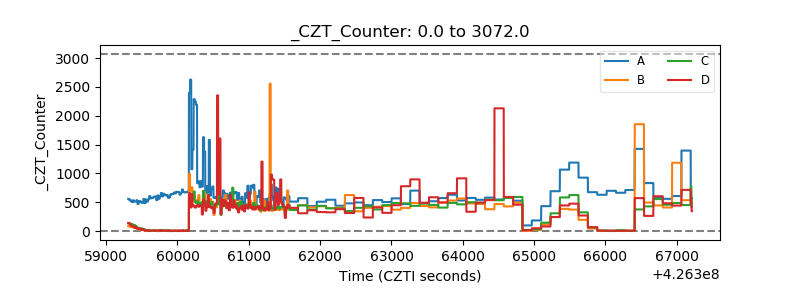 |
| +2.5 Volts monitor | 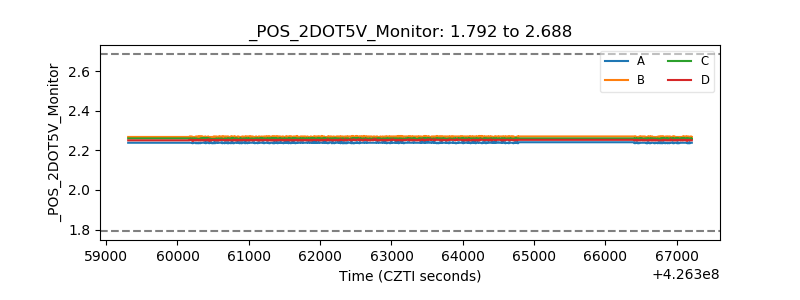 |
| +5 Volts monitor | 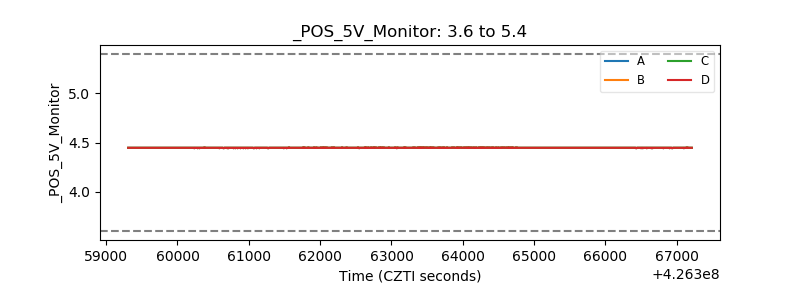 |
| _ROLL_ROT | 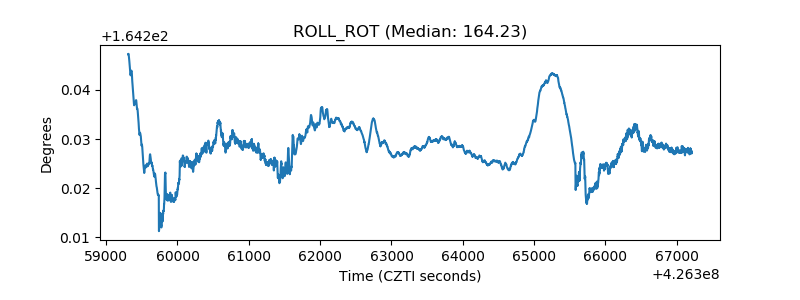 |
| _Roll_DEC | 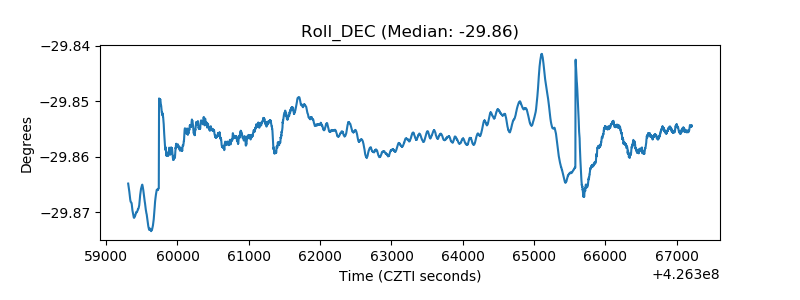 |
| _Roll_RA | 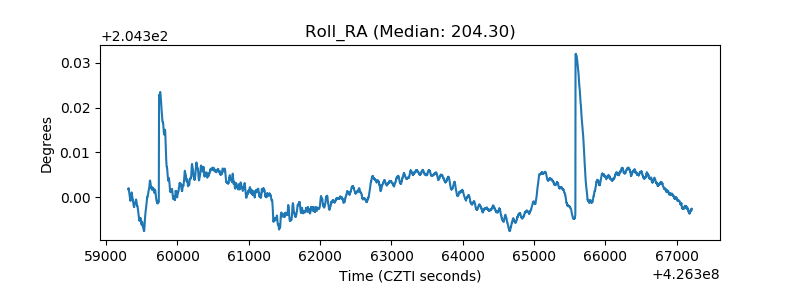 |
| Veto Counter | 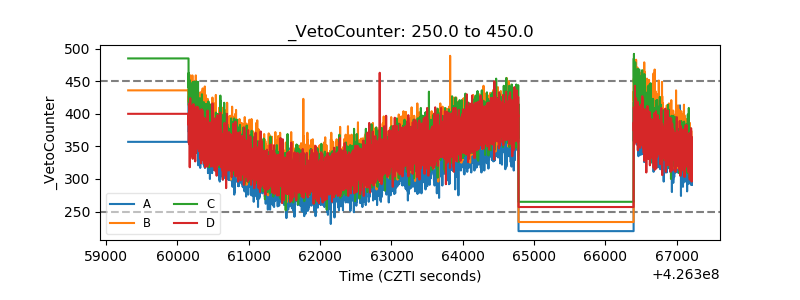 |