| Param | Original file | Final file |
|---|---|---|
| Filename | modeM0/AS1A12_006T12_9000005734_42022cztM0_level2.fits | modeM0/AS1A12_006T12_9000005734_42022cztM0_level2_quad_clean.evt |
| Size (bytes) | 333,777,600 | 85,484,160 |
| Size | 318.3 MB | 81.5 MB |
| Events in quadrant A | 3,060,179 | 586,612 |
| Events in quadrant B | 3,493,267 | 555,646 |
| Events in quadrant C | 2,454,086 | 561,190 |
| Events in quadrant D | 2,937,282 | 515,899 |
| Mode M0 | |||
|---|---|---|---|
| Quadrant | BADHDUFLAG | Total packets | Discarded packets |
| A | 0 | 12306 | 2 |
| B | 0 | 14057 | 2 |
| C | 0 | 10654 | 2 |
| D | 0 | 12238 | 2 |
| Mode M9 | |||
|---|---|---|---|
| Quadrant | BADHDUFLAG | Total packets | Discarded packets |
| A | 0 | 28 | 0 |
| B | 0 | 29 | 0 |
| C | 0 | 29 | 0 |
| D | 0 | 29 | 0 |
| Mode SS | |||
|---|---|---|---|
| Quadrant | BADHDUFLAG | Total packets | Discarded packets |
| A | 0 | 108 | 0 |
| B | 0 | 108 | 0 |
| C | 0 | 108 | 0 |
| D | 0 | 108 | 0 |
| Quadrant | Total seconds | Saturated seconds | Saturation percentage |
|---|---|---|---|
| A | 5266 | 15 | 0.284846% |
| B | 5266 | 397 | 7.538929% |
| C | 5266 | 5 | 0.094949% |
| D | 5266 | 59 | 1.120395% |
Noise dominated data is calculated using 1-second bins in cleaned event files. If a bin has >2000 counts, and if more than 50% of those come from <1% of pixels, then it is considered to be noise-dominated and hence unusable.
| Quadrant | # 1 sec bins | Bins with >0 counts | Bins with >2000 counts | High rate bins dominated by noise | Noise dominated (total time) | Noise dominated (detector-on time) | Marked lightcurve |
|---|---|---|---|---|---|---|---|
| A | 7028 | 5267 | 8 | 8 | 0.11% | 0.15% | 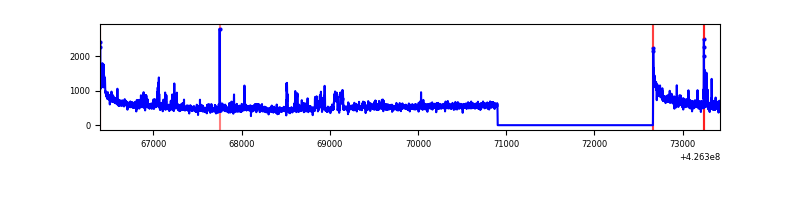 |
| B | 7028 | 5267 | 321 | 321 | 4.57% | 6.09% | 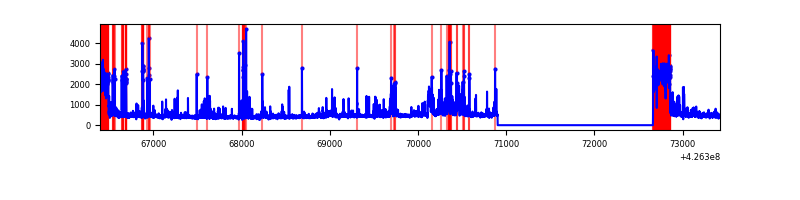 |
| C | 7028 | 5267 | 0 | 0 | 0.00% | 0.00% | 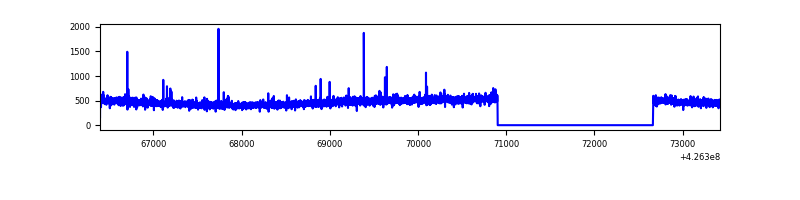 |
| D | 7028 | 5267 | 50 | 50 | 0.71% | 0.95% | 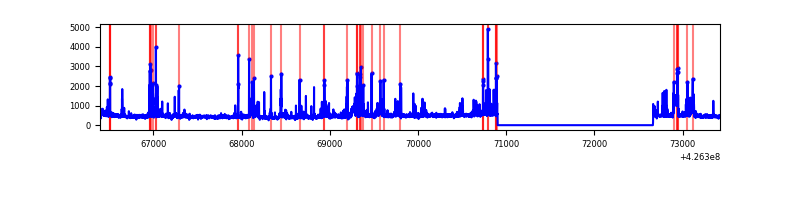 |
Top three noisy pixels from each quadrant. If the there are fewer than three noisy pixels in the level2.evt file, extra rows are filled as -1
| Pixel properties | Quadrant properties | ||||||
|---|---|---|---|---|---|---|---|
| Quadrant | DetID | PixID | Counts | Sigma | Mean | Median | Sigma |
| A | 10 | 83 | 552285 | 4600.71 | 577 | 565 | 119.9 |
| A | 15 | 223 | 145516 | 1208.72 | 577 | 565 | 119.9 |
| A | 12 | 189 | 118346 | 982.16 | 577 | 565 | 119.9 |
| B | 7 | 202 | 648516 | 5914.45 | 560 | 545 | 109.6 |
| B | 5 | 255 | 306072 | 2788.74 | 560 | 545 | 109.6 |
| B | 4 | 171 | 197870 | 1801.11 | 560 | 545 | 109.6 |
| C | 15 | 214 | 220185 | 1673.23 | 560 | 565 | 131.3 |
| C | 8 | 79 | 11034 | 79.76 | 560 | 565 | 131.3 |
| C | 12 | 249 | 10954 | 79.15 | 560 | 565 | 131.3 |
| D | 13 | 249 | 307250 | 2197.81 | 557 | 540 | 139.6 |
| D | 1 | 52 | 229004 | 1637.11 | 557 | 540 | 139.6 |
| D | 12 | 6 | 105866 | 754.74 | 557 | 540 | 139.6 |
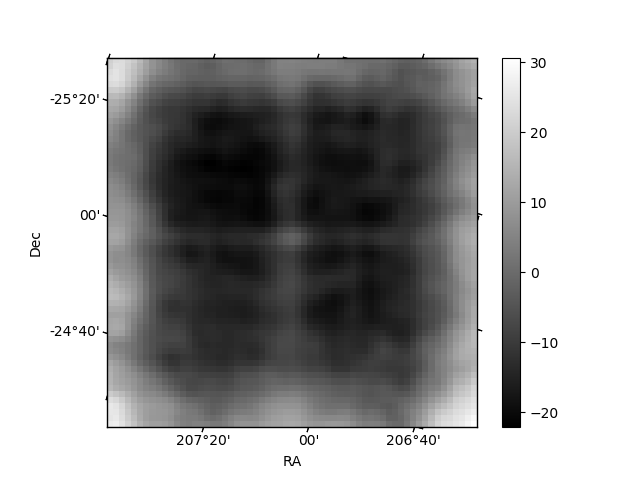
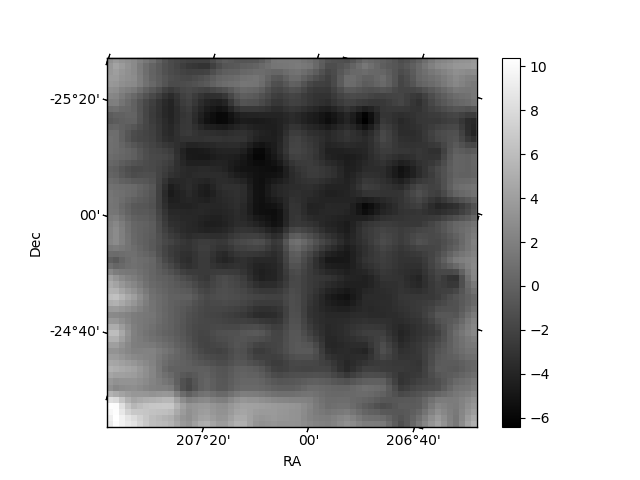
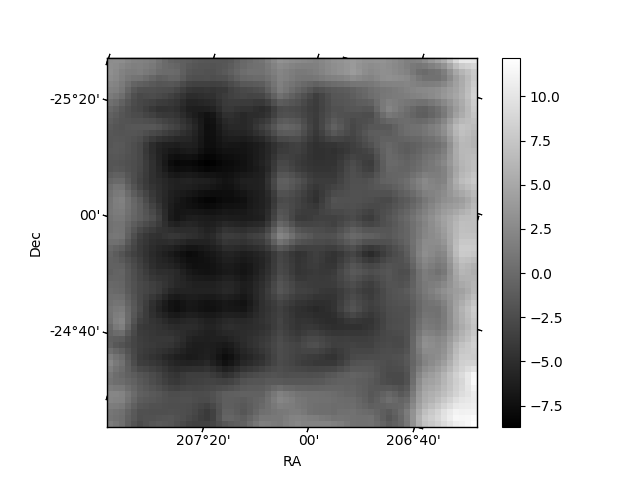
Histogram calculated using DETX and DETY for each event in the final _common_clean file
| Quadrant A | 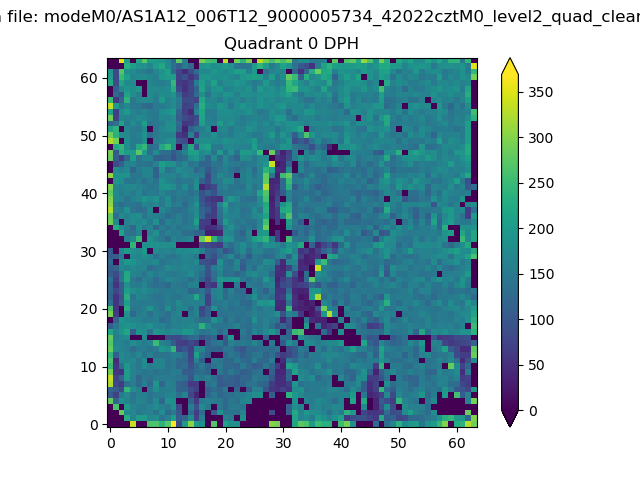 |
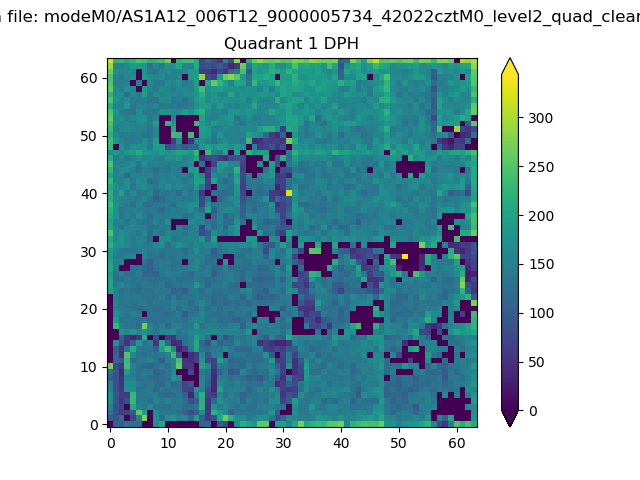 |
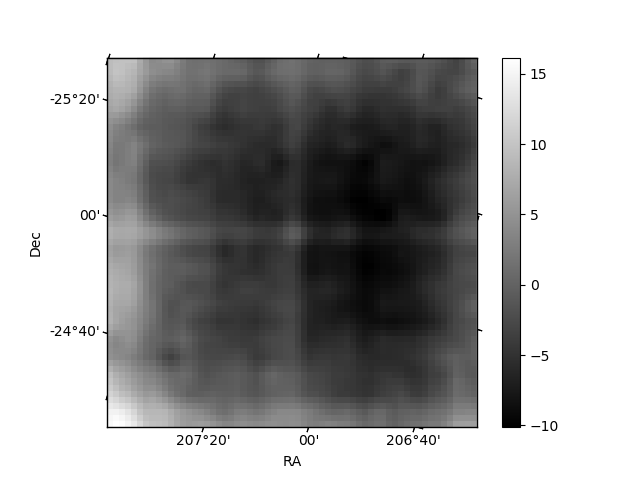
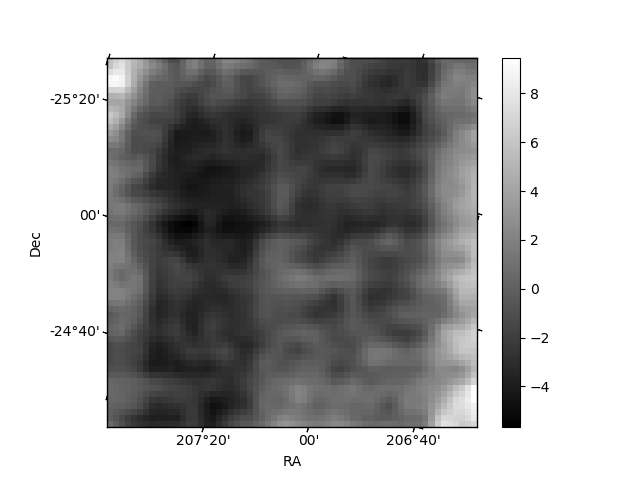
Quadrant B |
|---|---|---|---|
| Quadrant D | 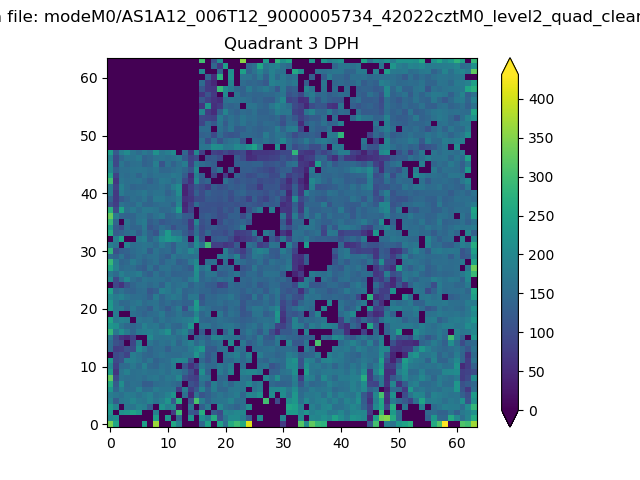 |
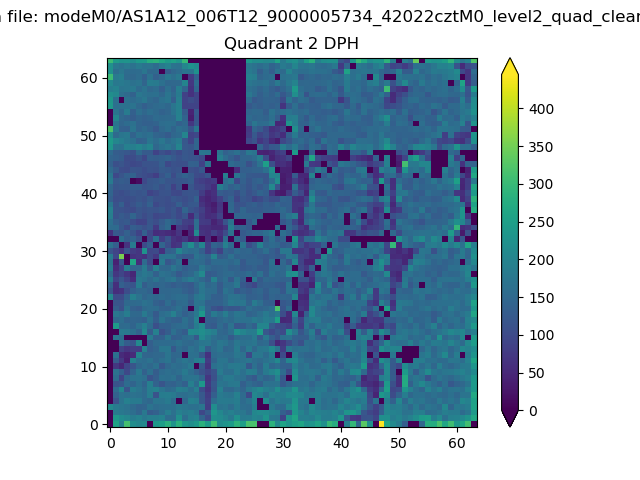 |
Quadrant C |
| Plot type | Count rate plots | Images |
|---|---|---|
| Comparison with Poisson distribution Blue bars denote a histogram of data divided into 1 sec bins. Red curve is a Poisson curve with rate = median count rate of data. |
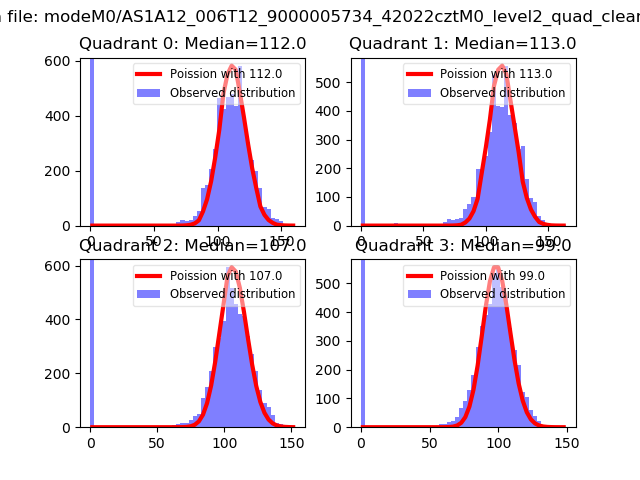 |
 |
| Quadrant-wise count rates Data is divided into 100 sec bins |
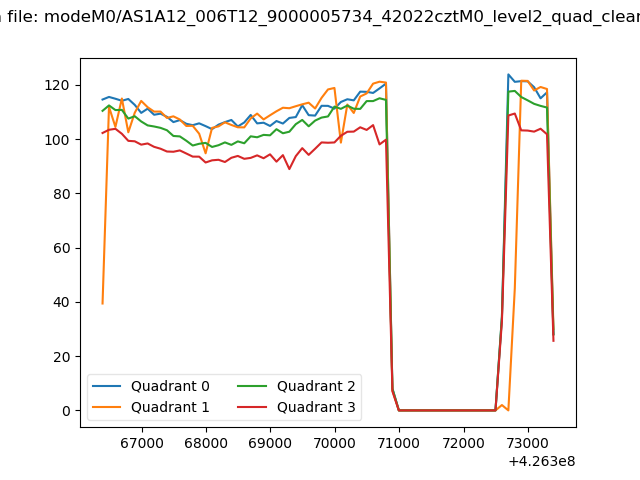 |
|
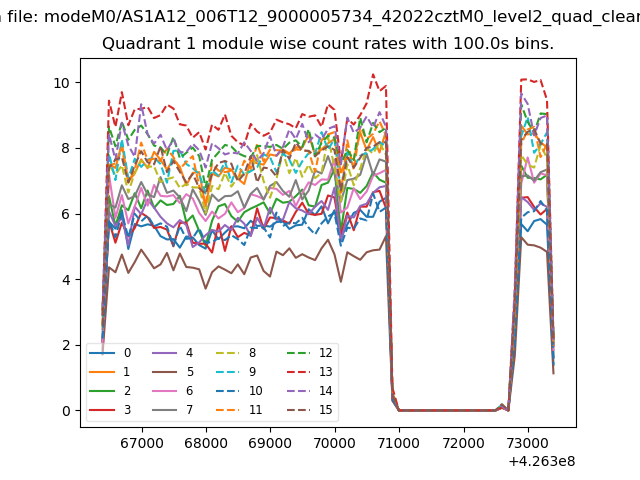
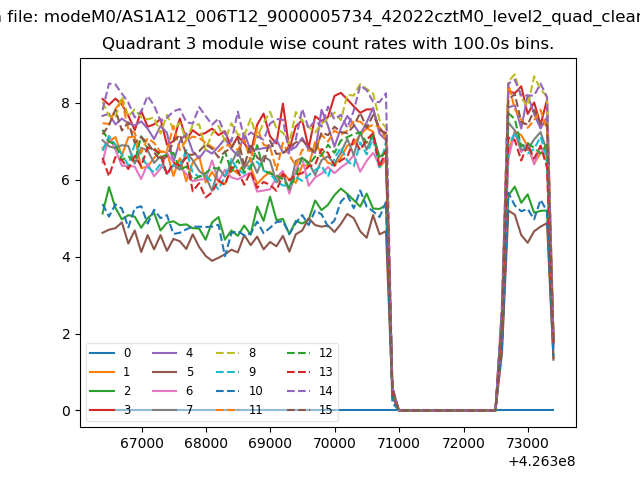
| Module-wise count rates for Quadrant A Data is divided into 100 sec bins |
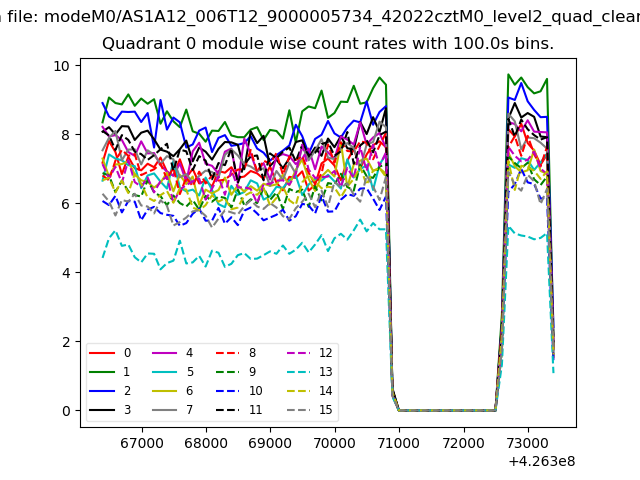 |
 |
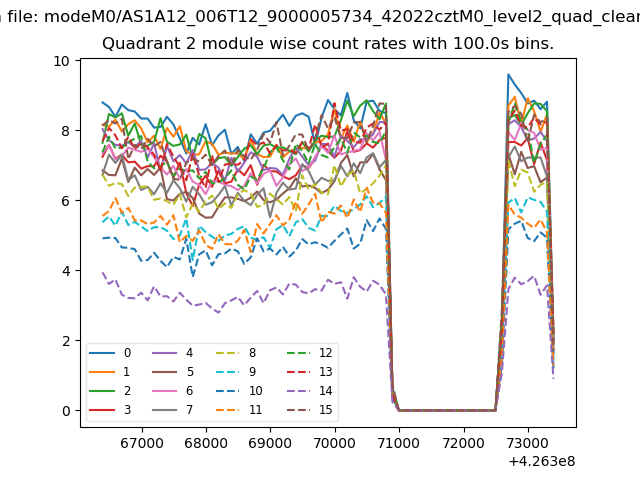
| Module-wise count rates for Quadrant B Data is divided into 100 sec bins |
 |
 |
| Module-wise count rates for Quadrant C Data is divided into 100 sec bins |
 |
 |
| Module-wise count rates for Quadrant D Data is divided into 100 sec bins |
 |
 |
| Parameter | Plot |
|---|---|
| CZT HV Monitor | 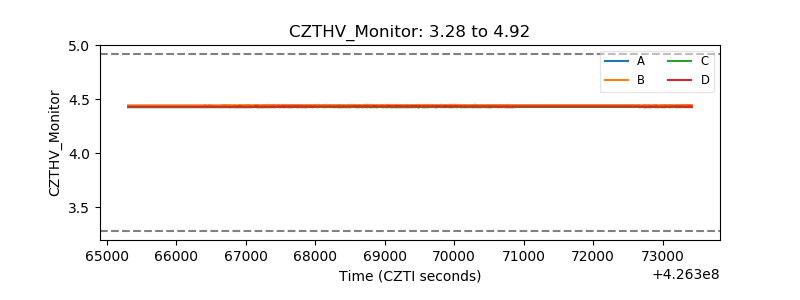 |
| D_VDD | 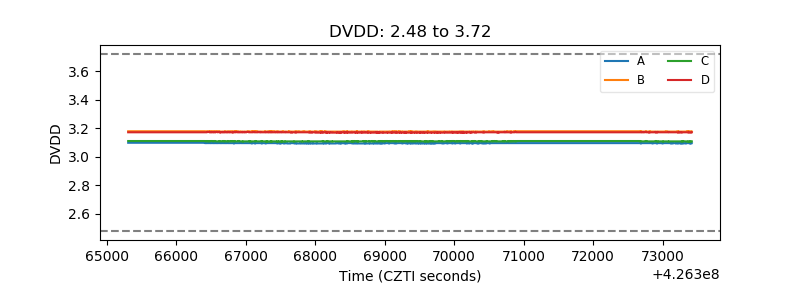 |
| Temperature 1 |  |
| Veto HV Monitor | 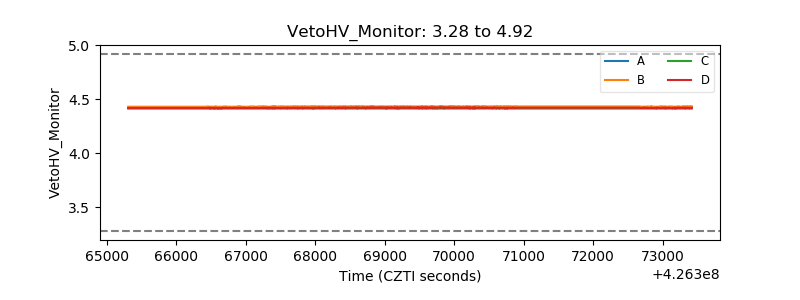 |
| Veto LLD | 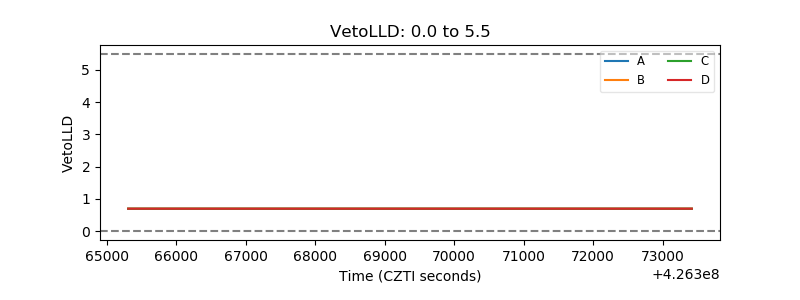 |
| Alpha Counter | 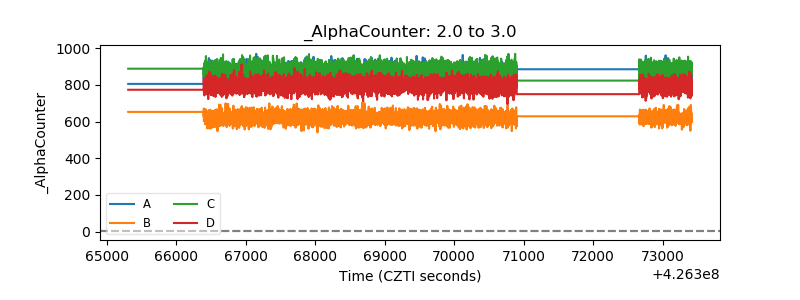 |
| _CPM_Rate | 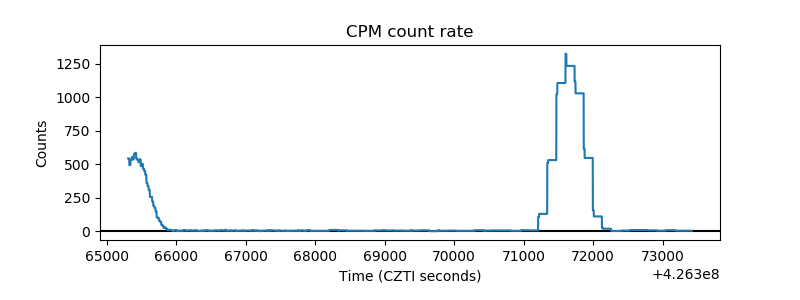 |
| CZT Counter | 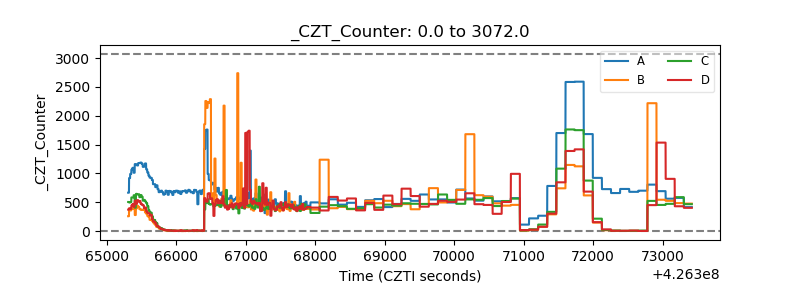 |
| +2.5 Volts monitor | 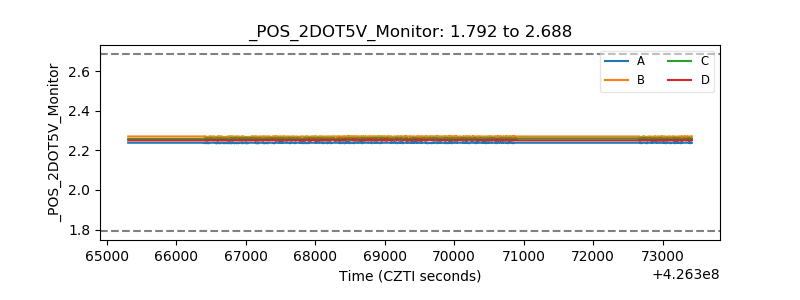 |
| +5 Volts monitor | 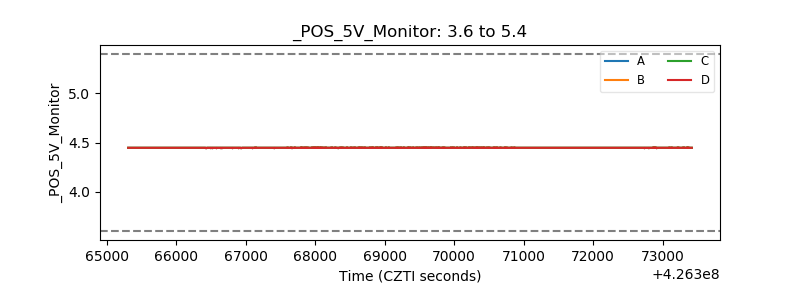 |
| _ROLL_ROT | 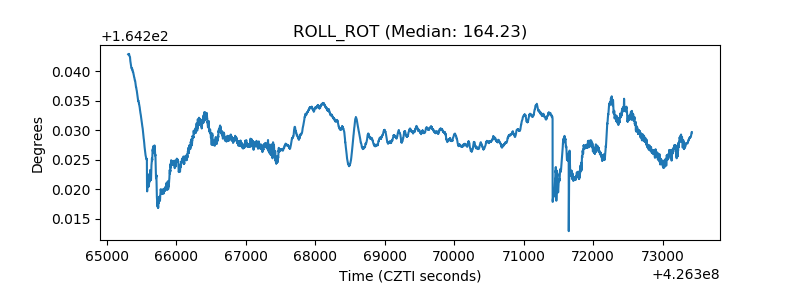 |
| _Roll_DEC | 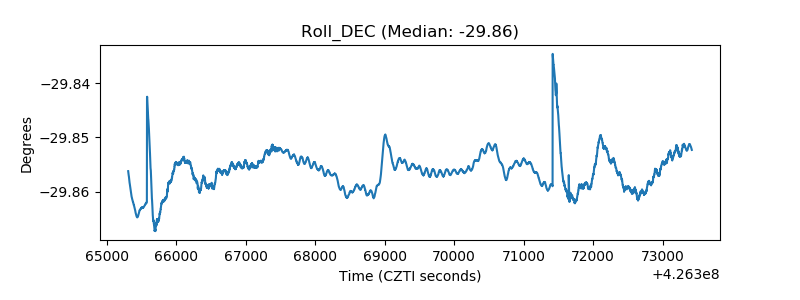 |
| _Roll_RA | 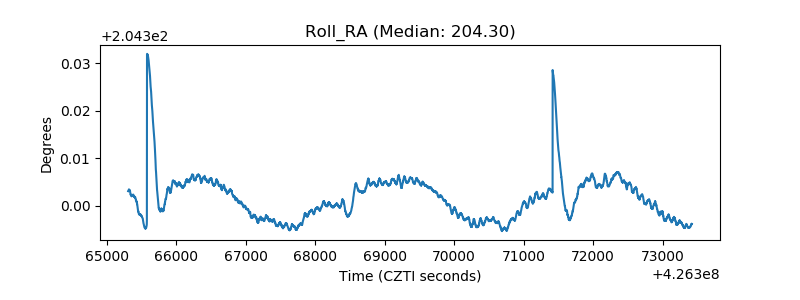 |
| Veto Counter | 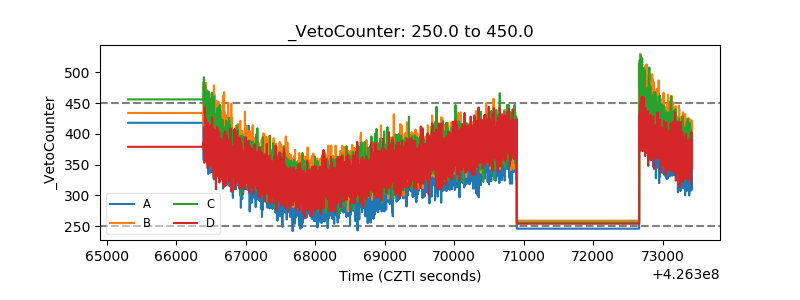 |