| Param | Original file | Final file |
|---|---|---|
| Filename | modeM0/AS1A12_006T12_9000005734_42023cztM0_level2.fits | modeM0/AS1A12_006T12_9000005734_42023cztM0_level2_quad_clean.evt |
| Size (bytes) | 346,775,040 | 84,824,640 |
| Size | 330.7 MB | 80.9 MB |
| Events in quadrant A | 3,087,964 | 588,698 |
| Events in quadrant B | 3,109,279 | 573,642 |
| Events in quadrant C | 2,435,262 | 568,113 |
| Events in quadrant D | 3,802,176 | 477,261 |
| Mode M0 | |||
|---|---|---|---|
| Quadrant | BADHDUFLAG | Total packets | Discarded packets |
| A | 0 | 12351 | 2 |
| B | 0 | 12652 | 2 |
| C | 0 | 10391 | 2 |
| D | 0 | 14601 | 2 |
| Mode M9 | |||
|---|---|---|---|
| Quadrant | BADHDUFLAG | Total packets | Discarded packets |
| A | 0 | 32 | 0 |
| B | 0 | 32 | 0 |
| C | 0 | 33 | 0 |
| D | 0 | 33 | 0 |
| Mode SS | |||
|---|---|---|---|
| Quadrant | BADHDUFLAG | Total packets | Discarded packets |
| A | 0 | 104 | 0 |
| B | 0 | 104 | 0 |
| C | 0 | 104 | 0 |
| D | 0 | 104 | 0 |
| Quadrant | Total seconds | Saturated seconds | Saturation percentage |
|---|---|---|---|
| A | 5153 | 66 | 1.280807% |
| B | 5153 | 304 | 5.899476% |
| C | 5153 | 5 | 0.097031% |
| D | 5153 | 513 | 9.955366% |
Noise dominated data is calculated using 1-second bins in cleaned event files. If a bin has >2000 counts, and if more than 50% of those come from <1% of pixels, then it is considered to be noise-dominated and hence unusable.
| Quadrant | # 1 sec bins | Bins with >0 counts | Bins with >2000 counts | High rate bins dominated by noise | Noise dominated (total time) | Noise dominated (detector-on time) | Marked lightcurve |
|---|---|---|---|---|---|---|---|
| A | 7035 | 5154 | 49 | 49 | 0.70% | 0.95% | 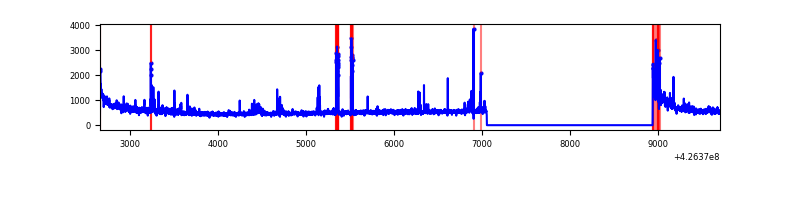 |
| B | 7035 | 5154 | 255 | 255 | 3.62% | 4.95% | 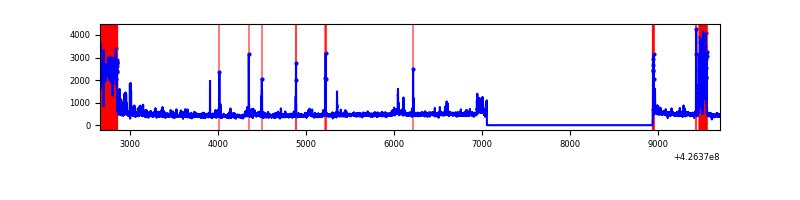 |
| C | 7035 | 5154 | 0 | 0 | 0.00% | 0.00% | 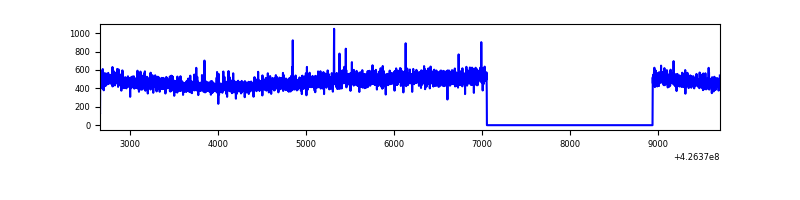 |
| D | 7035 | 5154 | 395 | 395 | 5.61% | 7.66% | 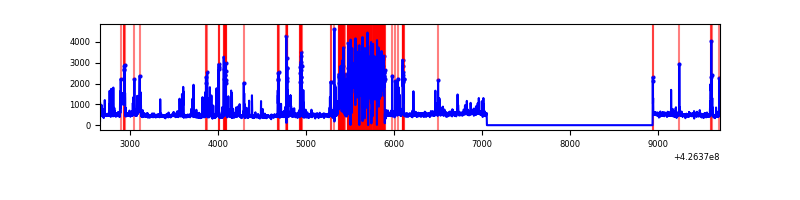 |
Top three noisy pixels from each quadrant. If the there are fewer than three noisy pixels in the level2.evt file, extra rows are filled as -1
| Pixel properties | Quadrant properties | ||||||
|---|---|---|---|---|---|---|---|
| Quadrant | DetID | PixID | Counts | Sigma | Mean | Median | Sigma |
| A | 10 | 83 | 516228 | 4347.57 | 576 | 565 | 118.6 |
| A | 15 | 223 | 264399 | 2224.39 | 576 | 565 | 118.6 |
| A | 12 | 189 | 72480 | 606.32 | 576 | 565 | 118.6 |
| B | 7 | 202 | 374976 | 3438.45 | 561 | 547 | 108.9 |
| B | 5 | 255 | 264644 | 2425.25 | 561 | 547 | 108.9 |
| B | 4 | 171 | 130059 | 1189.33 | 561 | 547 | 108.9 |
| C | 15 | 214 | 217603 | 1661.54 | 561 | 565 | 130.6 |
| C | 9 | 54 | 11263 | 81.9 | 561 | 565 | 130.6 |
| C | 8 | 229 | 10214 | 73.87 | 561 | 565 | 130.6 |
| D | 13 | 249 | 1209149 | 9383.13 | 518 | 503 | 128.8 |
| D | 1 | 52 | 258616 | 2003.82 | 518 | 503 | 128.8 |
| D | 2 | 249 | 229286 | 1776.12 | 518 | 503 | 128.8 |
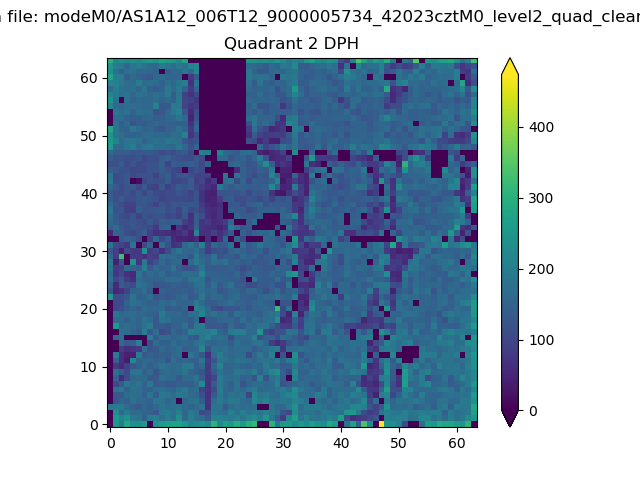
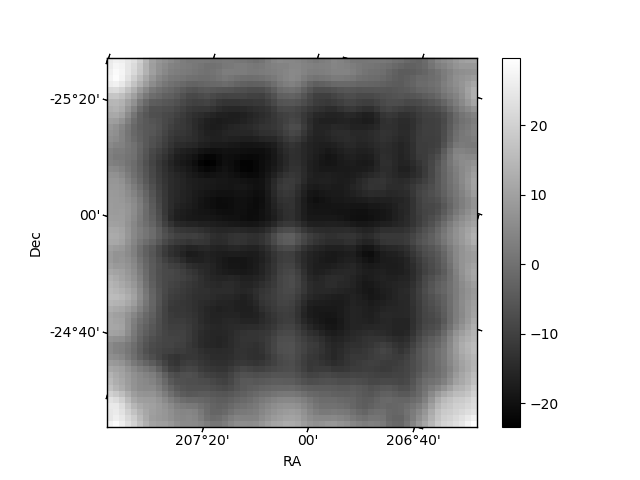
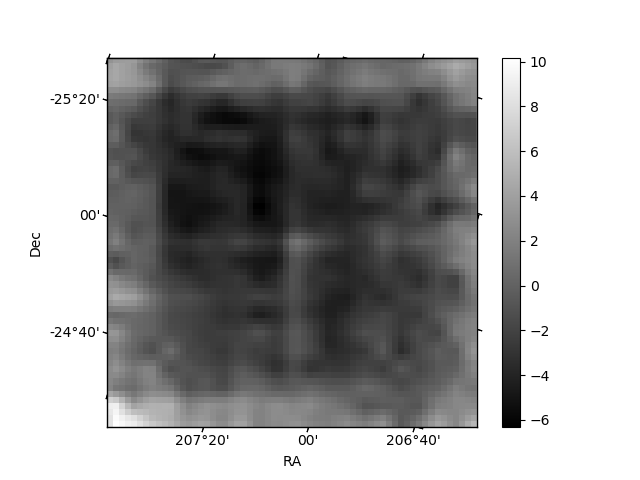
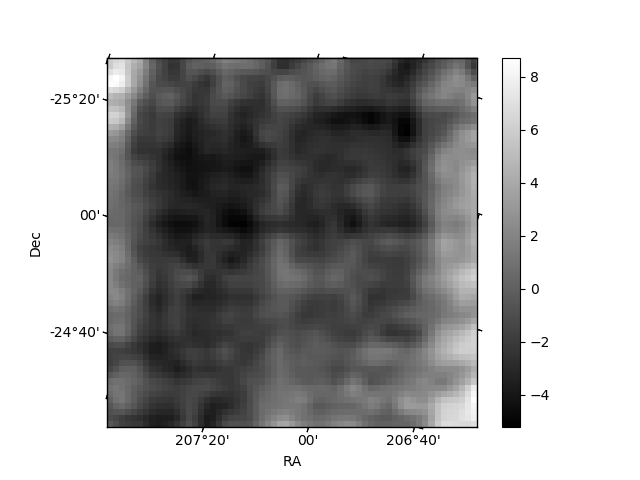
Histogram calculated using DETX and DETY for each event in the final _common_clean file
| Quadrant A | 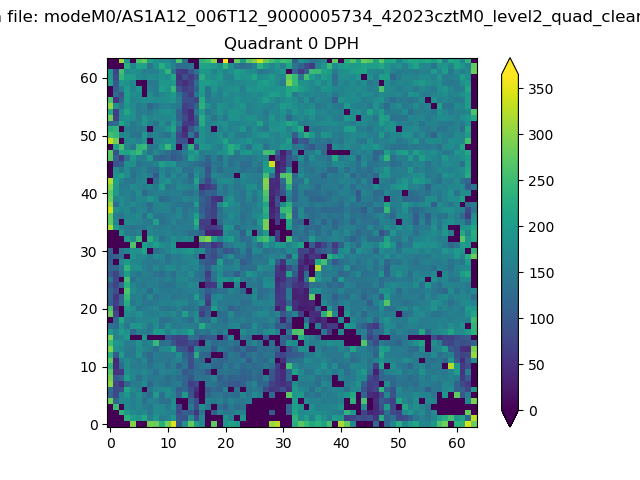 |
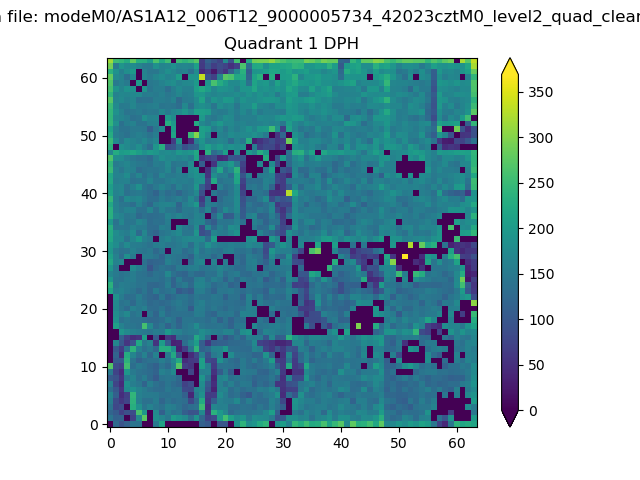 |
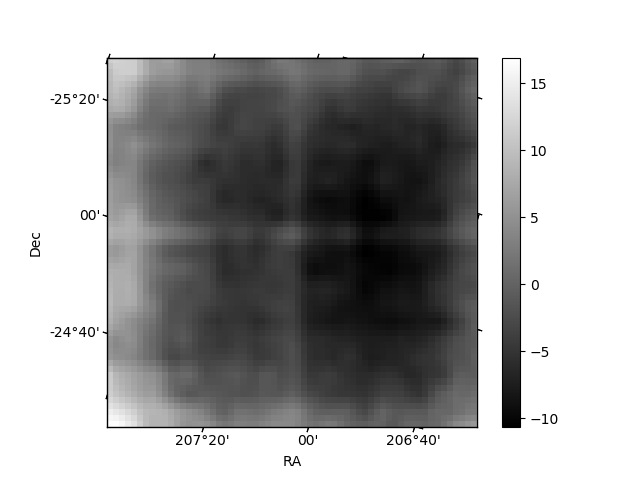
Quadrant B |
|---|---|---|---|
| Quadrant D | 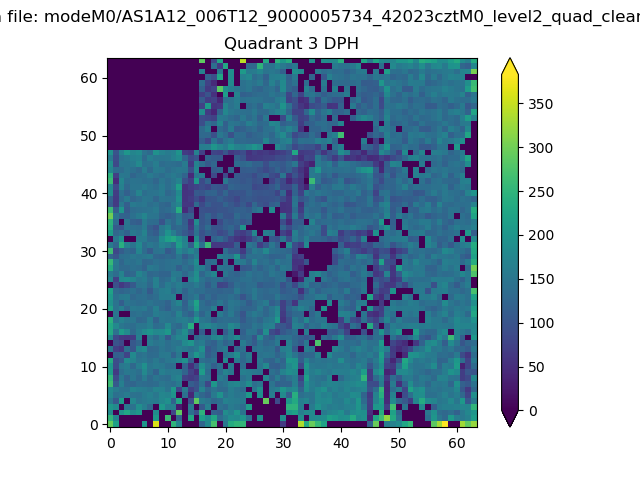 |
 |
Quadrant C |
| Plot type | Count rate plots | Images |
|---|---|---|
| Comparison with Poisson distribution Blue bars denote a histogram of data divided into 1 sec bins. Red curve is a Poisson curve with rate = median count rate of data. |
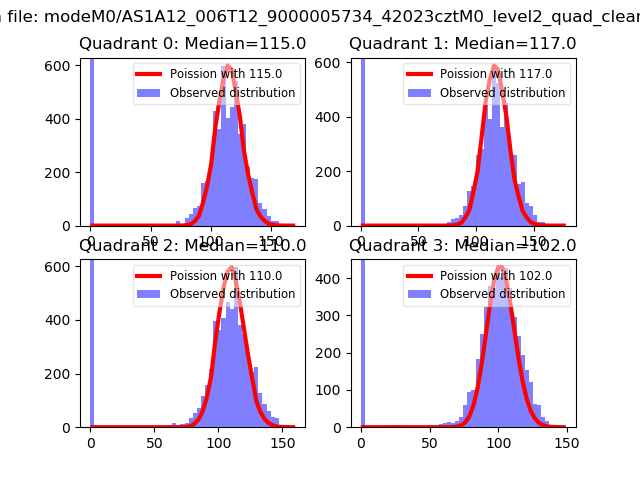 |
 |
| Quadrant-wise count rates Data is divided into 100 sec bins |
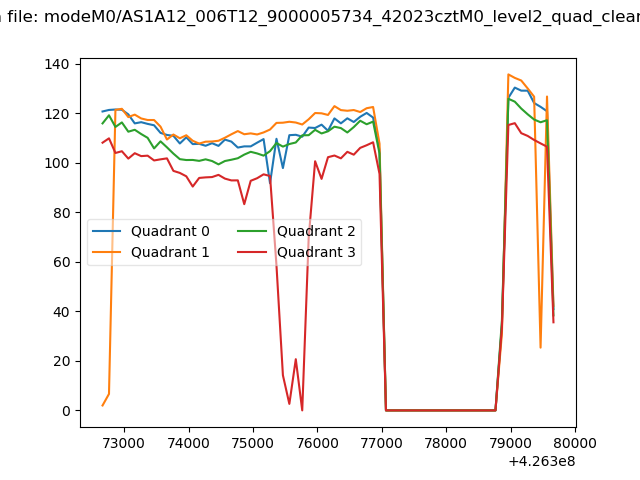 |
|
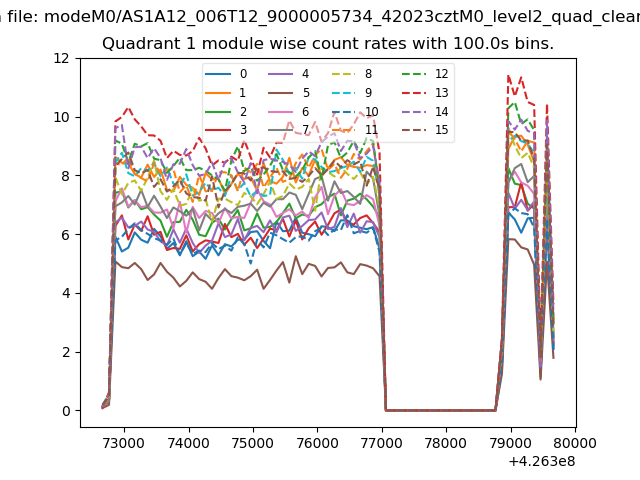
| Module-wise count rates for Quadrant A Data is divided into 100 sec bins |
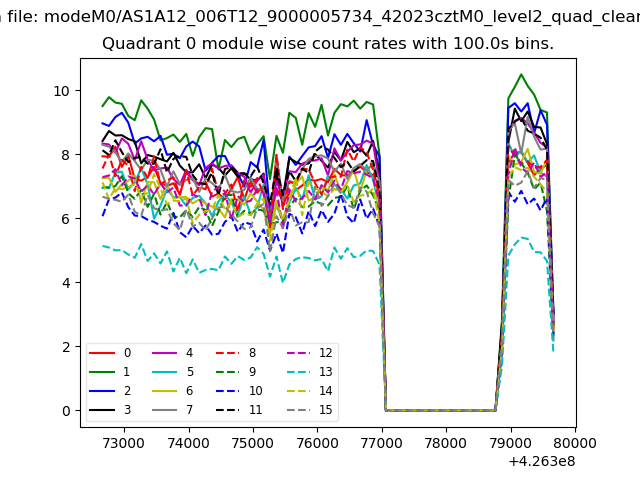 |
 |
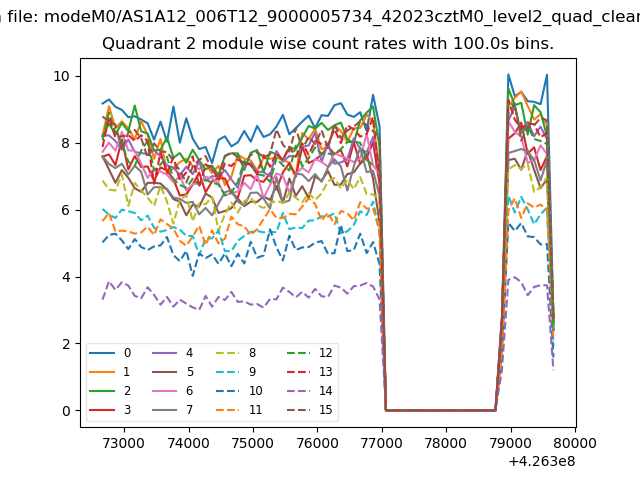
| Module-wise count rates for Quadrant B Data is divided into 100 sec bins |
 |
 |
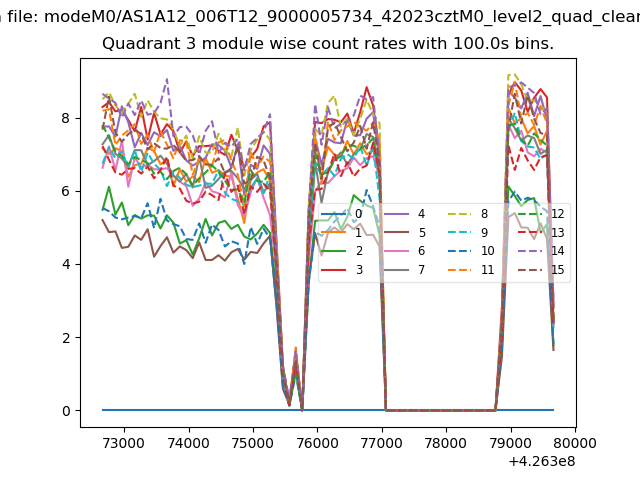
| Module-wise count rates for Quadrant C Data is divided into 100 sec bins |
 |
 |
| Module-wise count rates for Quadrant D Data is divided into 100 sec bins |
 |
 |
| Parameter | Plot |
|---|---|
| CZT HV Monitor | 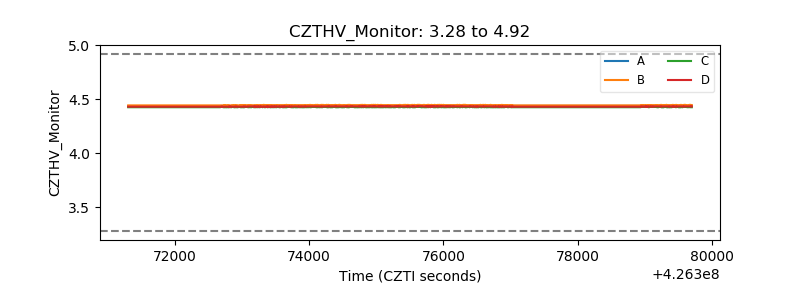 |
| D_VDD | 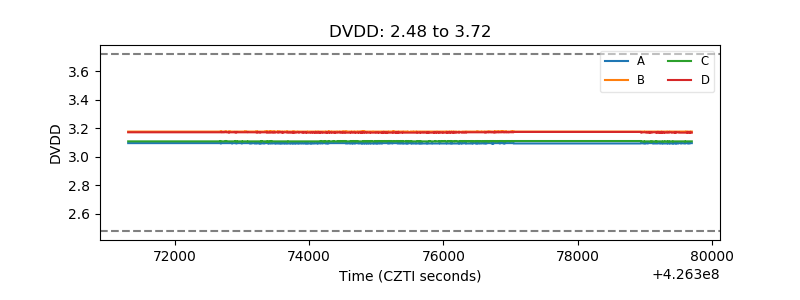 |
| Temperature 1 | 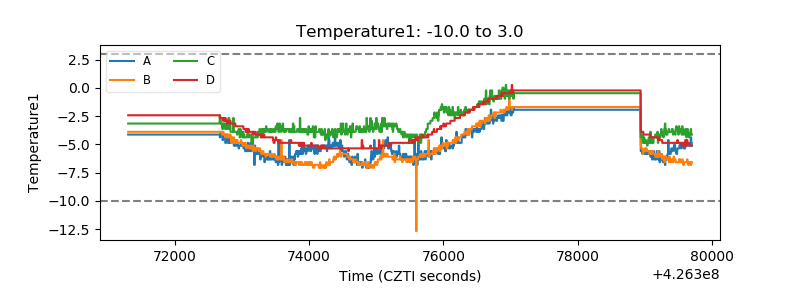 |
| Veto HV Monitor | 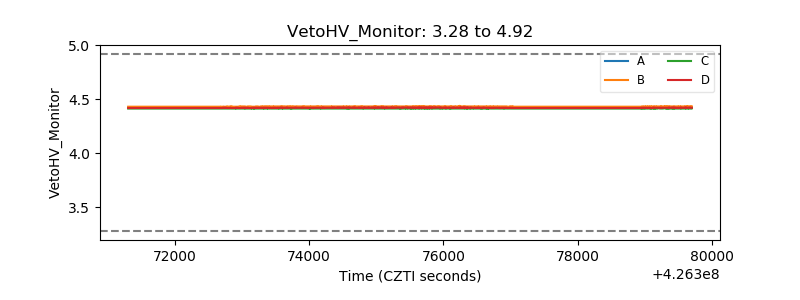 |
| Veto LLD | 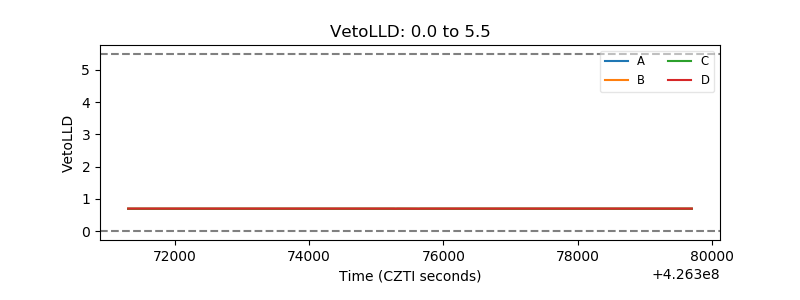 |
| Alpha Counter | 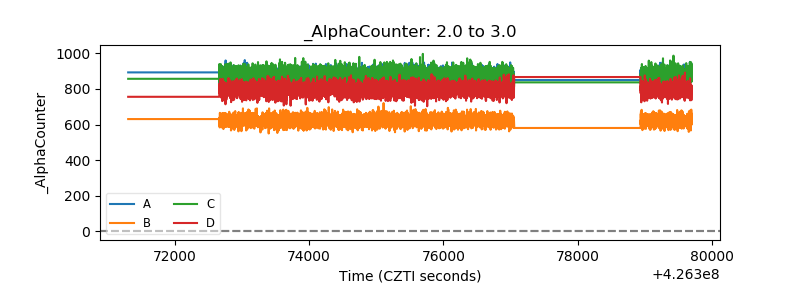 |
| _CPM_Rate | 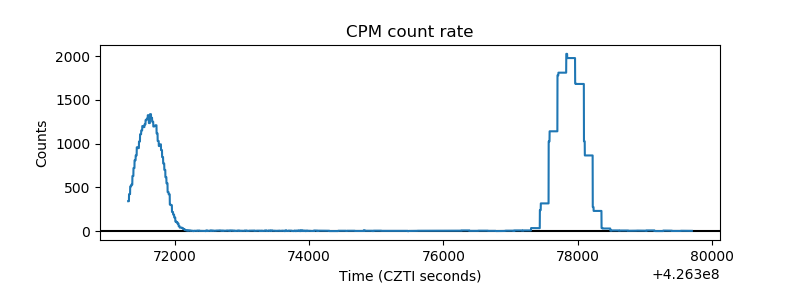 |
| CZT Counter | 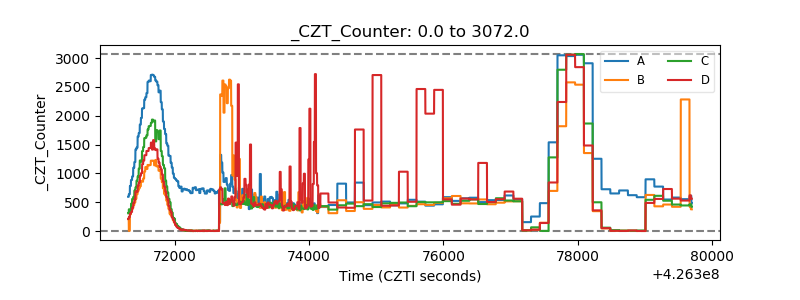 |
| +2.5 Volts monitor | 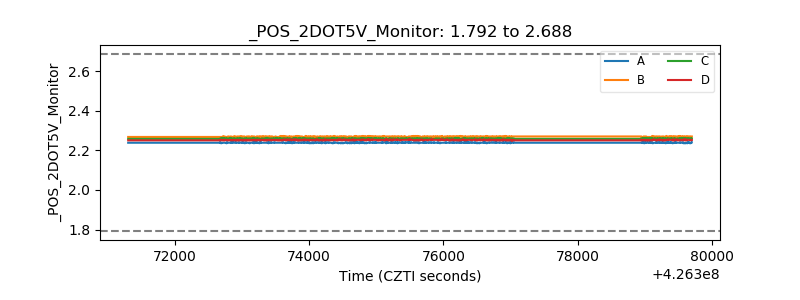 |
| +5 Volts monitor | 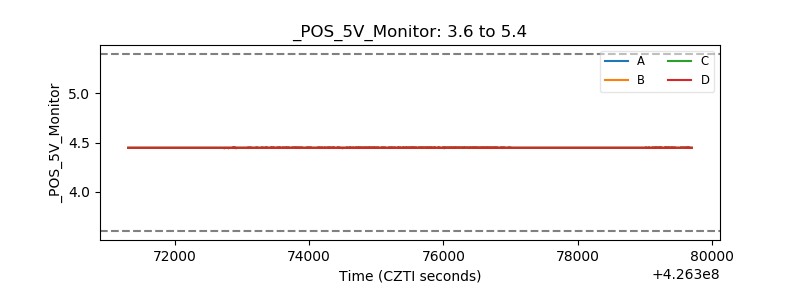 |
| _ROLL_ROT | 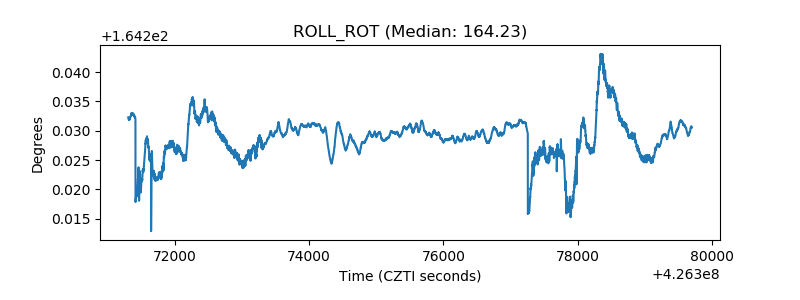 |
| _Roll_DEC | 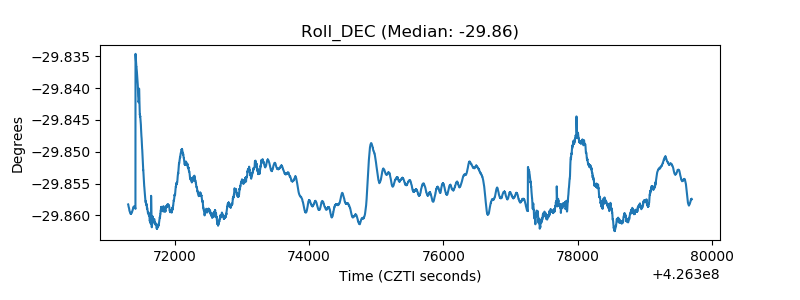 |
| _Roll_RA | 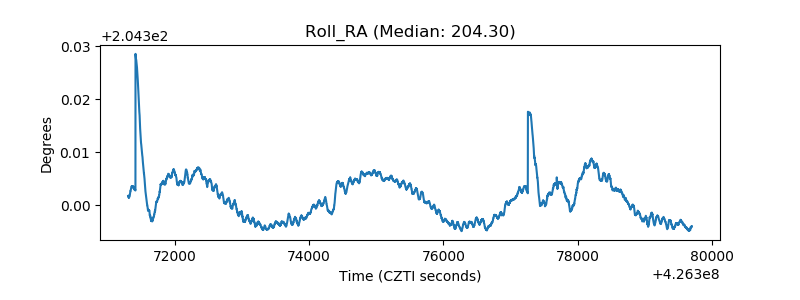 |
| Veto Counter |  |