| Param | Original file | Final file |
|---|---|---|
| Filename | modeM0/AS1A12_006T12_9000005734_42024cztM0_level2.fits | modeM0/AS1A12_006T12_9000005734_42024cztM0_level2_quad_clean.evt |
| Size (bytes) | 328,029,120 | 87,603,840 |
| Size | 312.8 MB | 83.5 MB |
| Events in quadrant A | 3,290,571 | 600,103 |
| Events in quadrant B | 2,845,915 | 608,153 |
| Events in quadrant C | 2,406,073 | 573,476 |
| Events in quadrant D | 3,210,000 | 519,898 |
| Mode M0 | |||
|---|---|---|---|
| Quadrant | BADHDUFLAG | Total packets | Discarded packets |
| A | 0 | 12820 | 2 |
| B | 0 | 11630 | 2 |
| C | 0 | 10084 | 2 |
| D | 0 | 12650 | 2 |
| Mode M9 | |||
|---|---|---|---|
| Quadrant | BADHDUFLAG | Total packets | Discarded packets |
| A | 0 | 38 | 0 |
| B | 0 | 39 | 0 |
| C | 0 | 39 | 0 |
| D | 0 | 39 | 0 |
| Mode SS | |||
|---|---|---|---|
| Quadrant | BADHDUFLAG | Total packets | Discarded packets |
| A | 0 | 102 | 0 |
| B | 0 | 104 | 0 |
| C | 0 | 104 | 0 |
| D | 0 | 104 | 0 |
| Quadrant | Total seconds | Saturated seconds | Saturation percentage |
|---|---|---|---|
| A | 5008 | 68 | 1.357827% |
| B | 5008 | 133 | 2.655751% |
| C | 5007 | 3 | 0.059916% |
| D | 5007 | 118 | 2.356701% |
Noise dominated data is calculated using 1-second bins in cleaned event files. If a bin has >2000 counts, and if more than 50% of those come from <1% of pixels, then it is considered to be noise-dominated and hence unusable.
| Quadrant | # 1 sec bins | Bins with >0 counts | Bins with >2000 counts | High rate bins dominated by noise | Noise dominated (total time) | Noise dominated (detector-on time) | Marked lightcurve |
|---|---|---|---|---|---|---|---|
| A | 7010 | 5009 | 62 | 62 | 0.88% | 1.24% | 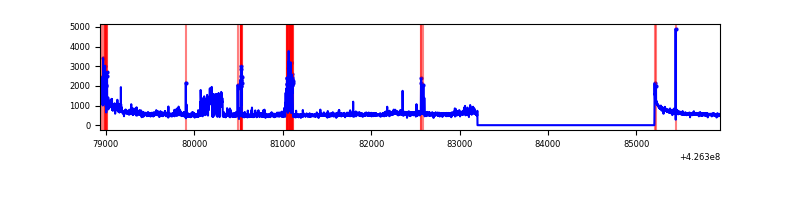 |
| B | 7010 | 5009 | 88 | 88 | 1.26% | 1.76% | 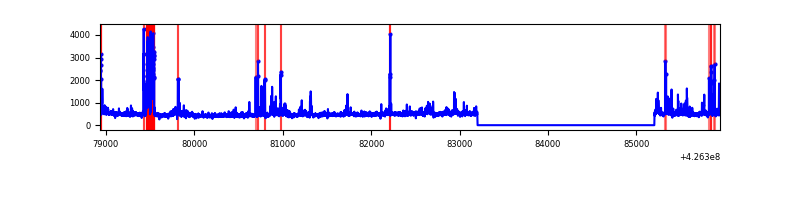 |
| C | 7009 | 5008 | 0 | 0 | 0.00% | 0.00% | 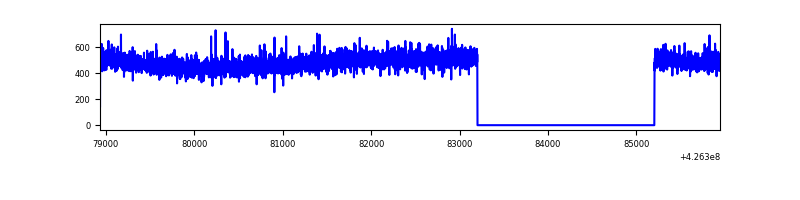 |
| D | 7009 | 5008 | 104 | 104 | 1.48% | 2.08% | 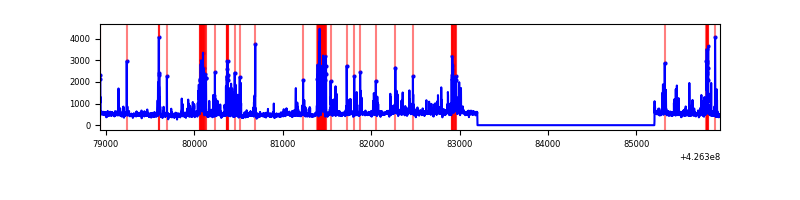 |
Top three noisy pixels from each quadrant. If the there are fewer than three noisy pixels in the level2.evt file, extra rows are filled as -1
| Pixel properties | Quadrant properties | ||||||
|---|---|---|---|---|---|---|---|
| Quadrant | DetID | PixID | Counts | Sigma | Mean | Median | Sigma |
| A | 15 | 223 | 534247 | 4453.2 | 579 | 567 | 119.8 |
| A | 10 | 83 | 502525 | 4188.5 | 579 | 567 | 119.8 |
| A | 12 | 189 | 9216 | 72.17 | 579 | 567 | 119.8 |
| B | 5 | 255 | 328110 | 2949.44 | 572 | 556 | 111.1 |
| B | 4 | 171 | 187692 | 1685.06 | 572 | 556 | 111.1 |
| B | 0 | 155 | 33142 | 293.42 | 572 | 556 | 111.1 |
| C | 15 | 214 | 210518 | 1609.94 | 560 | 564 | 130.4 |
| C | 8 | 79 | 5455 | 37.5 | 560 | 564 | 130.4 |
| C | 9 | 54 | 4369 | 29.18 | 560 | 564 | 130.4 |
| D | 2 | 249 | 405328 | 2949.8 | 550 | 533 | 137.2 |
| D | 1 | 52 | 363772 | 2646.97 | 550 | 533 | 137.2 |
| D | 12 | 6 | 130773 | 949.08 | 550 | 533 | 137.2 |
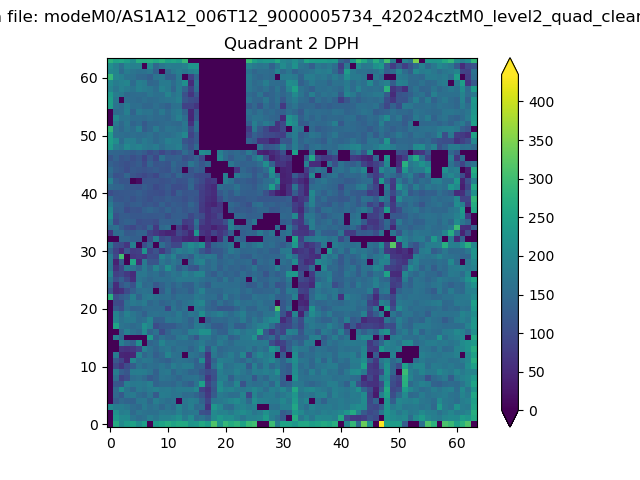
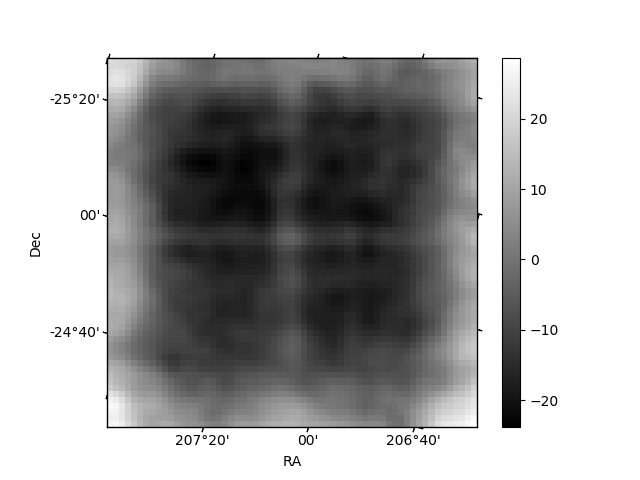
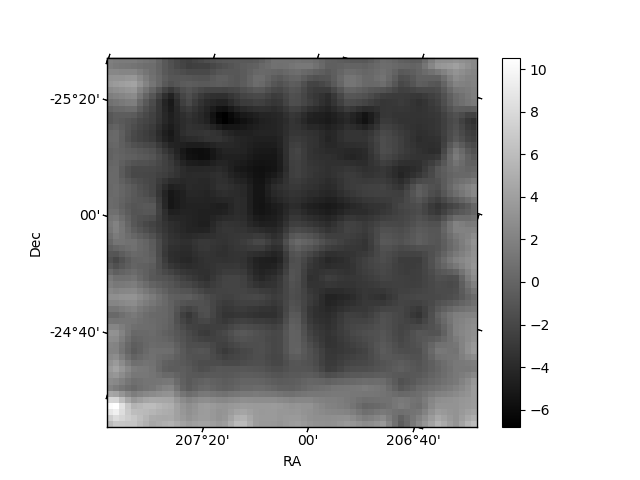
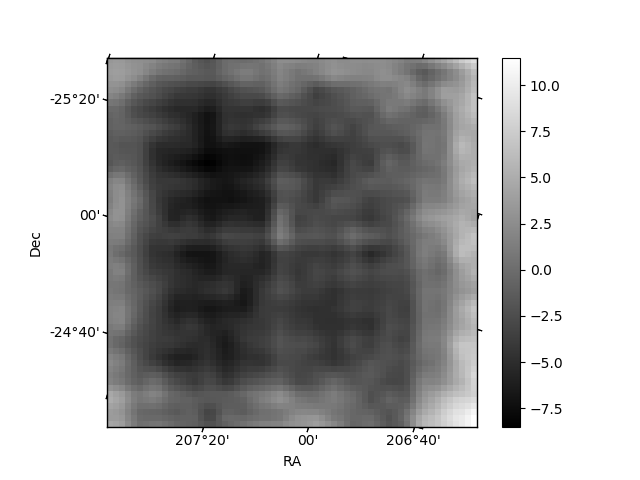
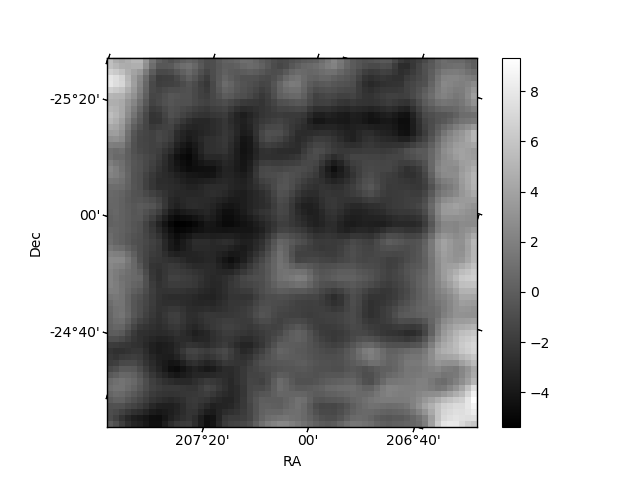
Histogram calculated using DETX and DETY for each event in the final _common_clean file
| Quadrant A | 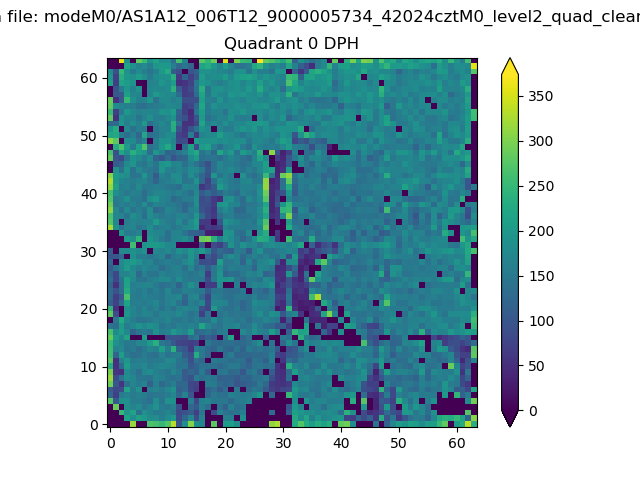 |
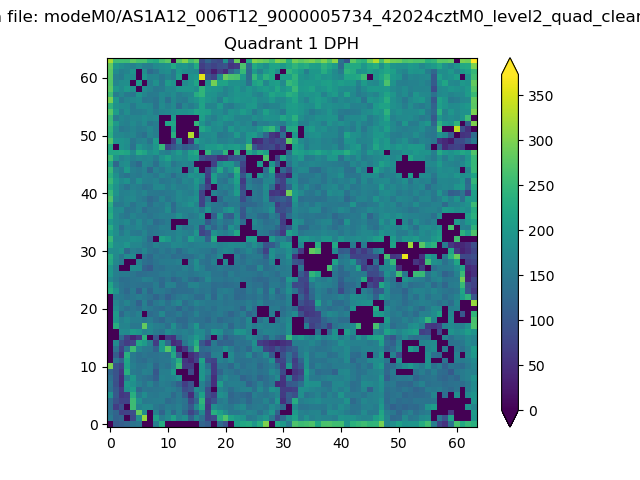 |
Quadrant B |
|---|---|---|---|
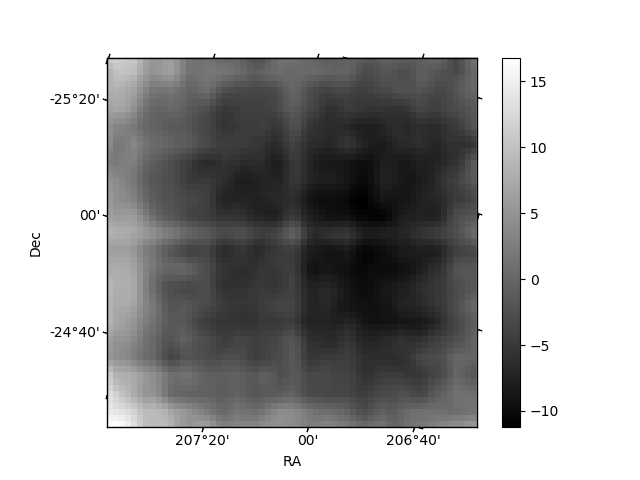
| Quadrant D | 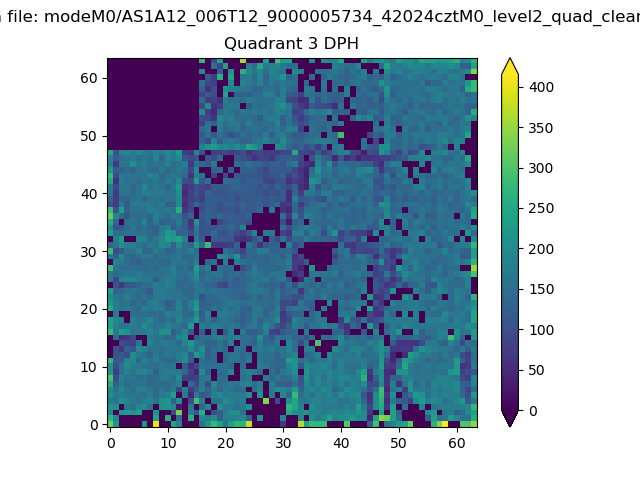 |
 |
Quadrant C |
| Plot type | Count rate plots | Images |
|---|---|---|
| Comparison with Poisson distribution Blue bars denote a histogram of data divided into 1 sec bins. Red curve is a Poisson curve with rate = median count rate of data. |
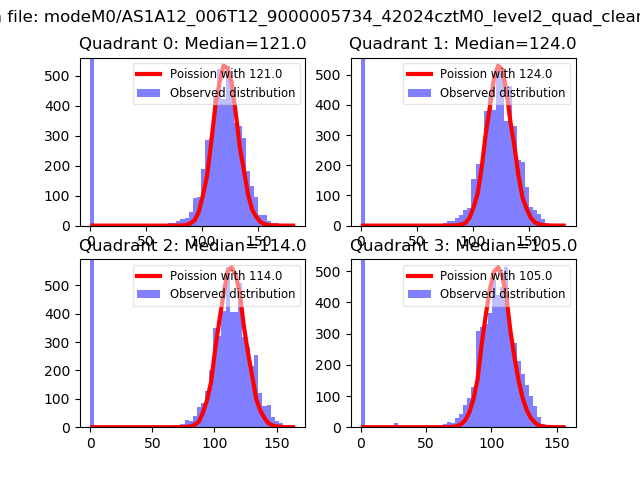 |
 |
| Quadrant-wise count rates Data is divided into 100 sec bins |
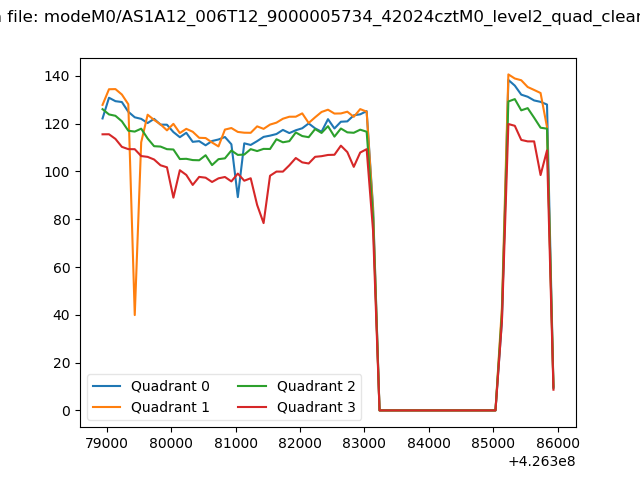 |
|
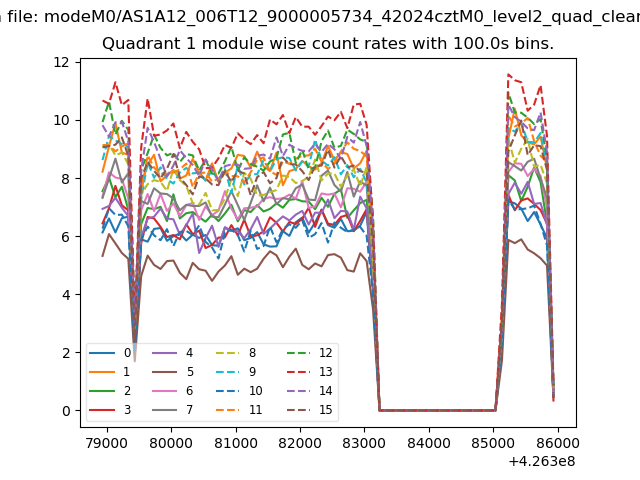
| Module-wise count rates for Quadrant A Data is divided into 100 sec bins |
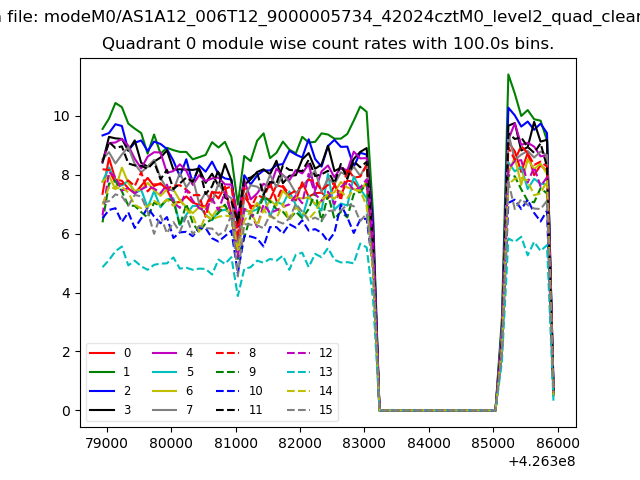 |
 |
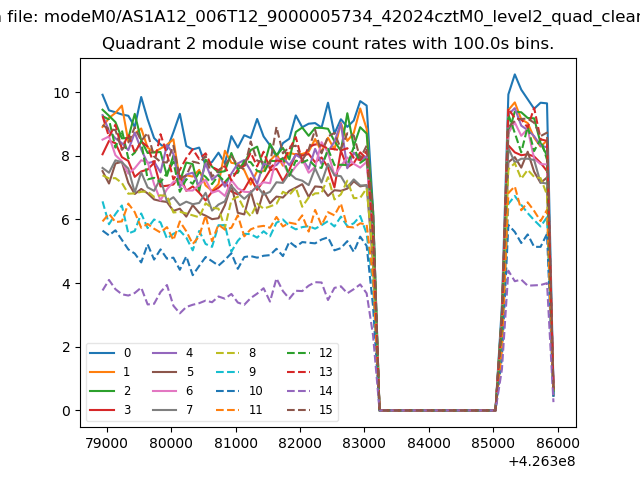
| Module-wise count rates for Quadrant B Data is divided into 100 sec bins |
 |
 |
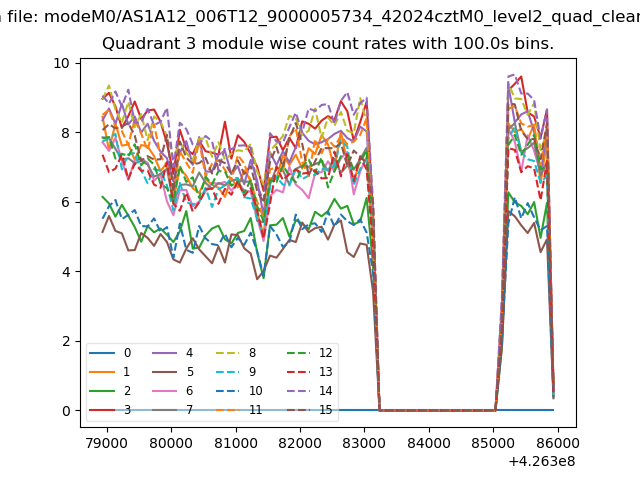
| Module-wise count rates for Quadrant C Data is divided into 100 sec bins |
 |
 |
| Module-wise count rates for Quadrant D Data is divided into 100 sec bins |
 |
 |
| Parameter | Plot |
|---|---|
| CZT HV Monitor | 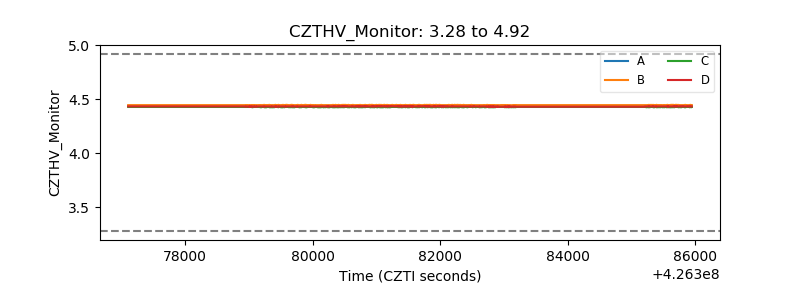 |
| D_VDD | 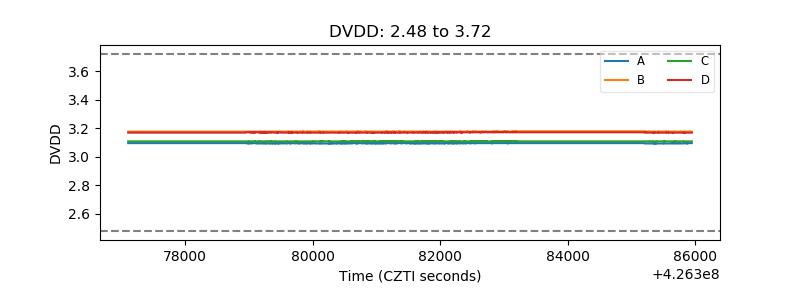 |
| Temperature 1 | 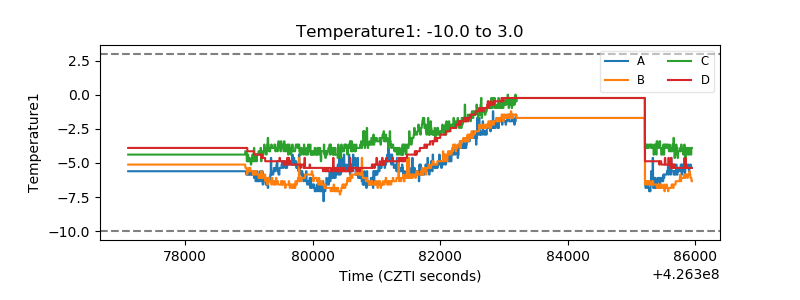 |
| Veto HV Monitor | 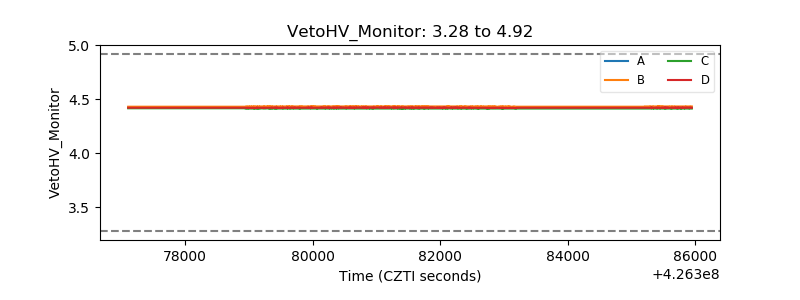 |
| Veto LLD | 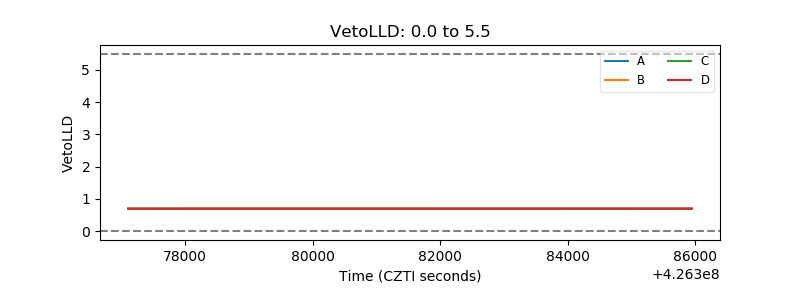 |
| Alpha Counter | 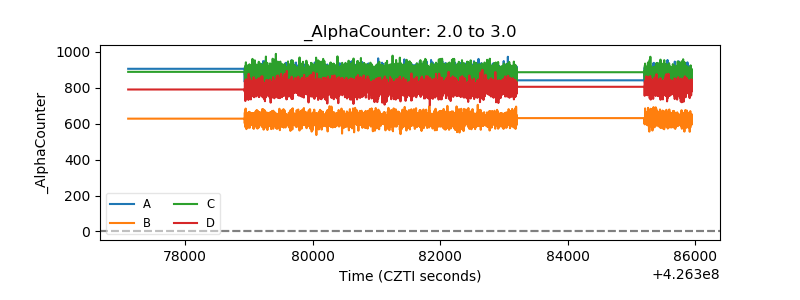 |
| _CPM_Rate |  |
| CZT Counter | 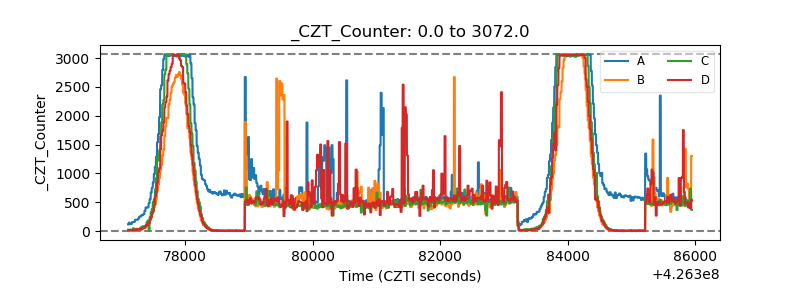 |
| +2.5 Volts monitor | 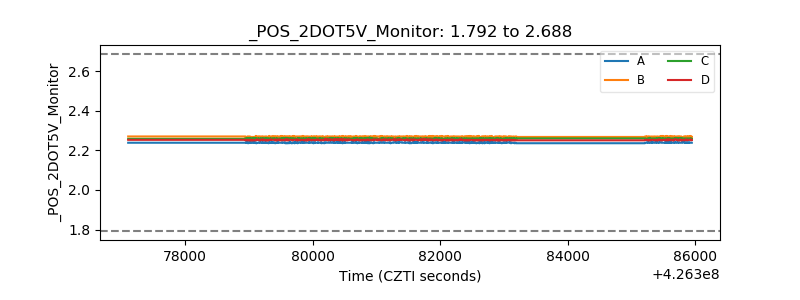 |
| +5 Volts monitor | 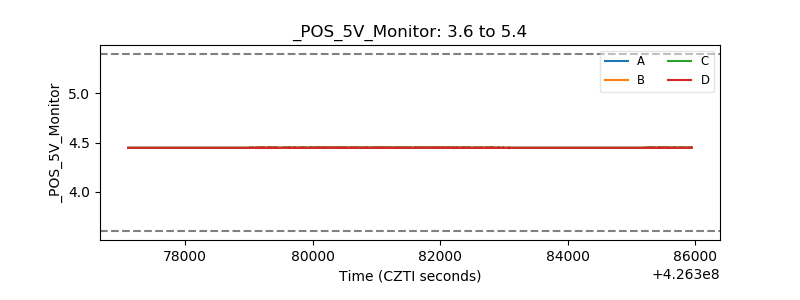 |
| _ROLL_ROT | 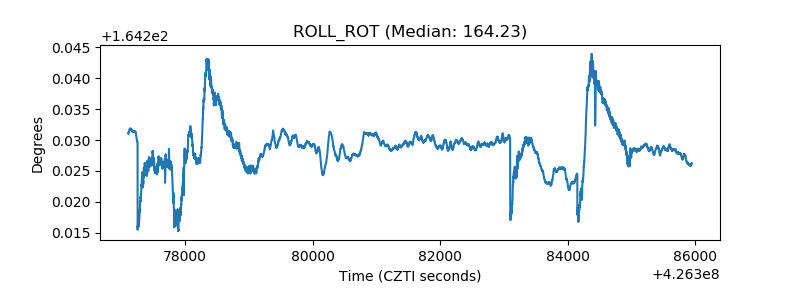 |
| _Roll_DEC | 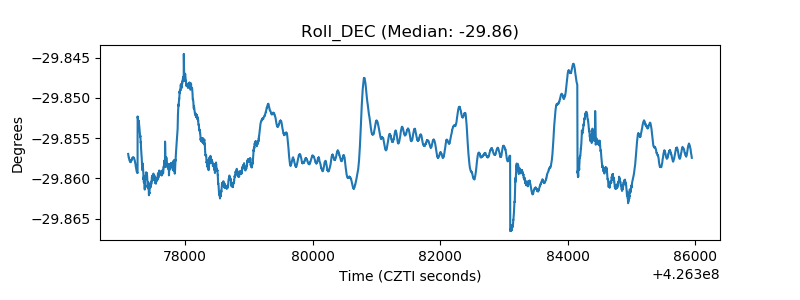 |
| _Roll_RA | 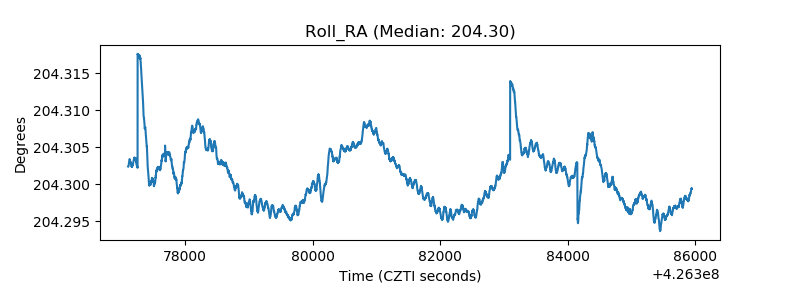 |
| Veto Counter | 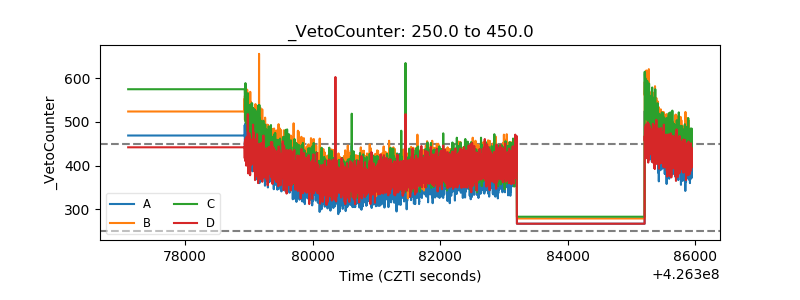 |