| Param | Original file | Final file |
|---|---|---|
| Filename | modeM0/AS1A12_006T12_9000005734_42025cztM0_level2.fits | modeM0/AS1A12_006T12_9000005734_42025cztM0_level2_quad_clean.evt |
| Size (bytes) | 326,750,400 | 87,595,200 |
| Size | 311.6 MB | 83.5 MB |
| Events in quadrant A | 3,020,317 | 602,392 |
| Events in quadrant B | 2,886,186 | 615,303 |
| Events in quadrant C | 2,411,250 | 577,679 |
| Events in quadrant D | 3,394,638 | 512,055 |
| Mode M0 | |||
|---|---|---|---|
| Quadrant | BADHDUFLAG | Total packets | Discarded packets |
| A | 0 | 11879 | 2 |
| B | 0 | 11615 | 2 |
| C | 0 | 9910 | 2 |
| D | 0 | 13288 | 2 |
| Mode M9 | |||
|---|---|---|---|
| Quadrant | BADHDUFLAG | Total packets | Discarded packets |
| A | 0 | 29 | 0 |
| B | 0 | 29 | 0 |
| C | 0 | 30 | 0 |
| D | 0 | 30 | 0 |
| Mode SS | |||
|---|---|---|---|
| Quadrant | BADHDUFLAG | Total packets | Discarded packets |
| A | 0 | 102 | 0 |
| B | 0 | 102 | 0 |
| C | 0 | 102 | 0 |
| D | 0 | 102 | 0 |
| Quadrant | Total seconds | Saturated seconds | Saturation percentage |
|---|---|---|---|
| A | 4914 | 58 | 1.180301% |
| B | 4914 | 136 | 2.767603% |
| C | 4914 | 5 | 0.101750% |
| D | 4914 | 213 | 4.334554% |
Noise dominated data is calculated using 1-second bins in cleaned event files. If a bin has >2000 counts, and if more than 50% of those come from <1% of pixels, then it is considered to be noise-dominated and hence unusable.
| Quadrant | # 1 sec bins | Bins with >0 counts | Bins with >2000 counts | High rate bins dominated by noise | Noise dominated (total time) | Noise dominated (detector-on time) | Marked lightcurve |
|---|---|---|---|---|---|---|---|
| A | 7007 | 4915 | 40 | 40 | 0.57% | 0.81% | 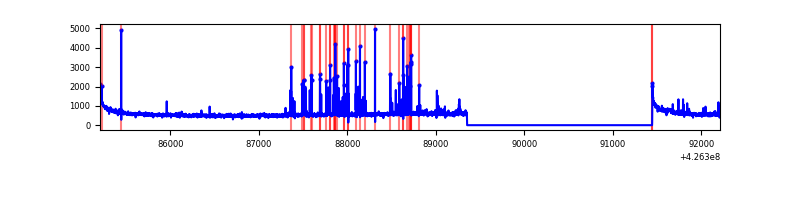 |
| B | 7007 | 4915 | 69 | 69 | 0.98% | 1.40% | 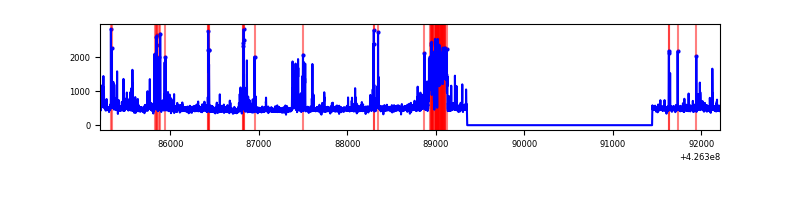 |
| C | 7007 | 4915 | 0 | 0 | 0.00% | 0.00% | 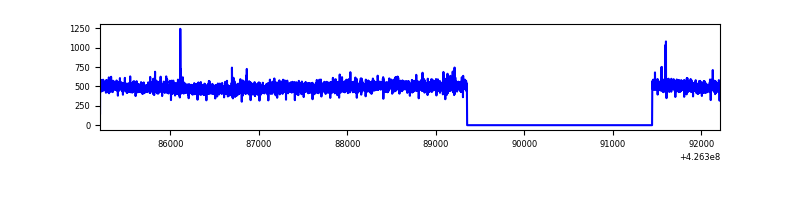 |
| D | 7007 | 4915 | 165 | 165 | 2.35% | 3.36% | 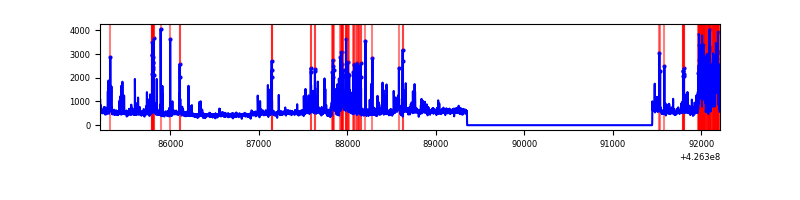 |
Top three noisy pixels from each quadrant. If the there are fewer than three noisy pixels in the level2.evt file, extra rows are filled as -1
| Pixel properties | Quadrant properties | ||||||
|---|---|---|---|---|---|---|---|
| Quadrant | DetID | PixID | Counts | Sigma | Mean | Median | Sigma |
| A | 10 | 83 | 506312 | 4308.02 | 578 | 568 | 117.4 |
| A | 15 | 223 | 246543 | 2095.26 | 578 | 568 | 117.4 |
| A | 12 | 189 | 11685 | 94.7 | 578 | 568 | 117.4 |
| B | 0 | 186 | 258766 | 2336.74 | 575 | 559 | 110.5 |
| B | 4 | 171 | 232469 | 2098.76 | 575 | 559 | 110.5 |
| B | 5 | 255 | 104496 | 940.62 | 575 | 559 | 110.5 |
| C | 15 | 214 | 208472 | 1586.97 | 561 | 564 | 131.0 |
| C | 8 | 79 | 7758 | 54.91 | 561 | 564 | 131.0 |
| C | 15 | 111 | 5153 | 35.03 | 561 | 564 | 131.0 |
| D | 2 | 249 | 614841 | 4594.85 | 548 | 533 | 133.7 |
| D | 1 | 52 | 358296 | 2675.97 | 548 | 533 | 133.7 |
| D | 13 | 249 | 146955 | 1095.2 | 548 | 533 | 133.7 |
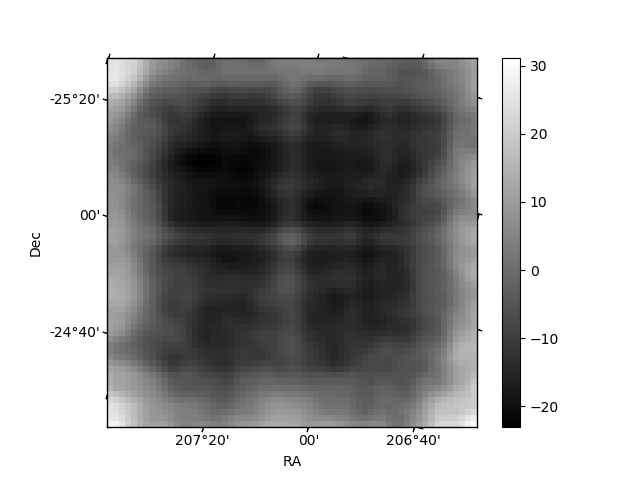
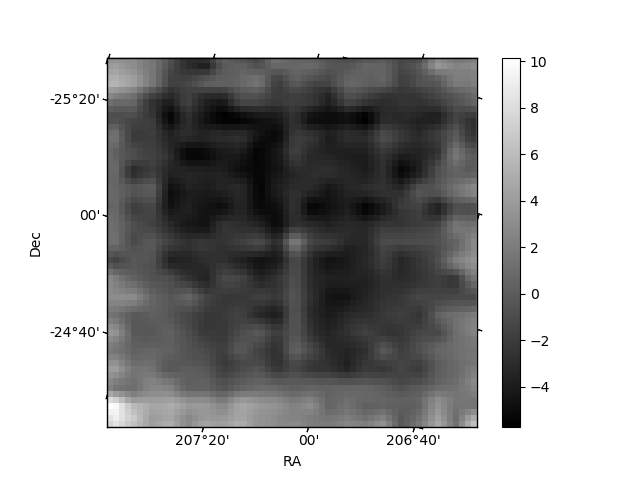
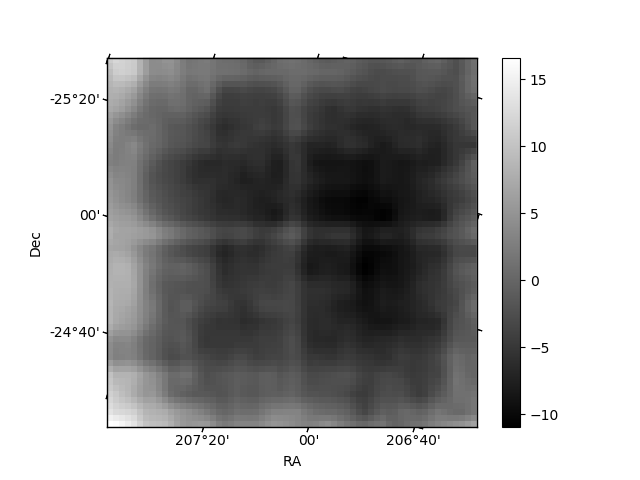
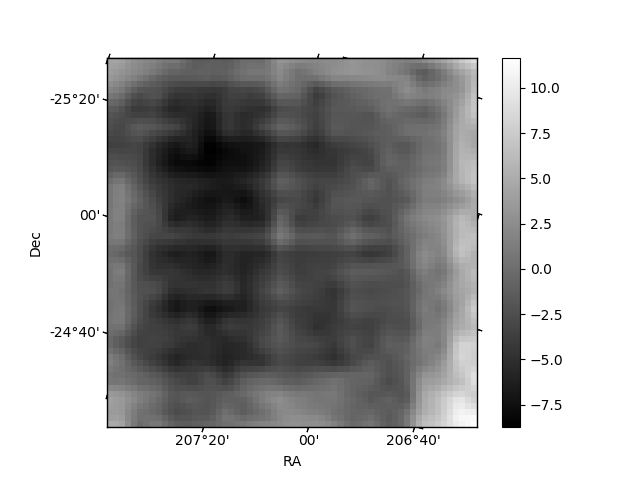
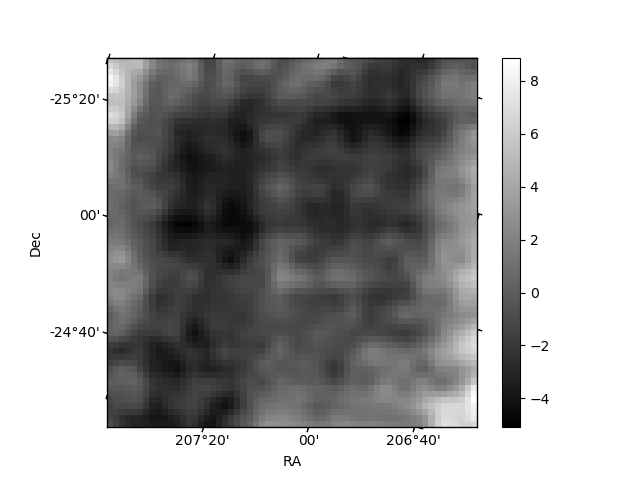
Histogram calculated using DETX and DETY for each event in the final _common_clean file
| Quadrant A | 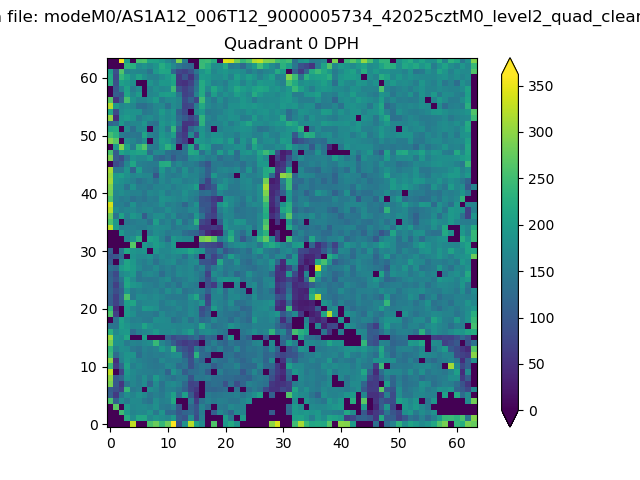 |
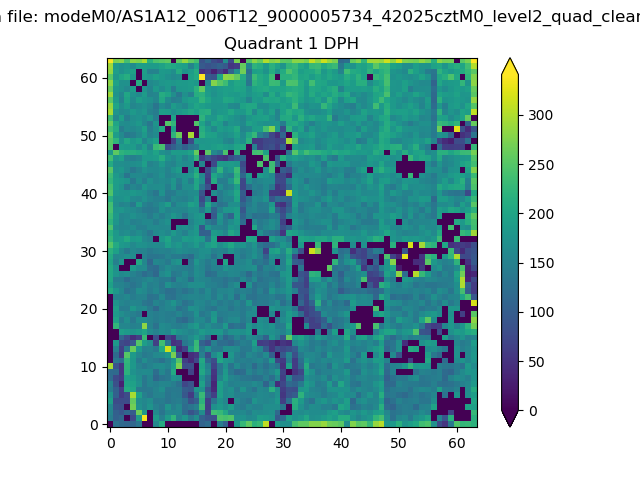 |
Quadrant B |
|---|---|---|---|
| Quadrant D | 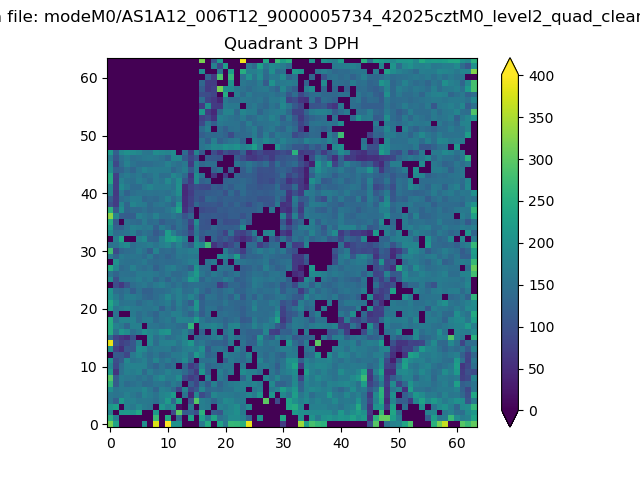 |
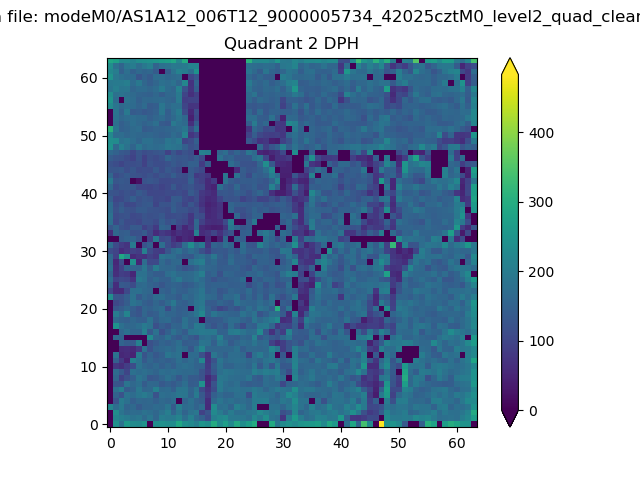 |
Quadrant C |
| Plot type | Count rate plots | Images |
|---|---|---|
| Comparison with Poisson distribution Blue bars denote a histogram of data divided into 1 sec bins. Red curve is a Poisson curve with rate = median count rate of data. |
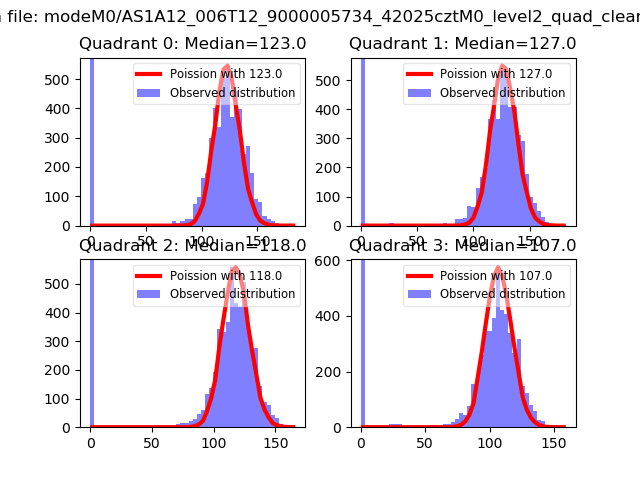 |
 |
| Quadrant-wise count rates Data is divided into 100 sec bins |
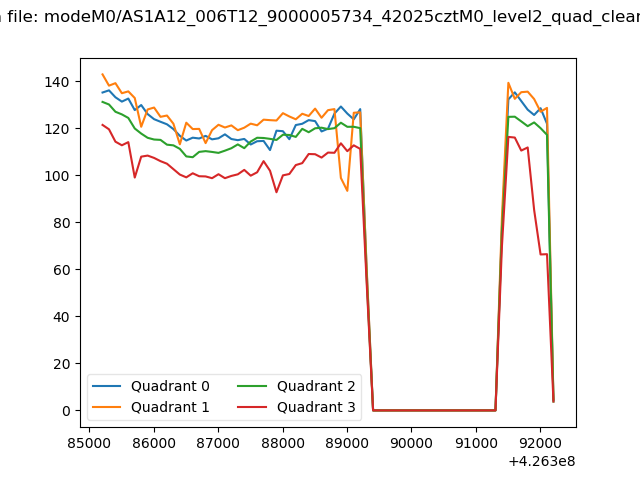 |
|
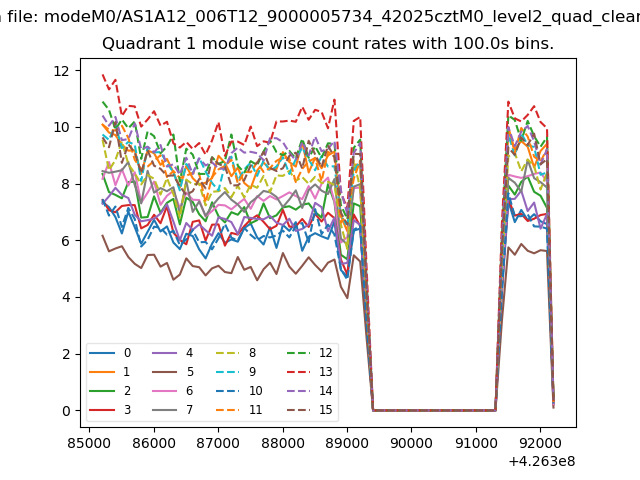
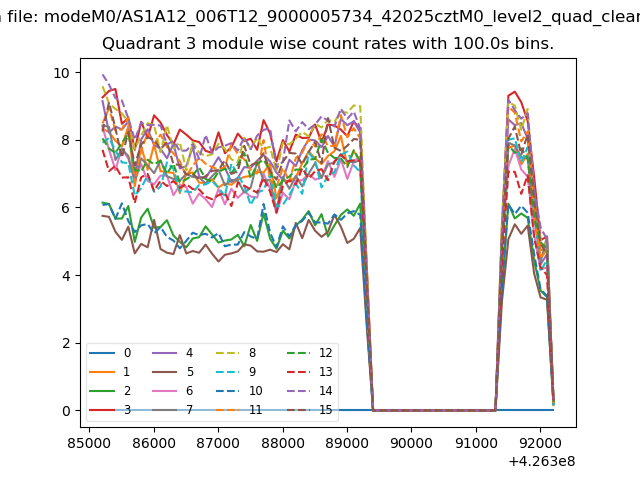
| Module-wise count rates for Quadrant A Data is divided into 100 sec bins |
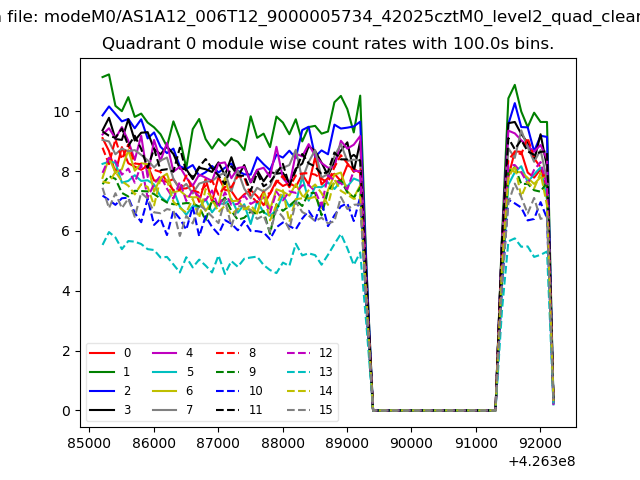 |
 |
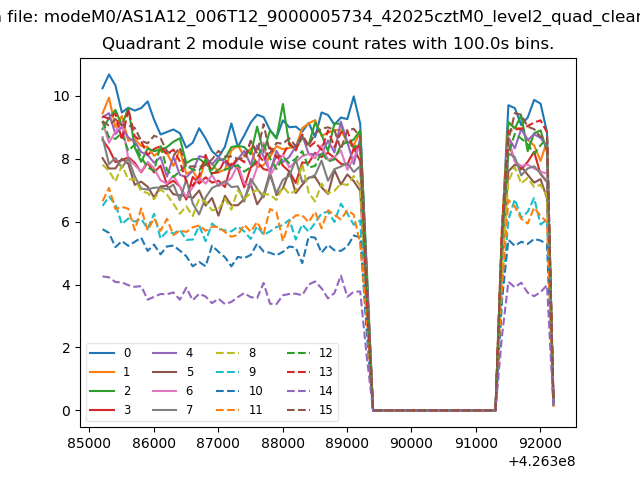
| Module-wise count rates for Quadrant B Data is divided into 100 sec bins |
 |
 |
| Module-wise count rates for Quadrant C Data is divided into 100 sec bins |
 |
 |
| Module-wise count rates for Quadrant D Data is divided into 100 sec bins |
 |
 |
| Parameter | Plot |
|---|---|
| CZT HV Monitor | 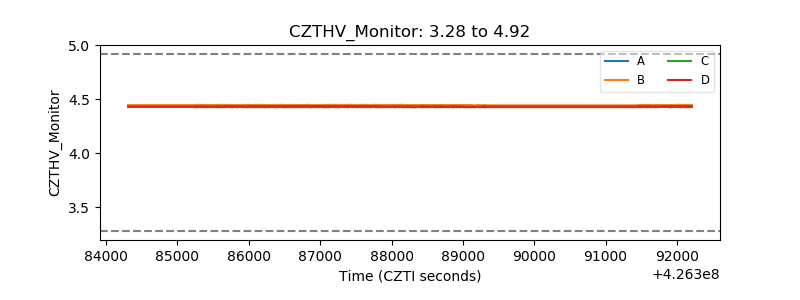 |
| D_VDD | 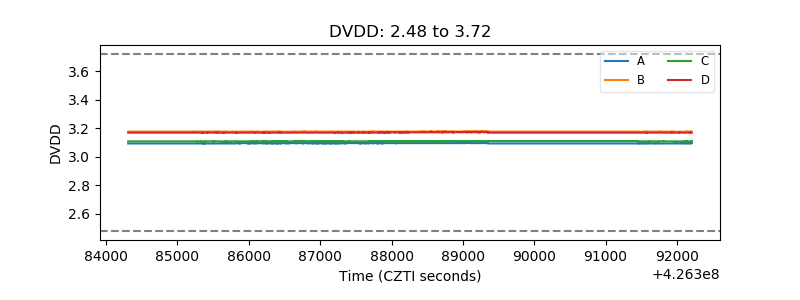 |
| Temperature 1 | 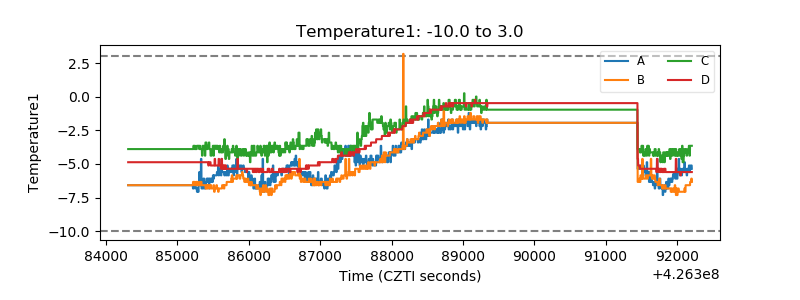 |
| Veto HV Monitor |  |
| Veto LLD | 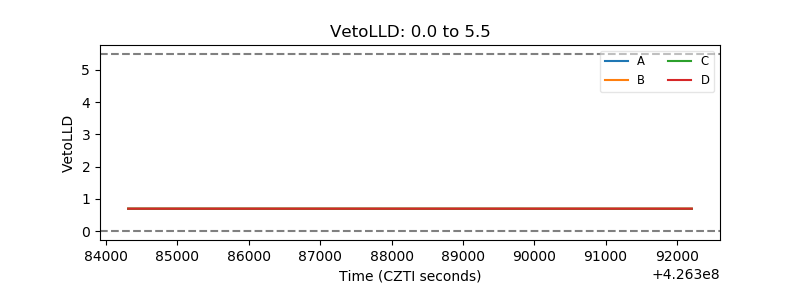 |
| Alpha Counter | 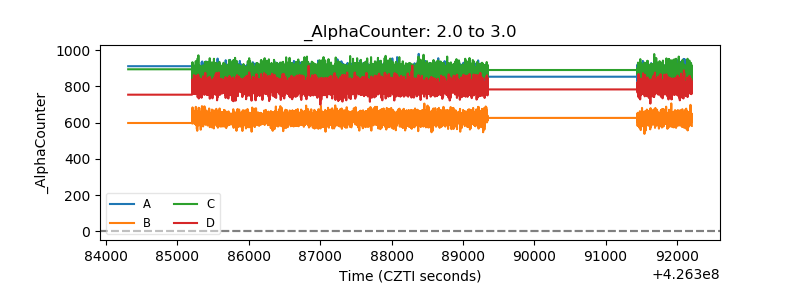 |
| _CPM_Rate | 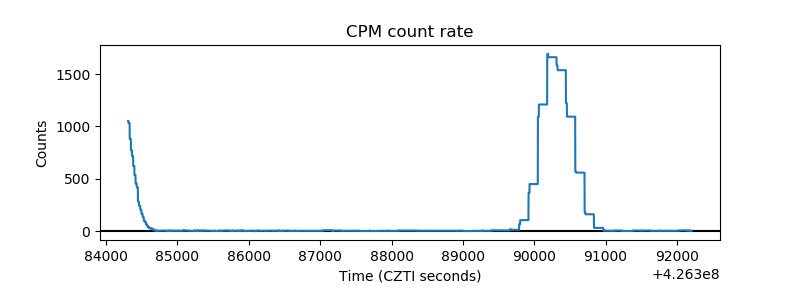 |
| CZT Counter | 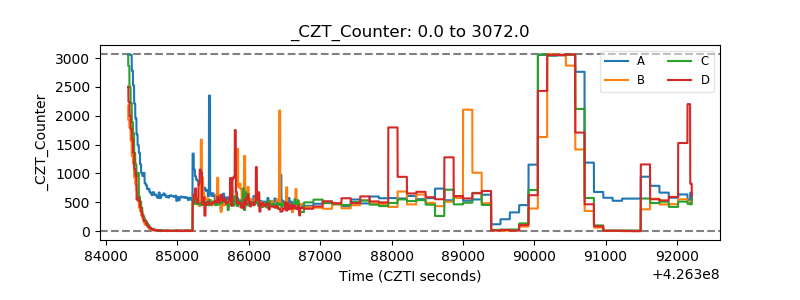 |
| +2.5 Volts monitor | 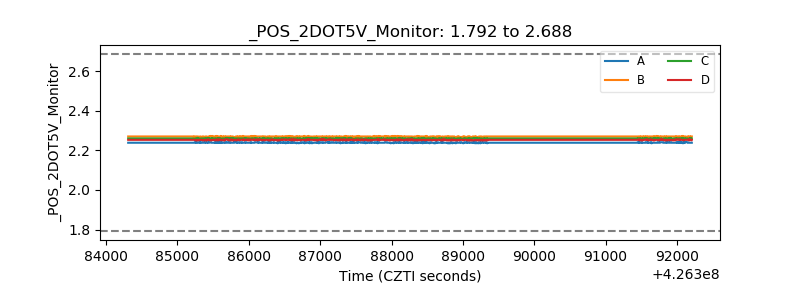 |
| +5 Volts monitor | 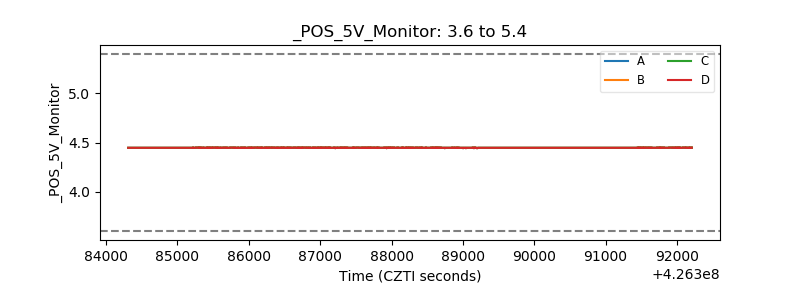 |
| _ROLL_ROT |  |
| _Roll_DEC | 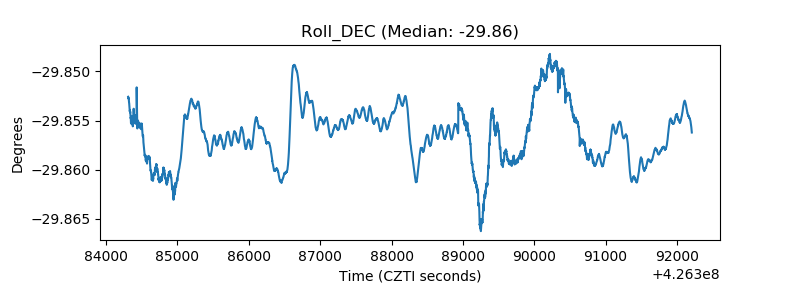 |
| _Roll_RA | 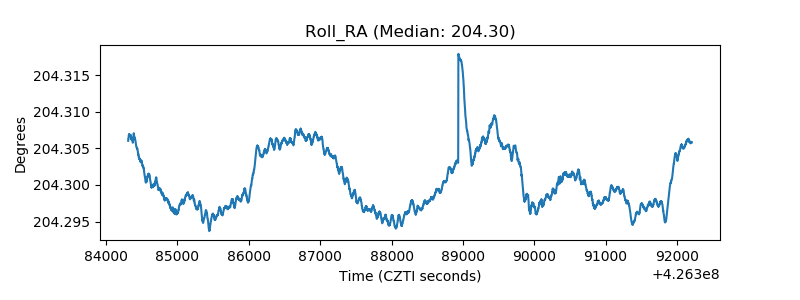 |
| Veto Counter | 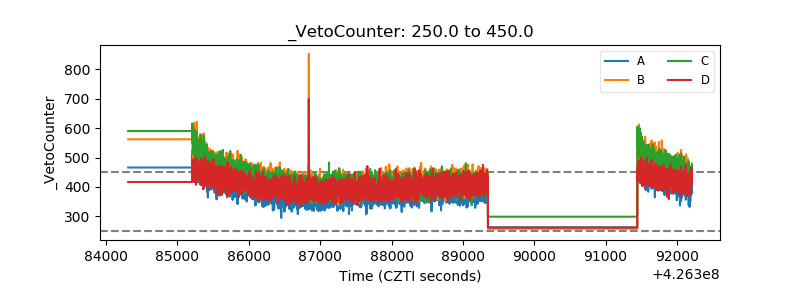 |