| Param | Original file | Final file |
|---|---|---|
| Filename | modeM0/AS1A12_006T12_9000005734_42026cztM0_level2.fits | modeM0/AS1A12_006T12_9000005734_42026cztM0_level2_quad_clean.evt |
| Size (bytes) | 1,428,696,000 | 375,321,600 |
| Size | 1.3 GB | 357.9 MB |
| Events in quadrant A | 13,231,038 | 2,571,586 |
| Events in quadrant B | 12,335,465 | 2,611,897 |
| Events in quadrant C | 10,580,147 | 2,478,811 |
| Events in quadrant D | 15,027,758 | 2,180,274 |
| Mode M0 | |||
|---|---|---|---|
| Quadrant | BADHDUFLAG | Total packets | Discarded packets |
| A | 0 | 52415 | 8 |
| B | 0 | 51143 | 5 |
| C | 0 | 44605 | 5 |
| D | 0 | 58796 | 5 |
| Mode M9 | |||
|---|---|---|---|
| Quadrant | BADHDUFLAG | Total packets | Discarded packets |
| A | 0 | 100 | 0 |
| B | 0 | 100 | 0 |
| C | 0 | 100 | 0 |
| D | 0 | 100 | 0 |
| Mode SS | |||
|---|---|---|---|
| Quadrant | BADHDUFLAG | Total packets | Discarded packets |
| A | 0 | 450 | 0 |
| B | 0 | 450 | 0 |
| C | 0 | 450 | 0 |
| D | 0 | 450 | 0 |
| Quadrant | Total seconds | Saturated seconds | Saturation percentage |
|---|---|---|---|
| A | 22121 | 238 | 1.075901% |
| B | 22123 | 576 | 2.603625% |
| C | 22123 | 15 | 0.067803% |
| D | 22122 | 1134 | 5.126119% |
Noise dominated data is calculated using 1-second bins in cleaned event files. If a bin has >2000 counts, and if more than 50% of those come from <1% of pixels, then it is considered to be noise-dominated and hence unusable.
| Quadrant | # 1 sec bins | Bins with >0 counts | Bins with >2000 counts | High rate bins dominated by noise | Noise dominated (total time) | Noise dominated (detector-on time) | Marked lightcurve |
|---|---|---|---|---|---|---|---|
| A | 31983 | 22127 | 180 | 180 | 0.56% | 0.81% | 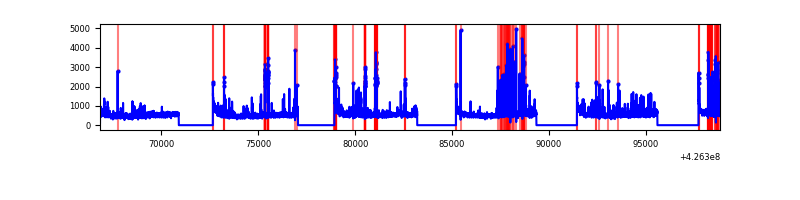 |
| B | 31984 | 22128 | 394 | 394 | 1.23% | 1.78% | 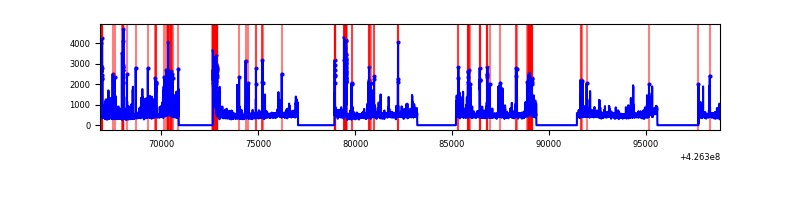 |
| C | 31984 | 22128 | 0 | 0 | 0.00% | 0.00% | 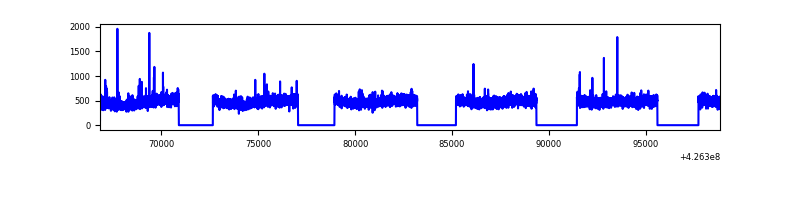 |
| D | 31983 | 22127 | 895 | 895 | 2.80% | 4.04% | 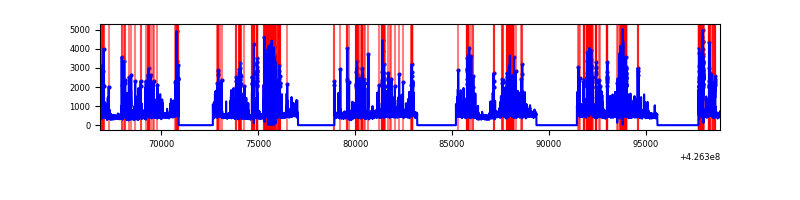 |
Top three noisy pixels from each quadrant. If the there are fewer than three noisy pixels in the level2.evt file, extra rows are filled as -1
| Pixel properties | Quadrant properties | ||||||
|---|---|---|---|---|---|---|---|
| Quadrant | DetID | PixID | Counts | Sigma | Mean | Median | Sigma |
| A | 10 | 83 | 1890925 | 3699.92 | 2526 | 2477 | 510.4 |
| A | 15 | 223 | 1379962 | 2698.82 | 2526 | 2477 | 510.4 |
| A | 12 | 189 | 154340 | 297.54 | 2526 | 2477 | 510.4 |
| B | 5 | 255 | 743459 | 1555.88 | 2499 | 2430 | 476.3 |
| B | 4 | 171 | 623083 | 1303.14 | 2499 | 2430 | 476.3 |
| B | 7 | 202 | 466173 | 973.69 | 2499 | 2430 | 476.3 |
| C | 15 | 214 | 909157 | 1608.32 | 2457 | 2477 | 563.7 |
| C | 9 | 54 | 26982 | 43.47 | 2457 | 2477 | 563.7 |
| C | 8 | 79 | 25551 | 40.93 | 2457 | 2477 | 563.7 |
| D | 13 | 249 | 2083908 | 3590.88 | 2377 | 2311 | 579.7 |
| D | 2 | 249 | 1735663 | 2990.14 | 2377 | 2311 | 579.7 |
| D | 1 | 52 | 1368488 | 2356.74 | 2377 | 2311 | 579.7 |
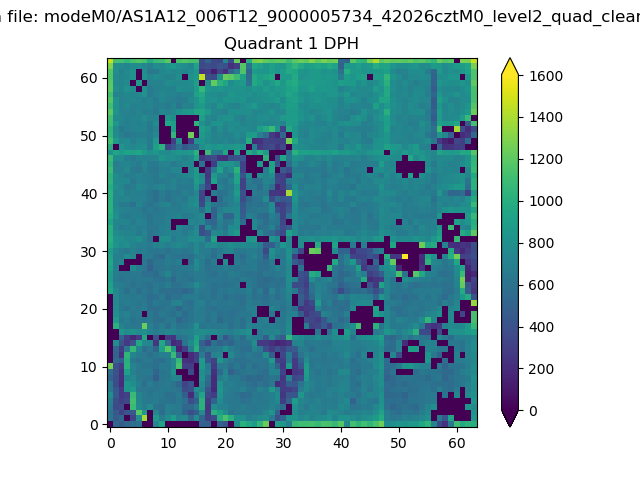
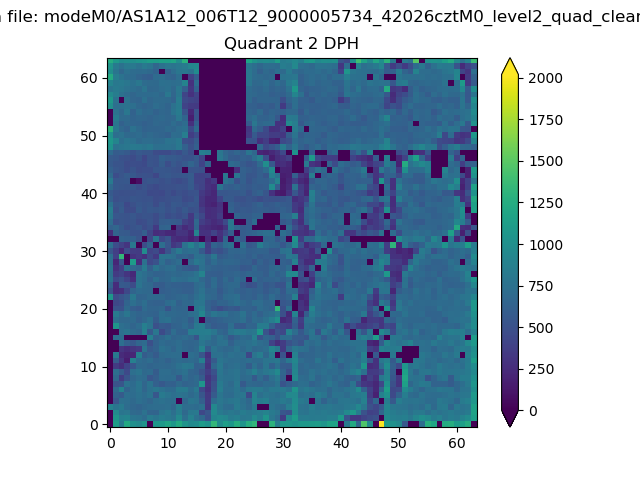
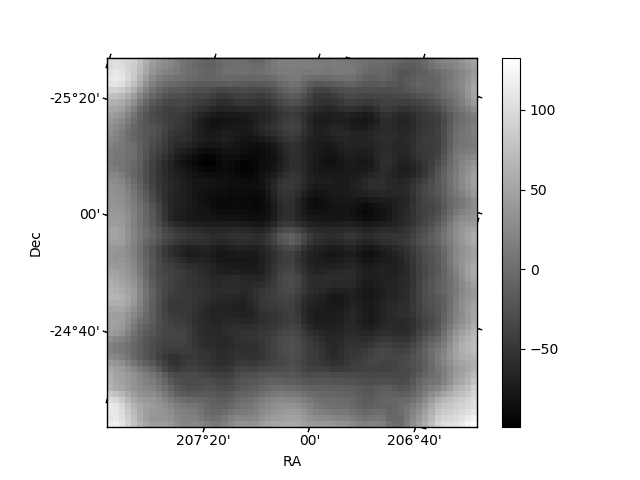
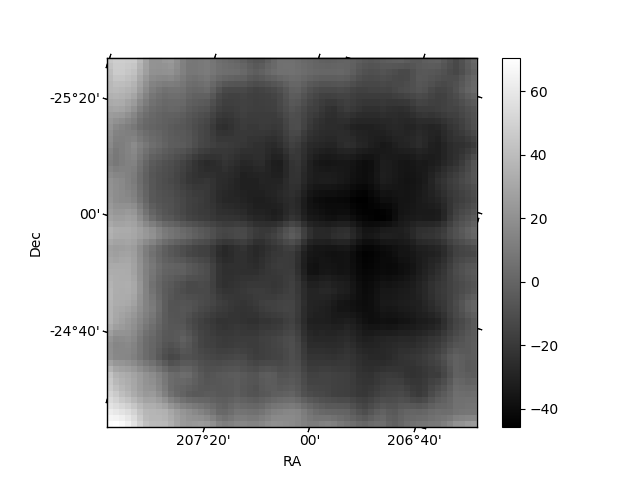
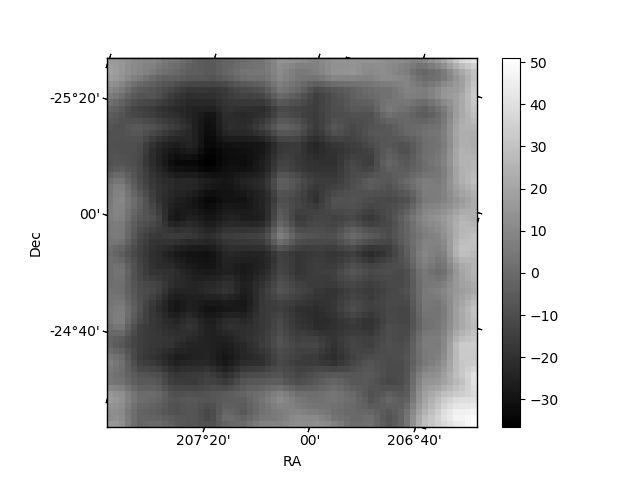
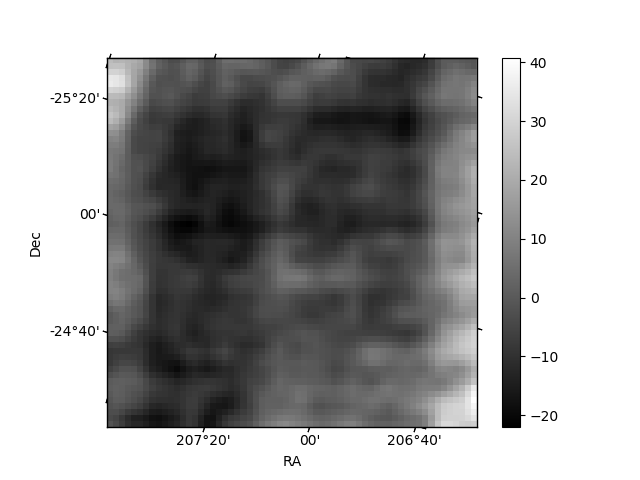
Histogram calculated using DETX and DETY for each event in the final _common_clean file
| Quadrant A |  |
 |
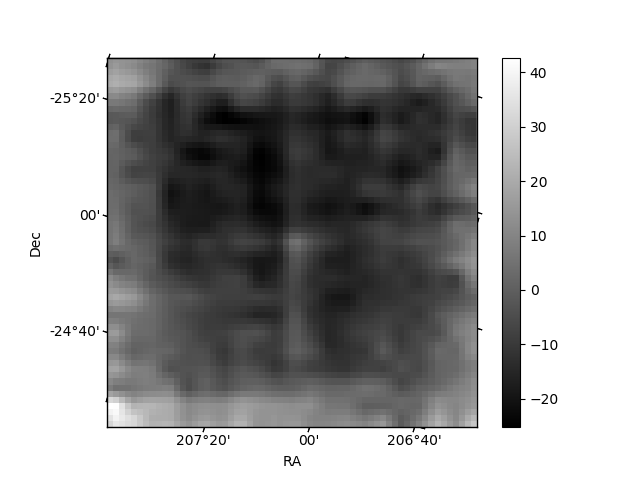
Quadrant B |
|---|---|---|---|
| Quadrant D | 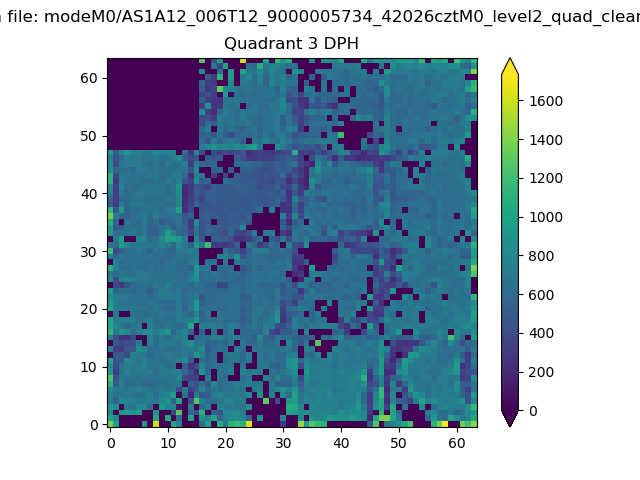 |
 |
Quadrant C |
| Plot type | Count rate plots | Images |
|---|---|---|
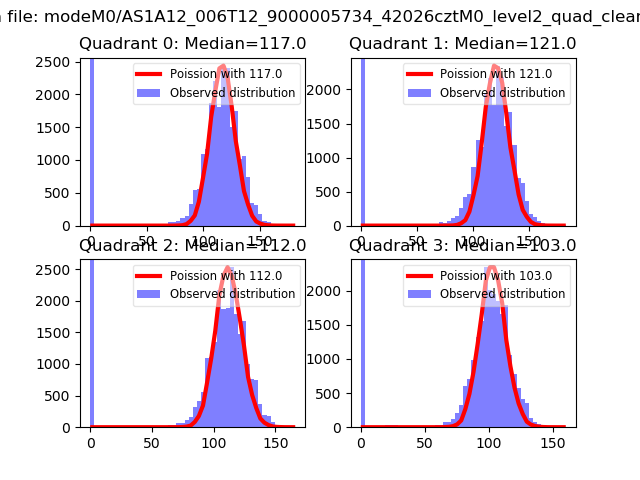
| Comparison with Poisson distribution Blue bars denote a histogram of data divided into 1 sec bins. Red curve is a Poisson curve with rate = median count rate of data. |
 |
 |
| Quadrant-wise count rates Data is divided into 100 sec bins |
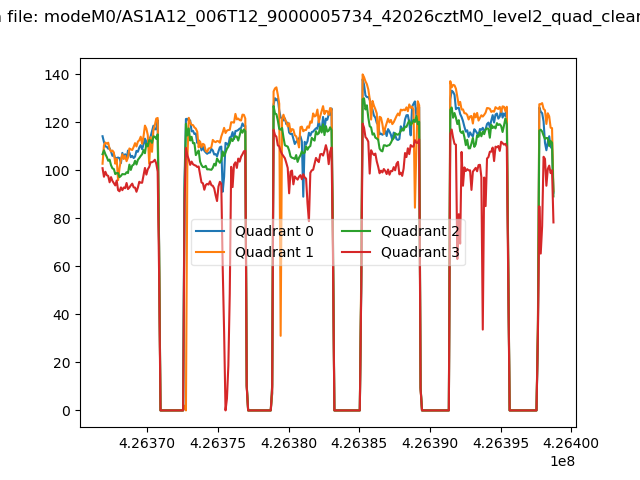 |
|
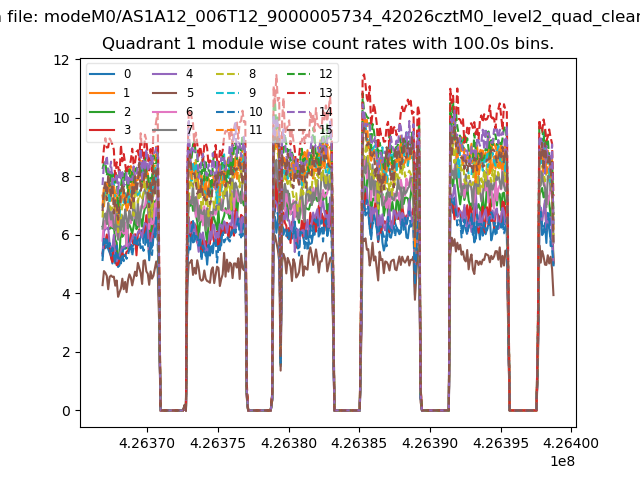
| Module-wise count rates for Quadrant A Data is divided into 100 sec bins |
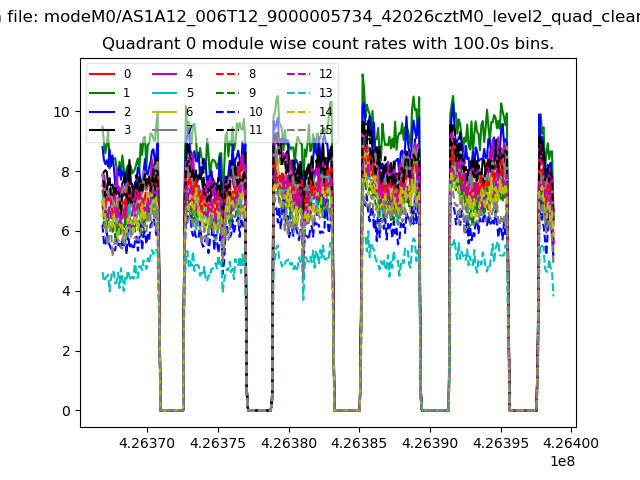 |
 |
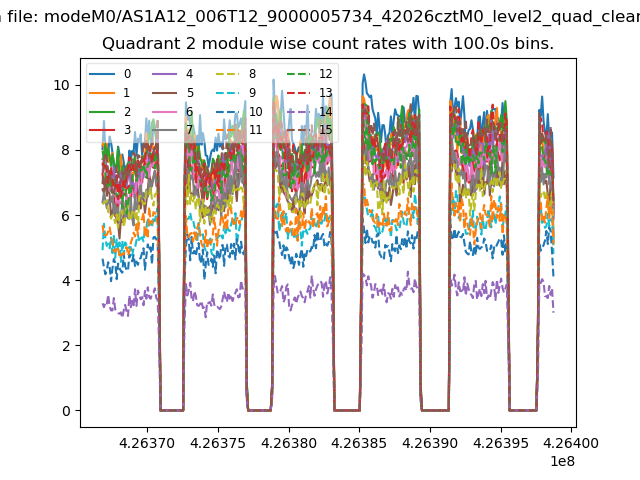
| Module-wise count rates for Quadrant B Data is divided into 100 sec bins |
 |
 |
| Module-wise count rates for Quadrant C Data is divided into 100 sec bins |
 |
 |
| Module-wise count rates for Quadrant D Data is divided into 100 sec bins |
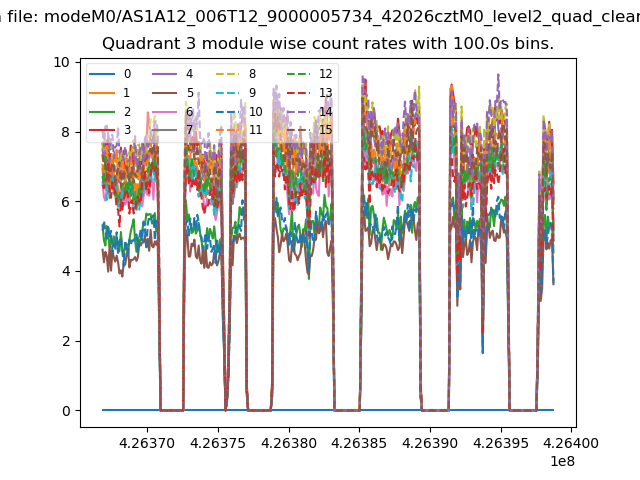 |
 |
| Parameter | Plot |
|---|---|
| CZT HV Monitor | 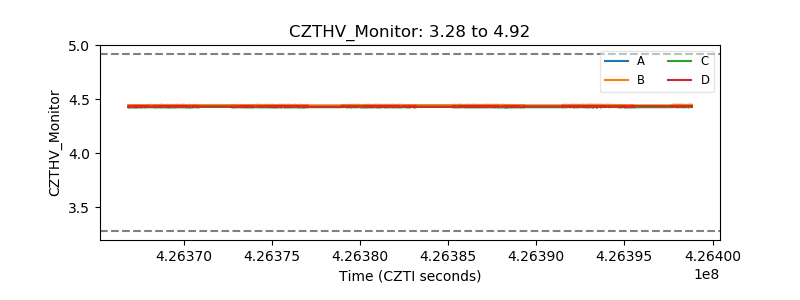 |
| D_VDD | 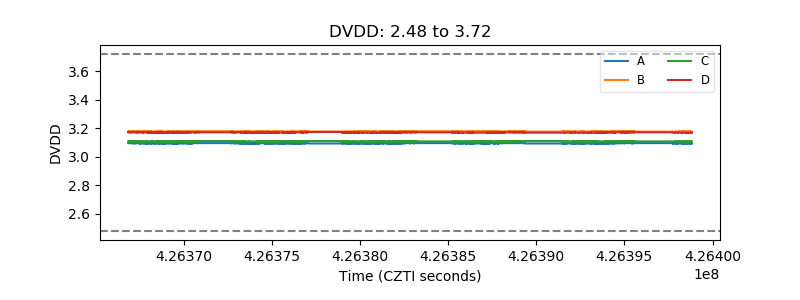 |
| Temperature 1 | 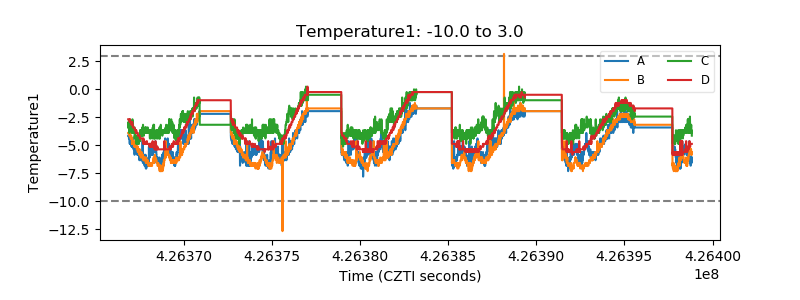 |
| Veto HV Monitor | 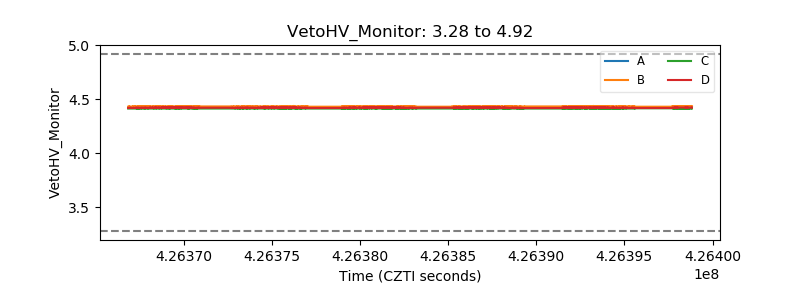 |
| Veto LLD | 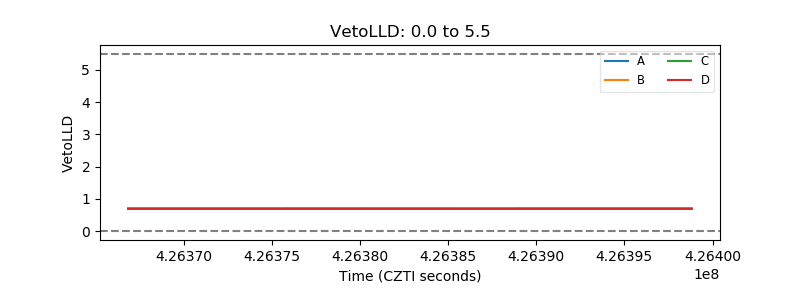 |
| Alpha Counter | 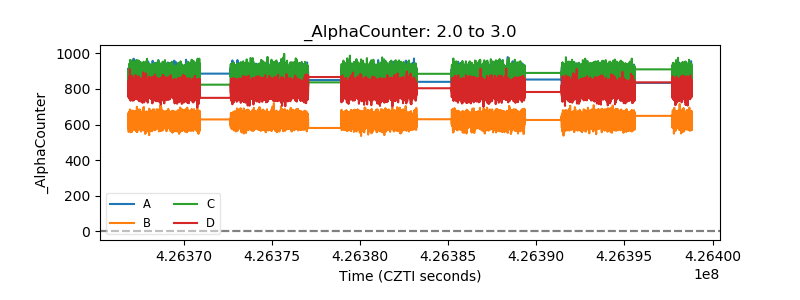 |
| _CPM_Rate | 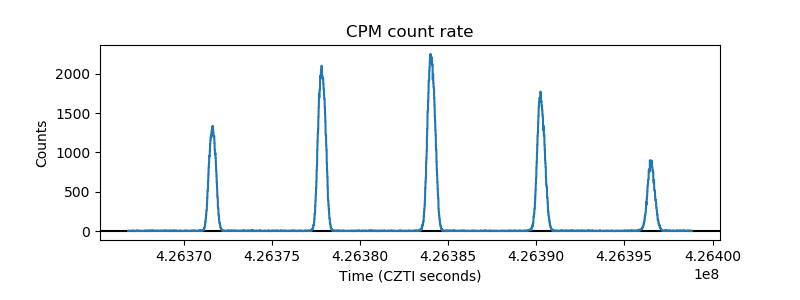 |
| CZT Counter | 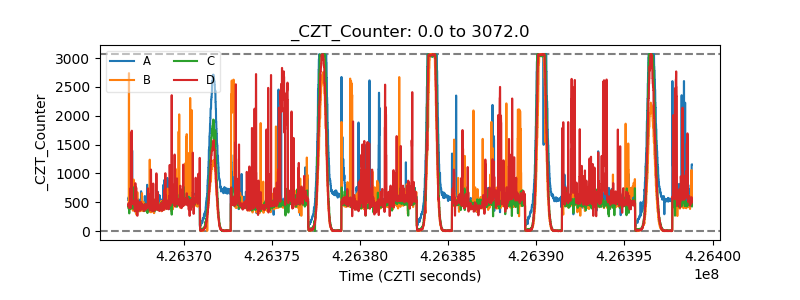 |
| +2.5 Volts monitor | 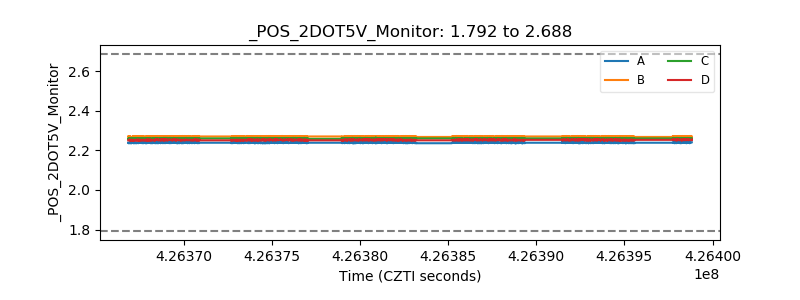 |
| +5 Volts monitor |  |
| _ROLL_ROT | 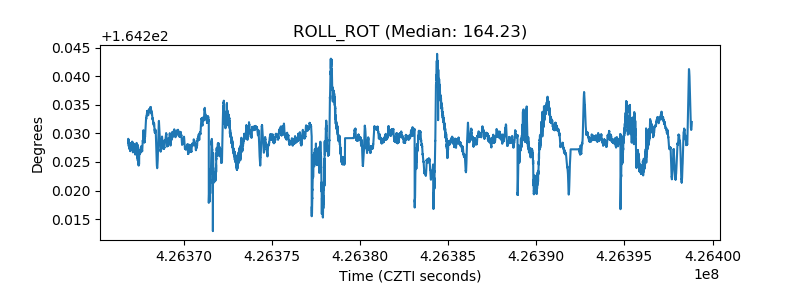 |
| _Roll_DEC | 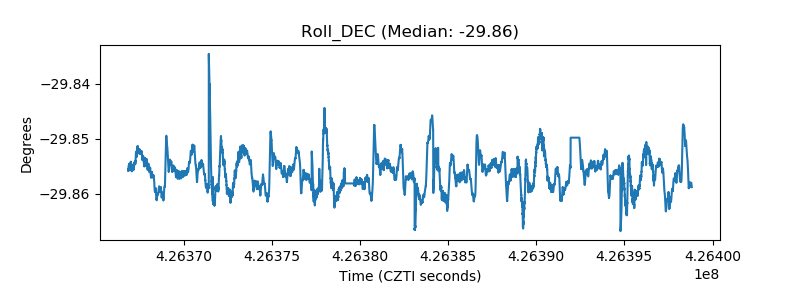 |
| _Roll_RA | 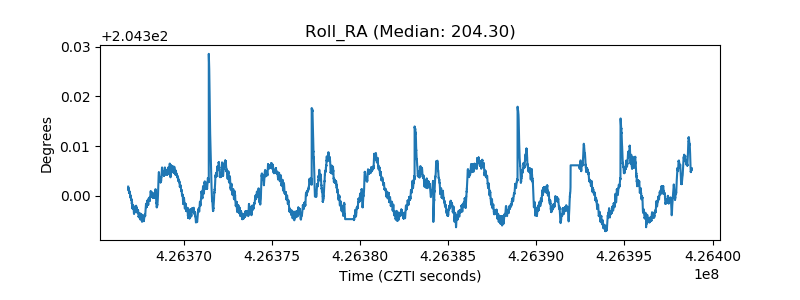 |
| Veto Counter | 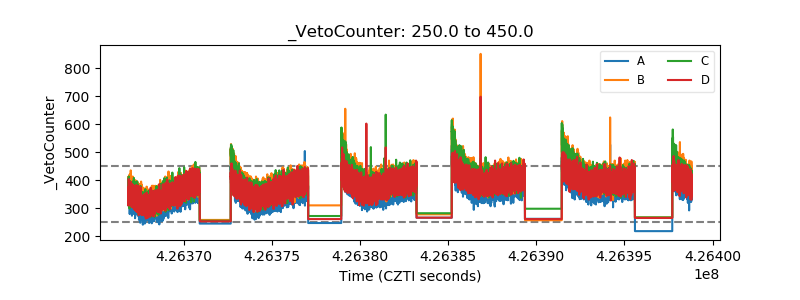 |