| Param | Original file | Final file |
|---|---|---|
| Filename | modeM0/AS1A12_006T12_9000005734_42027cztM0_level2.fits | modeM0/AS1A12_006T12_9000005734_42027cztM0_level2_quad_clean.evt |
| Size (bytes) | 341,864,640 | 87,027,840 |
| Size | 326.0 MB | 83.0 MB |
| Events in quadrant A | 3,858,611 | 580,165 |
| Events in quadrant B | 2,564,922 | 613,384 |
| Events in quadrant C | 2,475,439 | 572,772 |
| Events in quadrant D | 3,357,585 | 510,889 |
| Mode M0 | |||
|---|---|---|---|
| Quadrant | BADHDUFLAG | Total packets | Discarded packets |
| A | 0 | 14765 | 2 |
| B | 0 | 10793 | 3 |
| C | 0 | 10351 | 2 |
| D | 0 | 13085 | 2 |
| Mode M9 | |||
|---|---|---|---|
| Quadrant | BADHDUFLAG | Total packets | Discarded packets |
| A | 0 | 34 | 0 |
| B | 0 | 34 | 0 |
| C | 0 | 35 | 0 |
| D | 0 | 35 | 0 |
| Mode SS | |||
|---|---|---|---|
| Quadrant | BADHDUFLAG | Total packets | Discarded packets |
| A | 0 | 104 | 0 |
| B | 0 | 104 | 0 |
| C | 0 | 104 | 0 |
| D | 0 | 104 | 0 |
| Quadrant | Total seconds | Saturated seconds | Saturation percentage |
|---|---|---|---|
| A | 5112 | 217 | 4.244914% |
| B | 5111 | 30 | 0.586969% |
| C | 5111 | 5 | 0.097828% |
| D | 5111 | 181 | 3.541381% |
Noise dominated data is calculated using 1-second bins in cleaned event files. If a bin has >2000 counts, and if more than 50% of those come from <1% of pixels, then it is considered to be noise-dominated and hence unusable.
| Quadrant | # 1 sec bins | Bins with >0 counts | Bins with >2000 counts | High rate bins dominated by noise | Noise dominated (total time) | Noise dominated (detector-on time) | Marked lightcurve |
|---|---|---|---|---|---|---|---|
| A | 7205 | 5113 | 166 | 166 | 2.30% | 3.25% | 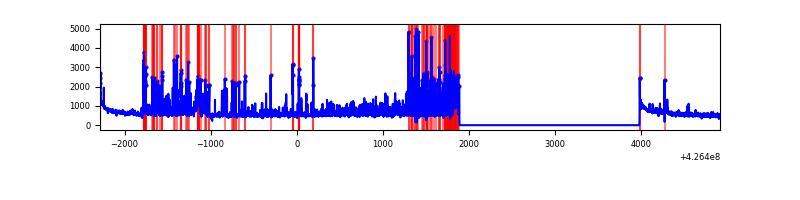 |
| B | 7204 | 5112 | 10 | 10 | 0.14% | 0.20% | 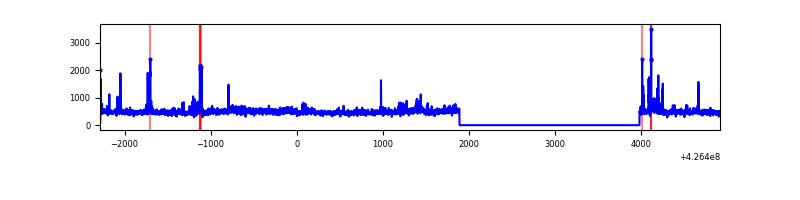 |
| C | 7204 | 5112 | 2 | 2 | 0.03% | 0.04% | 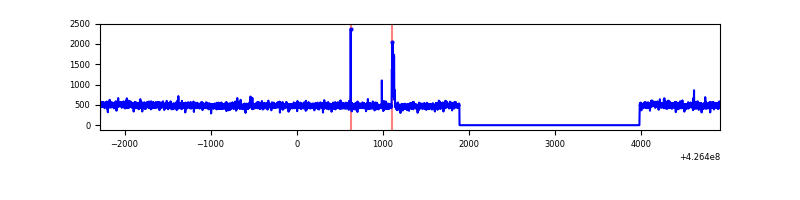 |
| D | 7204 | 5112 | 139 | 139 | 1.93% | 2.72% | 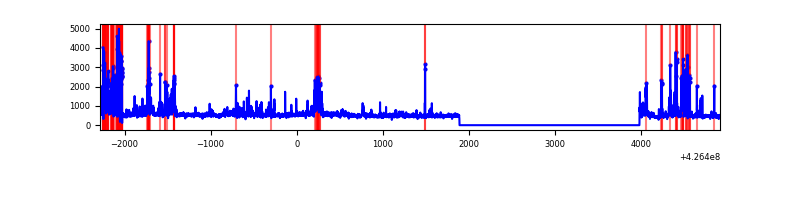 |
Top three noisy pixels from each quadrant. If the there are fewer than three noisy pixels in the level2.evt file, extra rows are filled as -1
| Pixel properties | Quadrant properties | ||||||
|---|---|---|---|---|---|---|---|
| Quadrant | DetID | PixID | Counts | Sigma | Mean | Median | Sigma |
| A | 15 | 223 | 1057418 | 8922.38 | 577 | 566 | 118.4 |
| A | 10 | 83 | 518577 | 4373.26 | 577 | 566 | 118.4 |
| A | 2 | 79 | 32507 | 269.66 | 577 | 566 | 118.4 |
| B | 7 | 202 | 85592 | 764.01 | 581 | 568 | 111.3 |
| B | 5 | 255 | 82319 | 734.6 | 581 | 568 | 111.3 |
| B | 0 | 186 | 36357 | 321.59 | 581 | 568 | 111.3 |
| C | 15 | 214 | 217686 | 1628.51 | 570 | 574 | 133.3 |
| C | 15 | 111 | 31856 | 234.64 | 570 | 574 | 133.3 |
| C | 13 | 61 | 3825 | 24.39 | 570 | 574 | 133.3 |
| D | 2 | 249 | 404107 | 2939.84 | 560 | 543 | 137.3 |
| D | 1 | 52 | 361501 | 2629.47 | 560 | 543 | 137.3 |
| D | 13 | 249 | 227382 | 1652.45 | 560 | 543 | 137.3 |
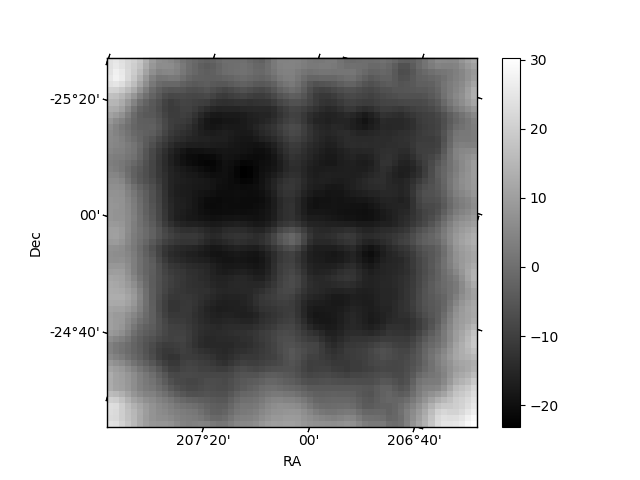
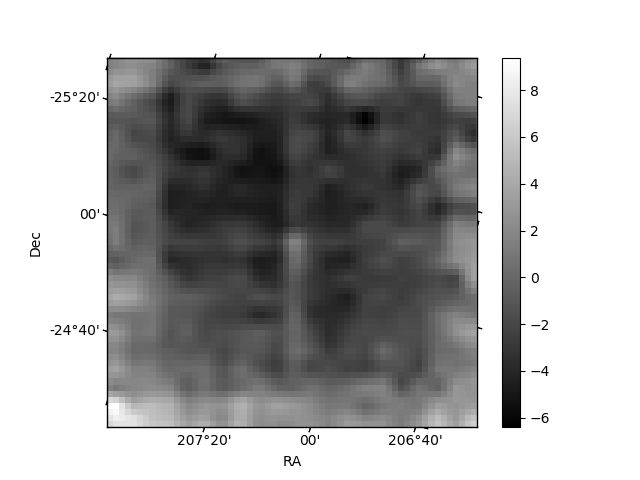
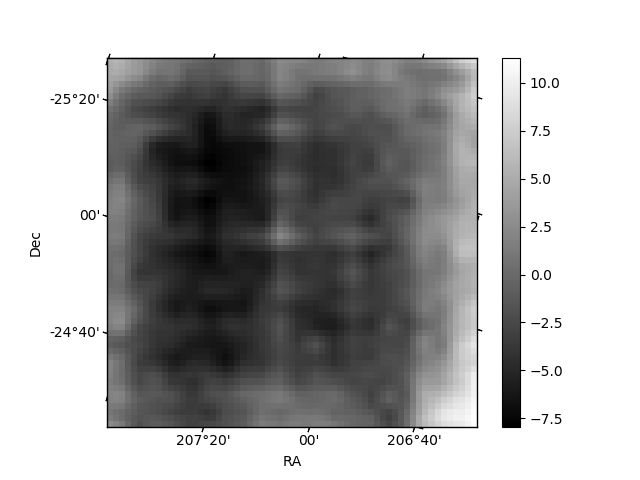
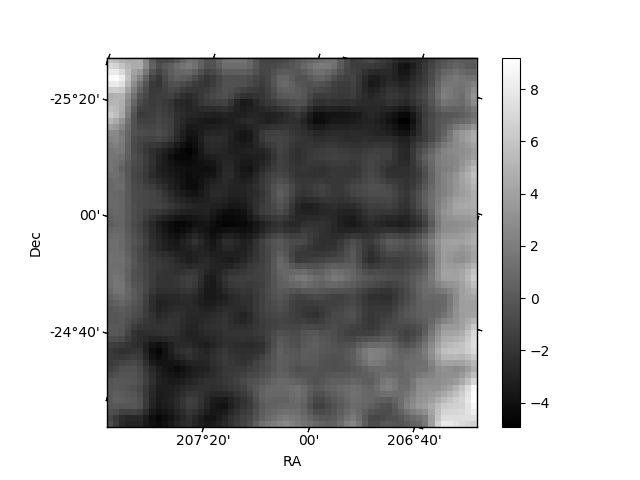
Histogram calculated using DETX and DETY for each event in the final _common_clean file
| Quadrant A | 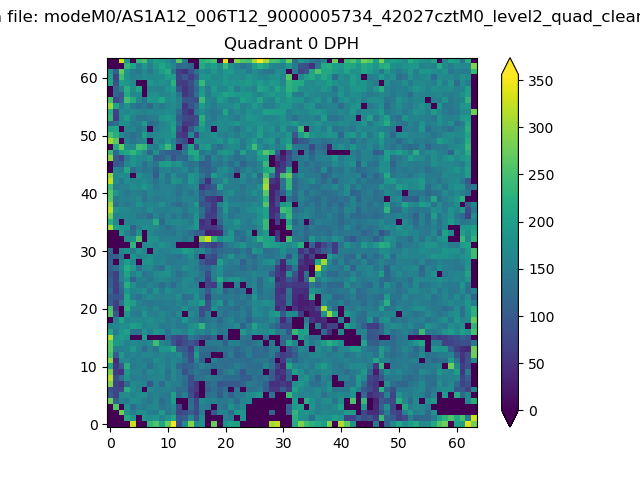 |
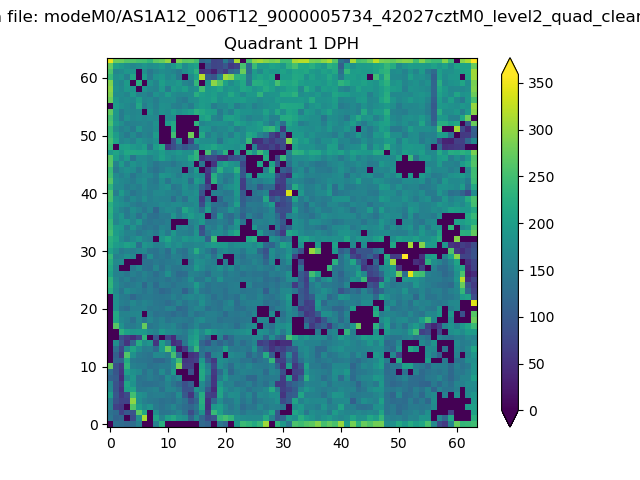 |
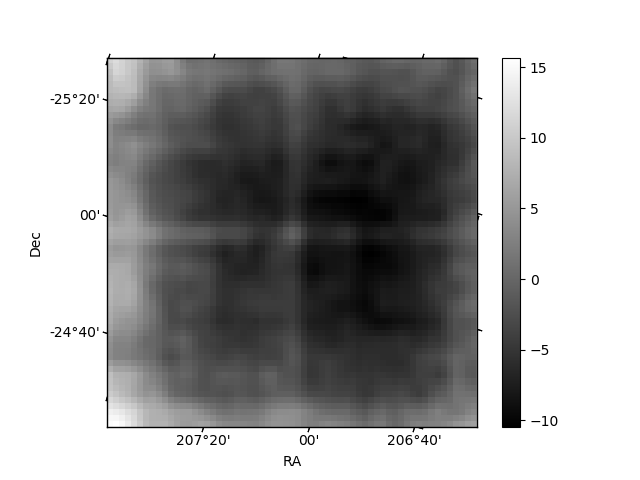
Quadrant B |
|---|---|---|---|
| Quadrant D | 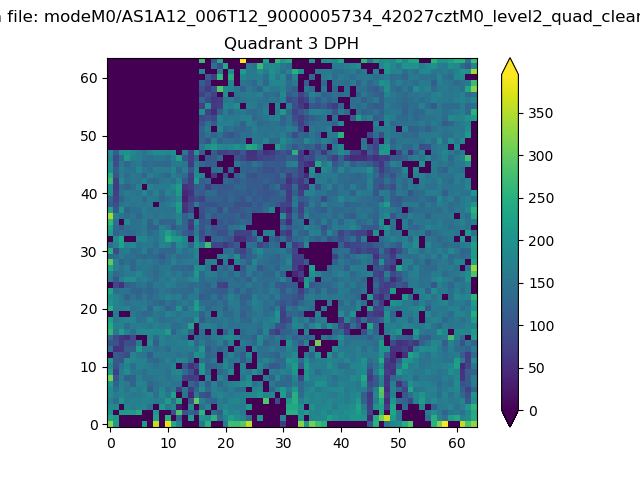 |
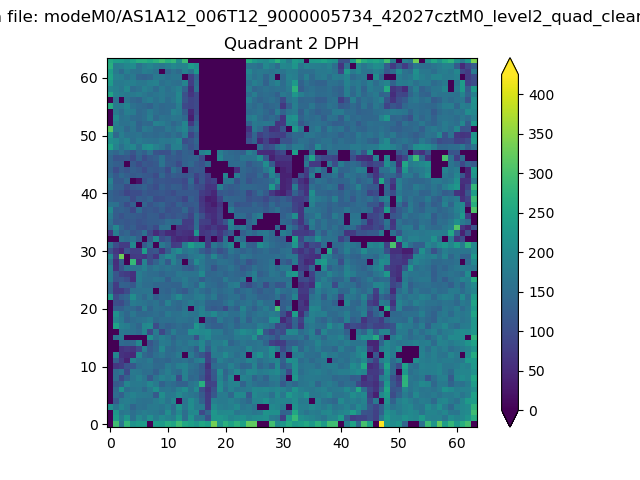 |
Quadrant C |
| Plot type | Count rate plots | Images |
|---|---|---|
| Comparison with Poisson distribution Blue bars denote a histogram of data divided into 1 sec bins. Red curve is a Poisson curve with rate = median count rate of data. |
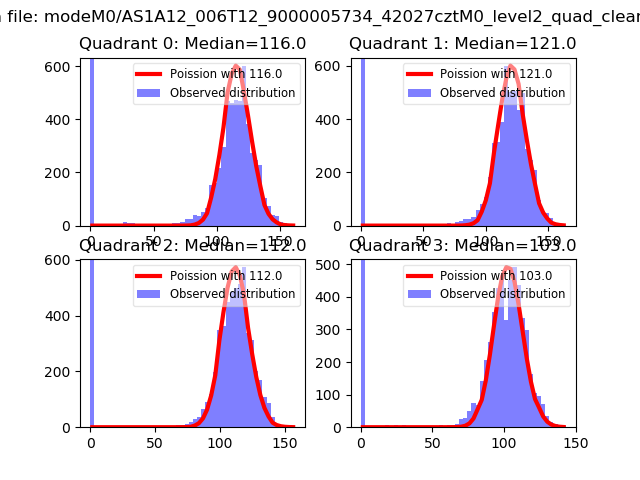 |
 |
| Quadrant-wise count rates Data is divided into 100 sec bins |
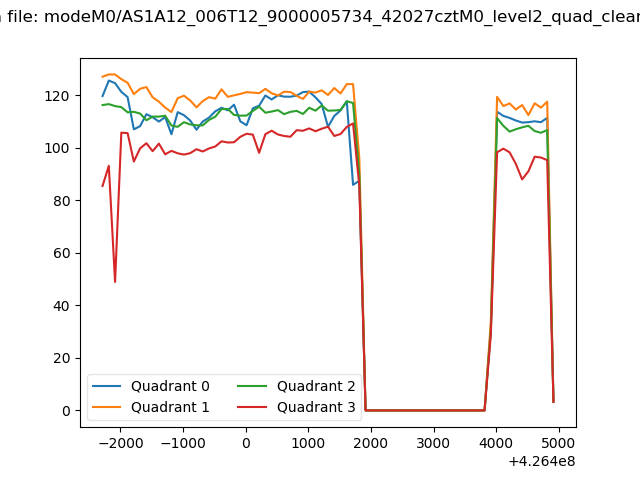 |
|
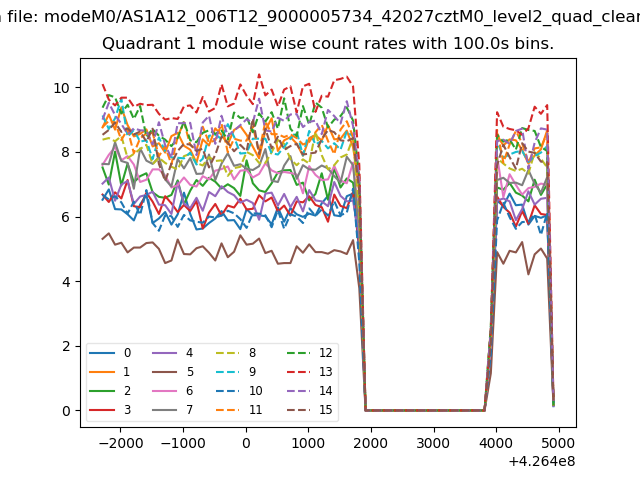
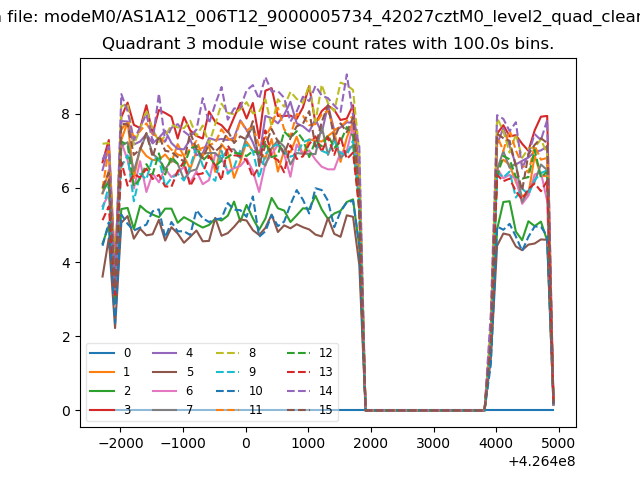
| Module-wise count rates for Quadrant A Data is divided into 100 sec bins |
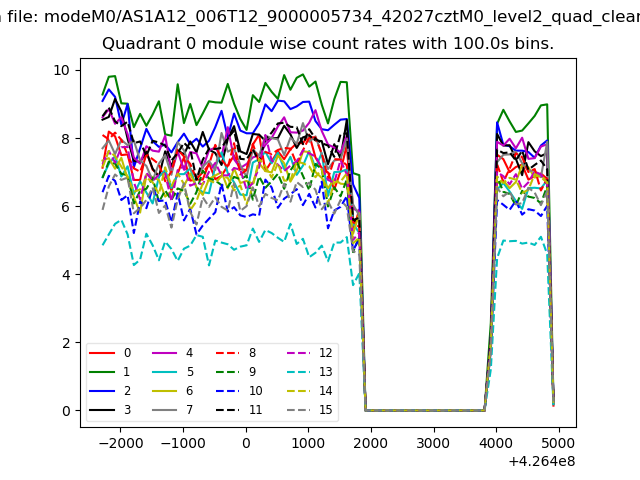 |
 |
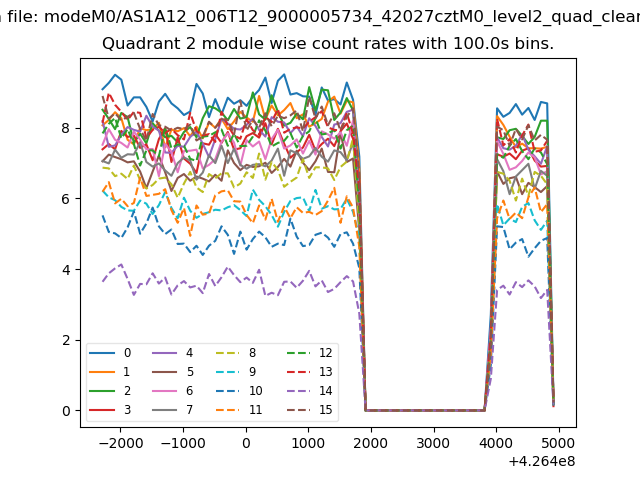
| Module-wise count rates for Quadrant B Data is divided into 100 sec bins |
 |
 |
| Module-wise count rates for Quadrant C Data is divided into 100 sec bins |
 |
 |
| Module-wise count rates for Quadrant D Data is divided into 100 sec bins |
 |
 |
| Parameter | Plot |
|---|---|
| CZT HV Monitor | 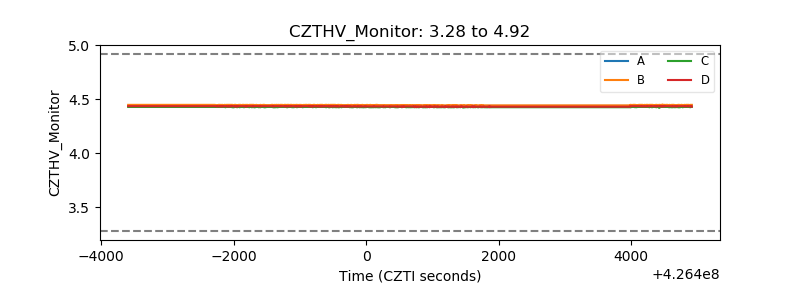 |
| D_VDD | 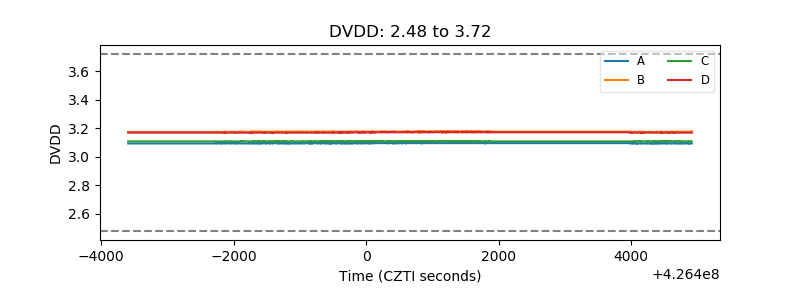 |
| Temperature 1 | 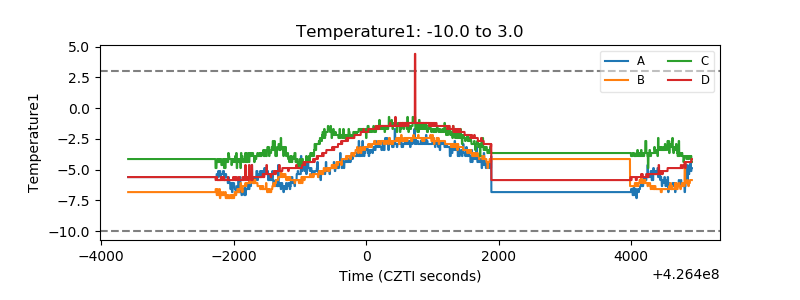 |
| Veto HV Monitor | 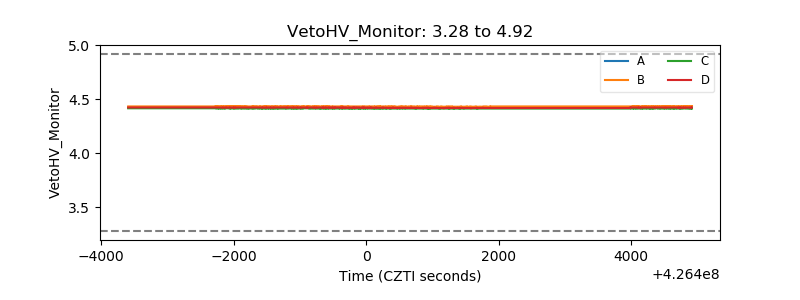 |
| Veto LLD | 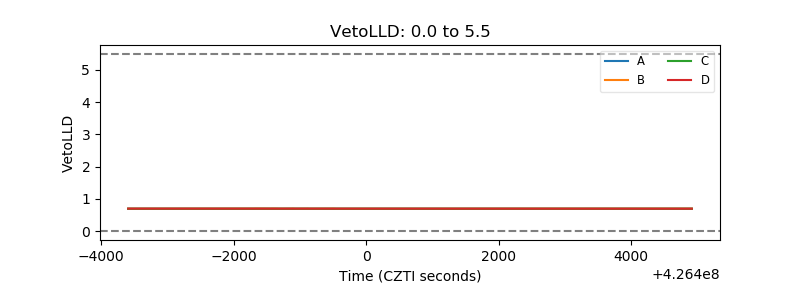 |
| Alpha Counter | 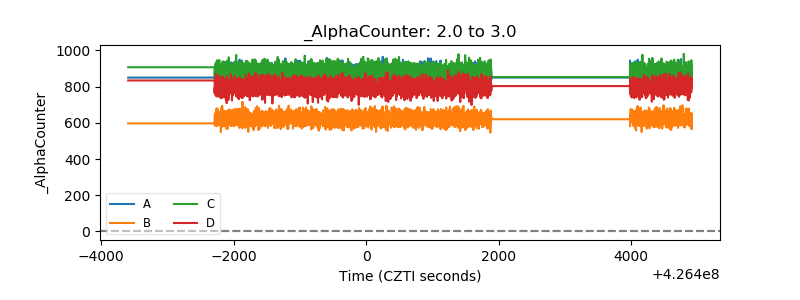 |
| _CPM_Rate | 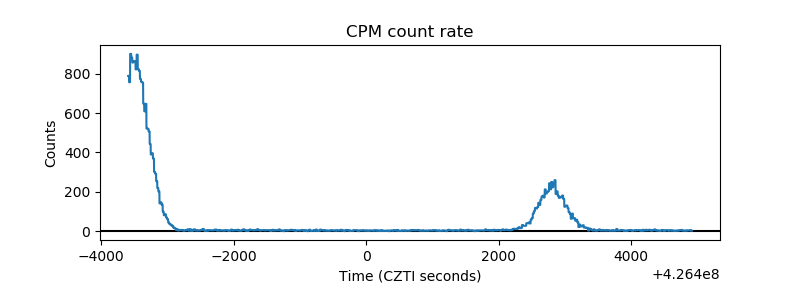 |
| CZT Counter | 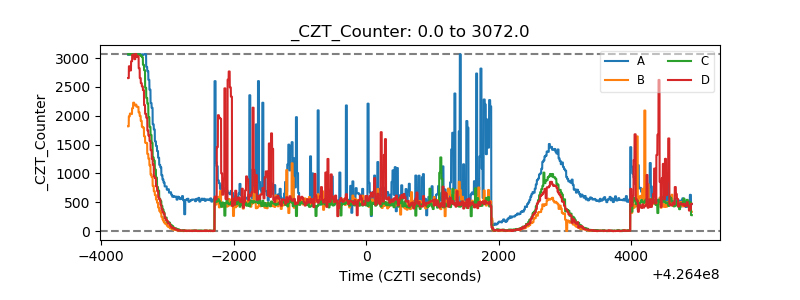 |
| +2.5 Volts monitor | 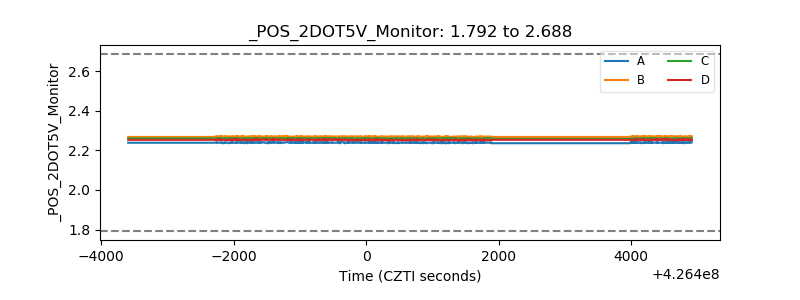 |
| +5 Volts monitor | 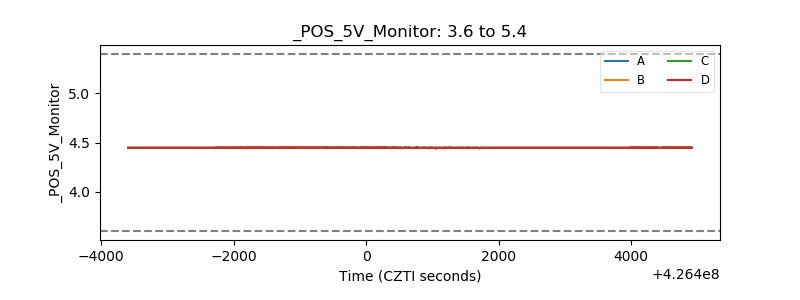 |
| _ROLL_ROT | 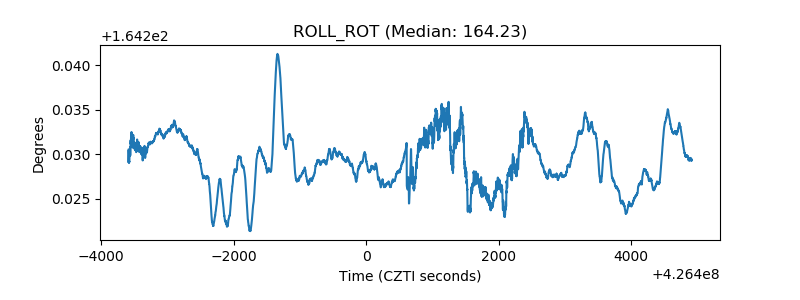 |
| _Roll_DEC | 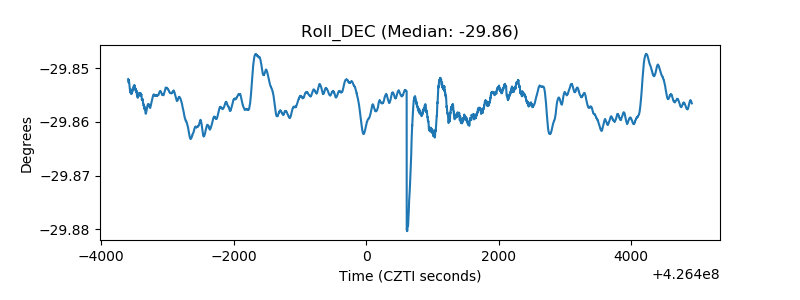 |
| _Roll_RA | 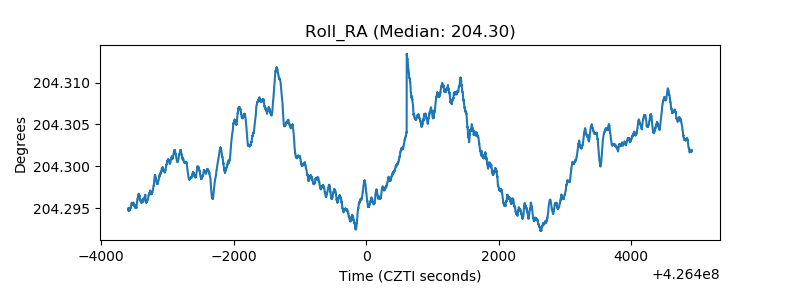 |
| Veto Counter | 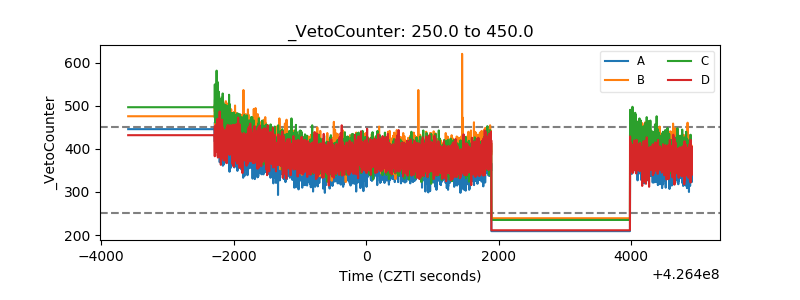 |