| Param | Original file | Final file |
|---|---|---|
| Filename | modeM0/AS1A12_006T12_9000005734_42028cztM0_level2.fits | modeM0/AS1A12_006T12_9000005734_42028cztM0_level2_quad_clean.evt |
| Size (bytes) | 229,985,280 | 66,312,000 |
| Size | 219.3 MB | 63.2 MB |
| Events in quadrant A | 2,208,403 | 445,712 |
| Events in quadrant B | 2,006,995 | 456,872 |
| Events in quadrant C | 1,834,417 | 431,586 |
| Events in quadrant D | 2,153,478 | 393,921 |
| Mode M0 | |||
|---|---|---|---|
| Quadrant | BADHDUFLAG | Total packets | Discarded packets |
| A | 0 | 8829 | 1 |
| B | 0 | 8620 | 1 |
| C | 0 | 7956 | 1 |
| D | 0 | 9204 | 1 |
| Mode M9 | |||
|---|---|---|---|
| Quadrant | BADHDUFLAG | Total packets | Discarded packets |
| A | 0 | 11 | 0 |
| B | 0 | 11 | 0 |
| C | 0 | 12 | 0 |
| D | 0 | 12 | 0 |
| Mode SS | |||
|---|---|---|---|
| Quadrant | BADHDUFLAG | Total packets | Discarded packets |
| A | 0 | 80 | 0 |
| B | 0 | 80 | 0 |
| C | 0 | 80 | 0 |
| D | 0 | 80 | 0 |
| Quadrant | Total seconds | Saturated seconds | Saturation percentage |
|---|---|---|---|
| A | 3965 | 5 | 0.126103% |
| B | 3965 | 34 | 0.857503% |
| C | 3965 | 2 | 0.050441% |
| D | 3965 | 68 | 1.715006% |
Noise dominated data is calculated using 1-second bins in cleaned event files. If a bin has >2000 counts, and if more than 50% of those come from <1% of pixels, then it is considered to be noise-dominated and hence unusable.
| Quadrant | # 1 sec bins | Bins with >0 counts | Bins with >2000 counts | High rate bins dominated by noise | Noise dominated (total time) | Noise dominated (detector-on time) | Marked lightcurve |
|---|---|---|---|---|---|---|---|
| A | 3965 | 3965 | 3 | 3 | 0.08% | 0.08% | 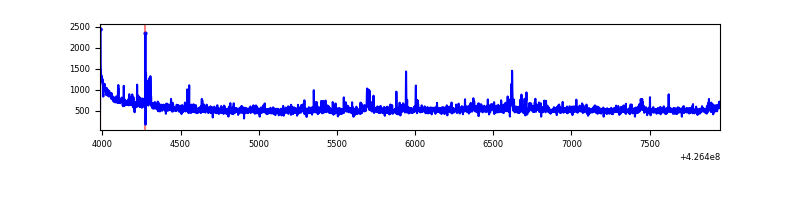 |
| B | 3965 | 3965 | 23 | 23 | 0.58% | 0.58% | 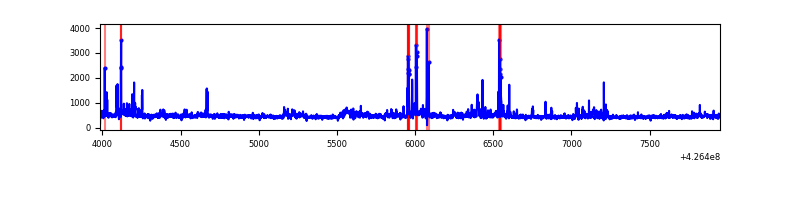 |
| C | 3965 | 3965 | 0 | 0 | 0.00% | 0.00% | 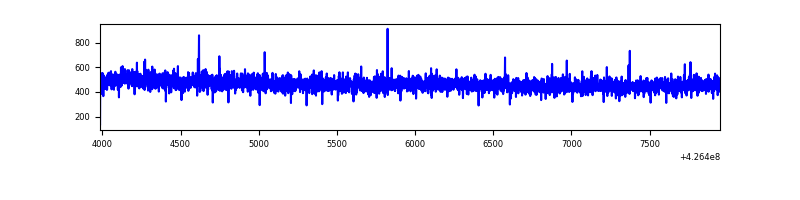 |
| D | 3965 | 3965 | 47 | 47 | 1.19% | 1.19% | 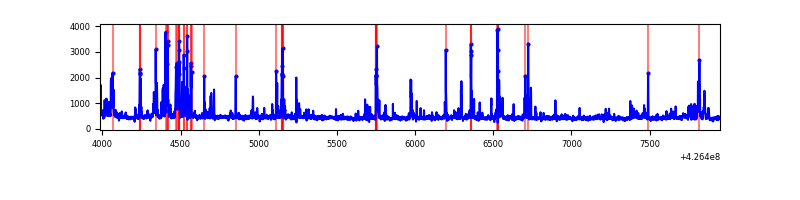 |
Top three noisy pixels from each quadrant. If the there are fewer than three noisy pixels in the level2.evt file, extra rows are filled as -1
| Pixel properties | Quadrant properties | ||||||
|---|---|---|---|---|---|---|---|
| Quadrant | DetID | PixID | Counts | Sigma | Mean | Median | Sigma |
| A | 10 | 83 | 366128 | 3990.88 | 442 | 433 | 91.6 |
| A | 12 | 189 | 96073 | 1043.73 | 442 | 433 | 91.6 |
| A | 15 | 223 | 24472 | 262.34 | 442 | 433 | 91.6 |
| B | 5 | 255 | 111442 | 1284.53 | 436 | 423 | 86.4 |
| B | 3 | 112 | 73730 | 848.19 | 436 | 423 | 86.4 |
| B | 7 | 202 | 51602 | 592.16 | 436 | 423 | 86.4 |
| C | 15 | 214 | 165040 | 1645.87 | 427 | 430 | 100.0 |
| C | 13 | 61 | 2823 | 23.93 | 427 | 430 | 100.0 |
| C | 12 | 249 | 2471 | 20.41 | 427 | 430 | 100.0 |
| D | 2 | 249 | 161895 | 1535.9 | 426 | 414 | 105.1 |
| D | 12 | 6 | 146854 | 1392.84 | 426 | 414 | 105.1 |
| D | 13 | 249 | 109233 | 1035.02 | 426 | 414 | 105.1 |
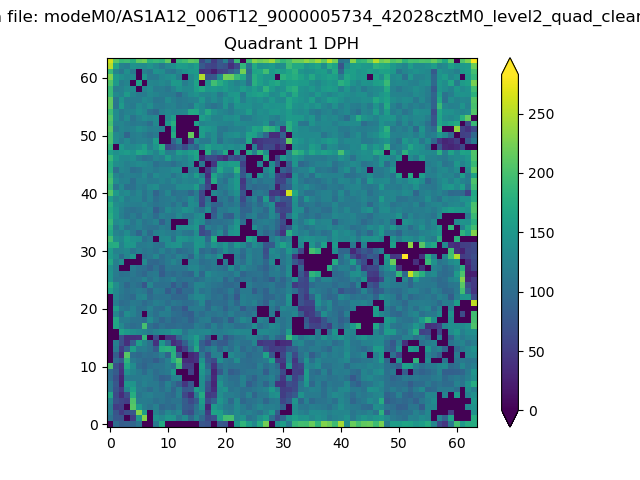
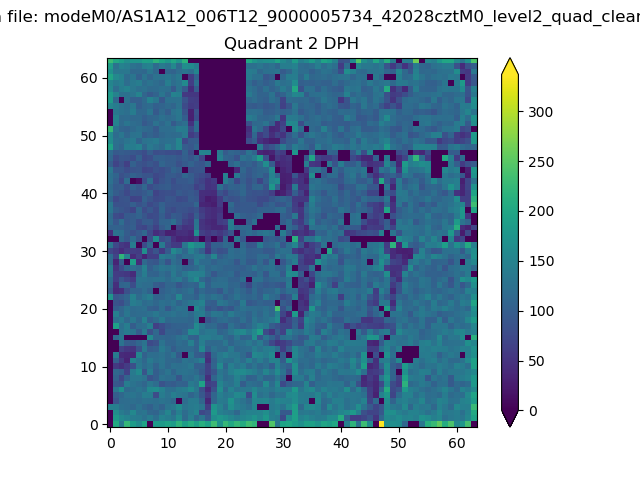
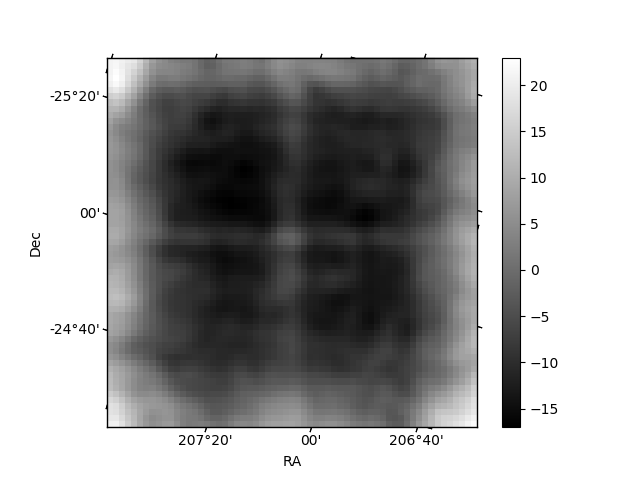
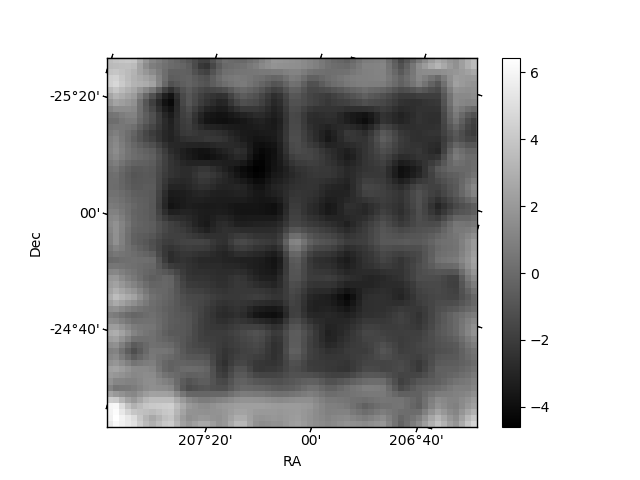
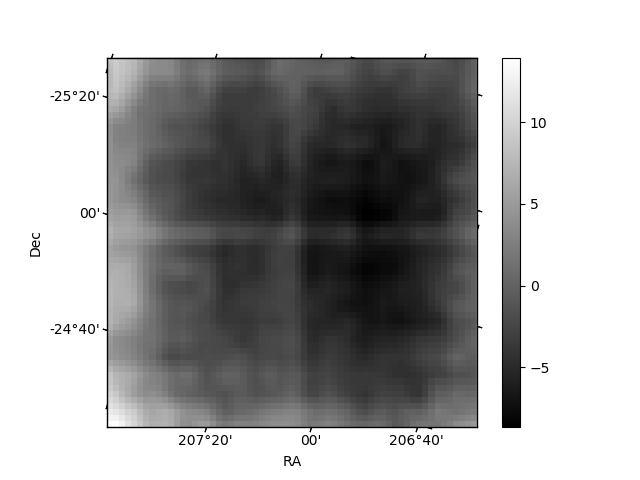
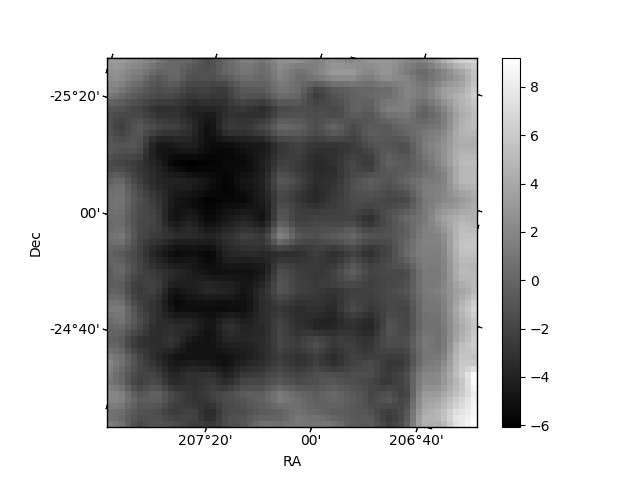
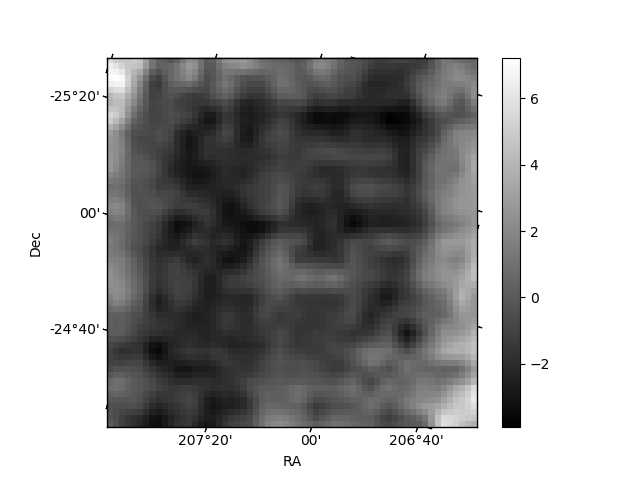
Histogram calculated using DETX and DETY for each event in the final _common_clean file
| Quadrant A |  |
 |
Quadrant B |
|---|---|---|---|
| Quadrant D | 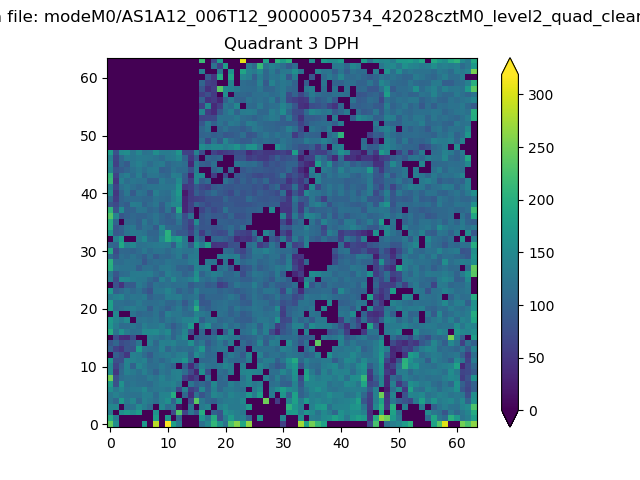 |
 |
Quadrant C |
| Plot type | Count rate plots | Images |
|---|---|---|
| Comparison with Poisson distribution Blue bars denote a histogram of data divided into 1 sec bins. Red curve is a Poisson curve with rate = median count rate of data. |
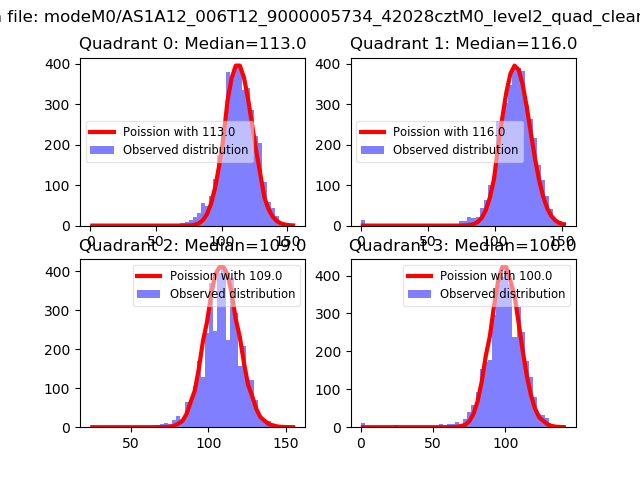 |
 |
| Quadrant-wise count rates Data is divided into 100 sec bins |
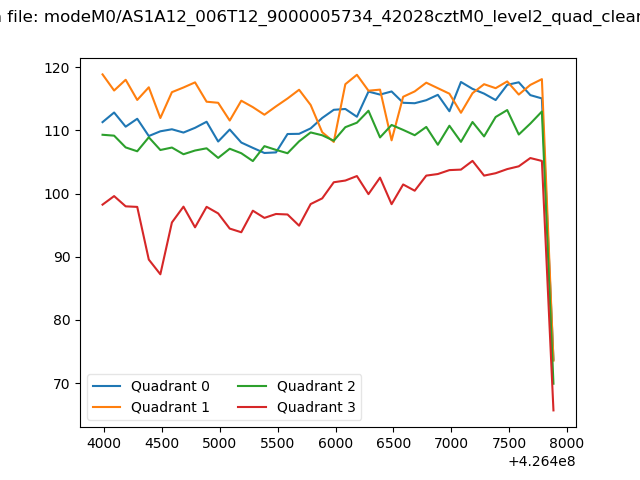 |
|
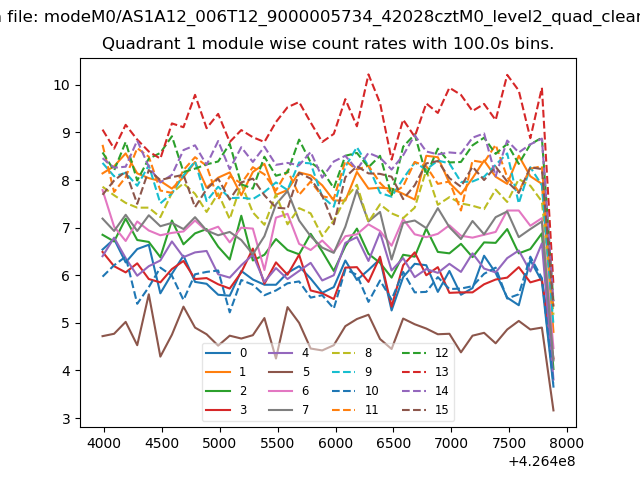
| Module-wise count rates for Quadrant A Data is divided into 100 sec bins |
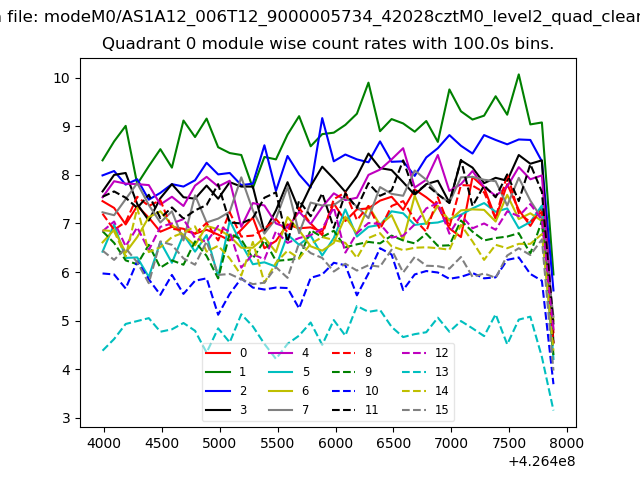 |
 |
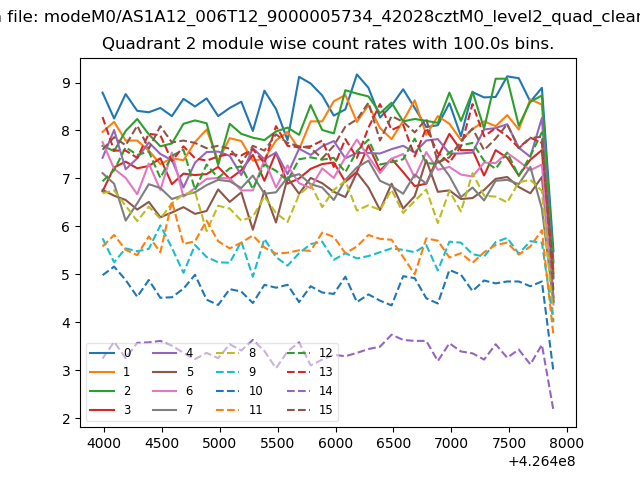
| Module-wise count rates for Quadrant B Data is divided into 100 sec bins |
 |
 |
| Module-wise count rates for Quadrant C Data is divided into 100 sec bins |
 |
 |
| Module-wise count rates for Quadrant D Data is divided into 100 sec bins |
 |
 |
| Parameter | Plot |
|---|---|
| CZT HV Monitor | 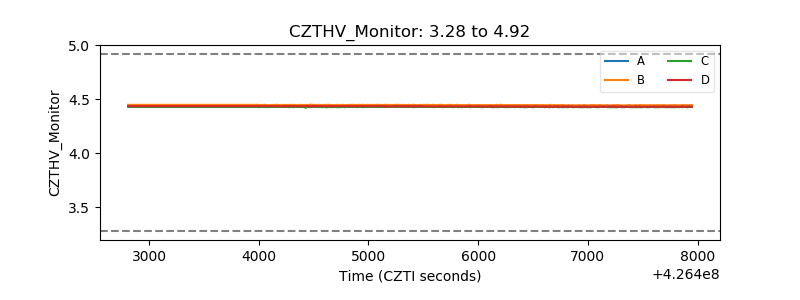 |
| D_VDD | 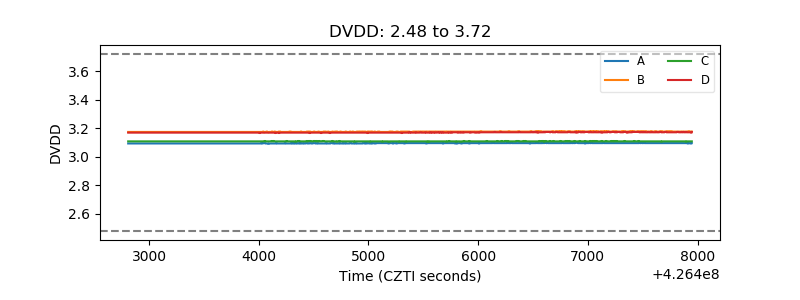 |
| Temperature 1 | 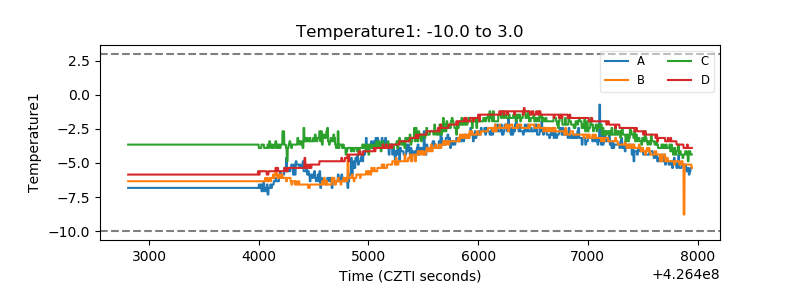 |
| Veto HV Monitor | 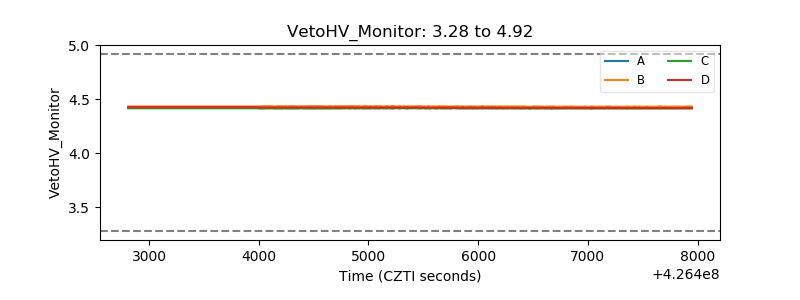 |
| Veto LLD | 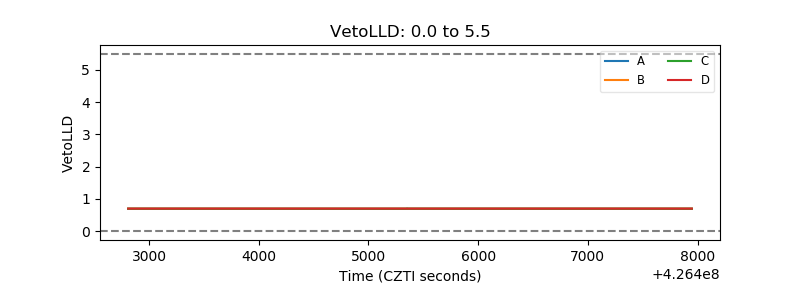 |
| Alpha Counter | 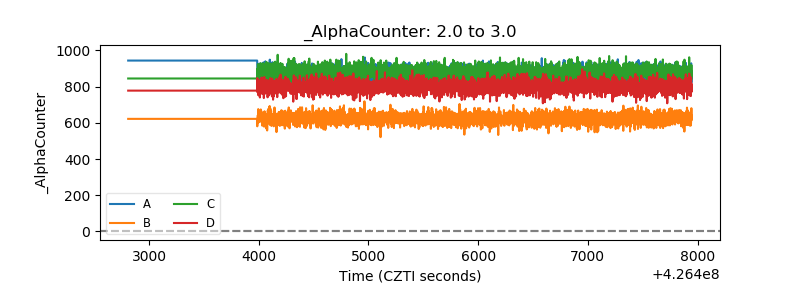 |
| _CPM_Rate | 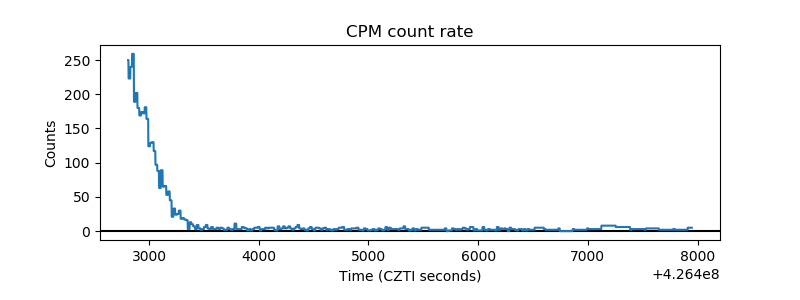 |
| CZT Counter | 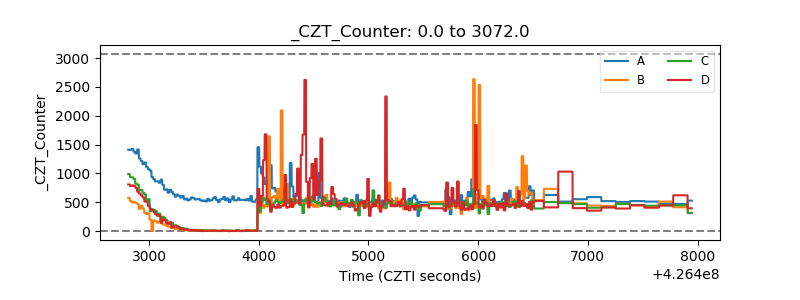 |
| +2.5 Volts monitor | 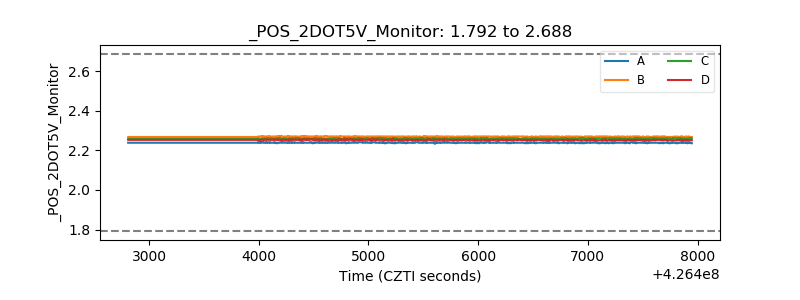 |
| +5 Volts monitor | 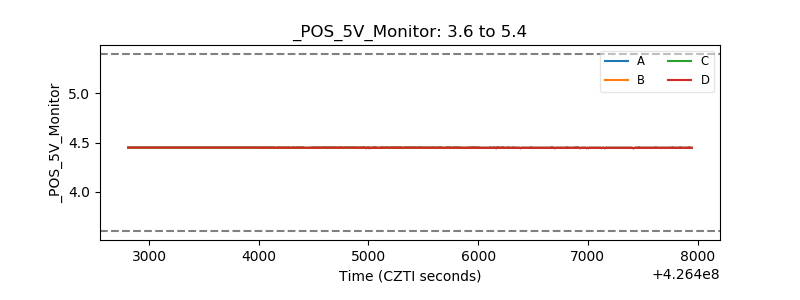 |
| _ROLL_ROT | 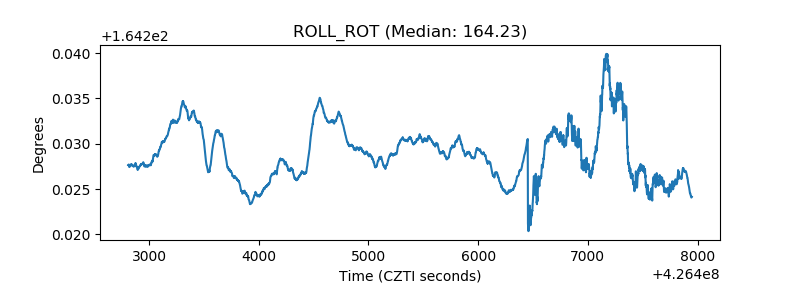 |
| _Roll_DEC | 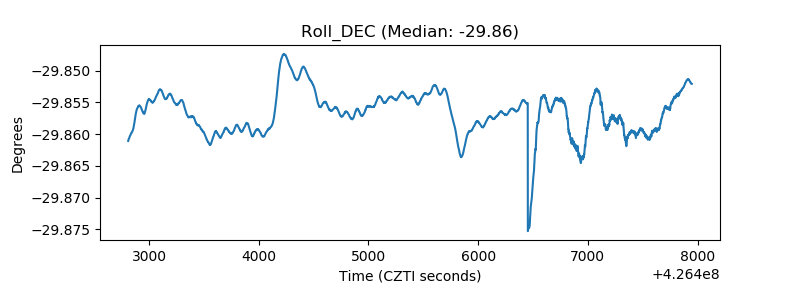 |
| _Roll_RA | 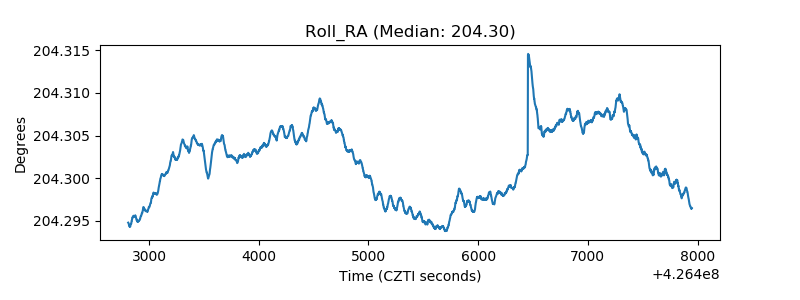 |
| Veto Counter | 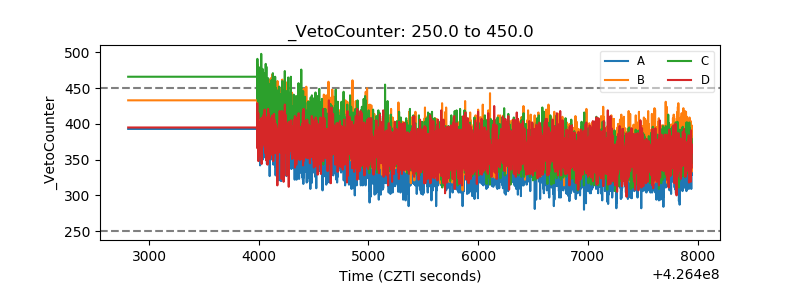 |