| Param | Original file | Final file |
|---|---|---|
| Filename | modeM0/AS1A12_037T01_9000005736_42030cztM0_level2.fits | modeM0/AS1A12_037T01_9000005736_42030cztM0_level2_quad_clean.evt |
| Size (bytes) | 630,325,440 | 168,540,480 |
| Size | 601.1 MB | 160.7 MB |
| Events in quadrant A | 7,476,231 | 1,083,848 |
| Events in quadrant B | 5,099,861 | 1,164,292 |
| Events in quadrant C | 4,787,082 | 1,110,393 |
| Events in quadrant D | 5,160,060 | 1,022,499 |
| Mode SS | |||
|---|---|---|---|
| Quadrant | BADHDUFLAG | Total packets | Discarded packets |
| A | 0 | 210 | 0 |
| B | 0 | 210 | 0 |
| C | 0 | 210 | 0 |
| D | 0 | 210 | 0 |
| Mode M0 | |||
|---|---|---|---|
| Quadrant | BADHDUFLAG | Total packets | Discarded packets |
| A | 0 | 28722 | 3 |
| B | 0 | 22146 | 2 |
| C | 0 | 20958 | 2 |
| D | 0 | 22780 | 2 |
| Mode M9 | |||
|---|---|---|---|
| Quadrant | BADHDUFLAG | Total packets | Discarded packets |
| A | 0 | 29 | 0 |
| B | 0 | 29 | 0 |
| C | 0 | 29 | 0 |
| D | 0 | 29 | 0 |
| Quadrant | Total seconds | Saturated seconds | Saturation percentage |
|---|---|---|---|
| A | 10432 | 492 | 4.716258% |
| B | 10432 | 27 | 0.258819% |
| C | 10432 | 6 | 0.057515% |
| D | 10432 | 52 | 0.498466% |
Noise dominated data is calculated using 1-second bins in cleaned event files. If a bin has >2000 counts, and if more than 50% of those come from <1% of pixels, then it is considered to be noise-dominated and hence unusable.
| Quadrant | # 1 sec bins | Bins with >0 counts | Bins with >2000 counts | High rate bins dominated by noise | Noise dominated (total time) | Noise dominated (detector-on time) | Marked lightcurve |
|---|---|---|---|---|---|---|---|
| A | 13299 | 10434 | 411 | 411 | 3.09% | 3.94% | 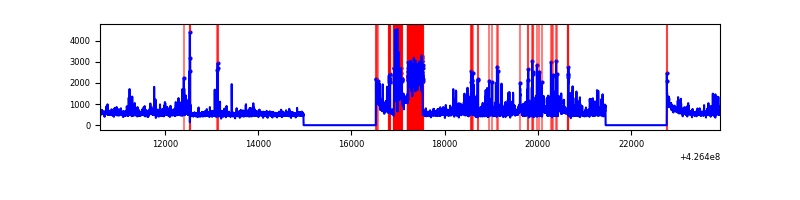 |
| B | 13299 | 10434 | 15 | 15 | 0.11% | 0.14% | 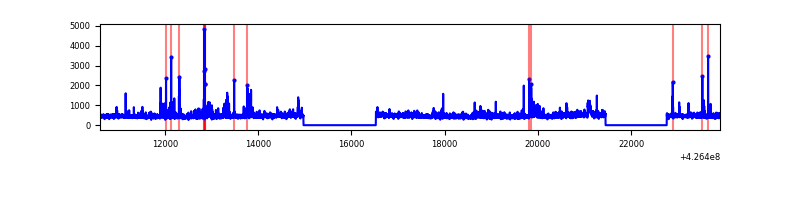 |
| C | 13299 | 10434 | 0 | 0 | 0.00% | 0.00% | 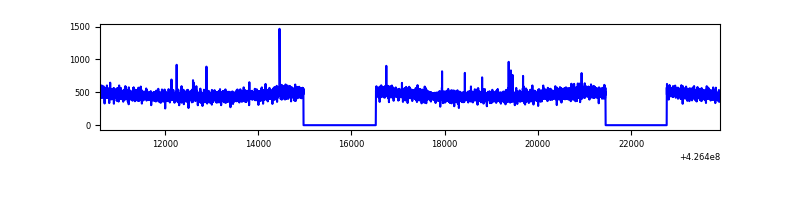 |
| D | 13299 | 10434 | 48 | 48 | 0.36% | 0.46% | 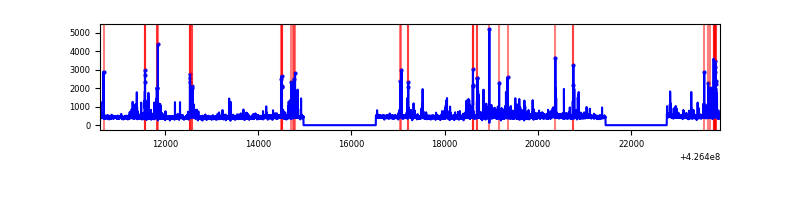 |
Top three noisy pixels from each quadrant. If the there are fewer than three noisy pixels in the level2.evt file, extra rows are filled as -1
| Pixel properties | Quadrant properties | ||||||
|---|---|---|---|---|---|---|---|
| Quadrant | DetID | PixID | Counts | Sigma | Mean | Median | Sigma |
| A | 15 | 223 | 1546436 | 6701.71 | 1124 | 1101 | 230.6 |
| A | 10 | 83 | 946747 | 4101.02 | 1124 | 1101 | 230.6 |
| A | 15 | 222 | 387333 | 1674.99 | 1124 | 1101 | 230.6 |
| B | 0 | 190 | 295837 | 1353.93 | 1132 | 1100 | 217.7 |
| B | 5 | 255 | 235943 | 1078.8 | 1132 | 1100 | 217.7 |
| B | 3 | 112 | 57536 | 259.25 | 1132 | 1100 | 217.7 |
| C | 15 | 214 | 429490 | 1652.46 | 1112 | 1120 | 259.2 |
| C | 15 | 111 | 14627 | 52.1 | 1112 | 1120 | 259.2 |
| C | 13 | 61 | 7511 | 24.65 | 1112 | 1120 | 259.2 |
| D | 12 | 217 | 254870 | 927.66 | 1115 | 1082 | 273.6 |
| D | 13 | 249 | 204876 | 744.92 | 1115 | 1082 | 273.6 |
| D | 12 | 233 | 98926 | 357.65 | 1115 | 1082 | 273.6 |
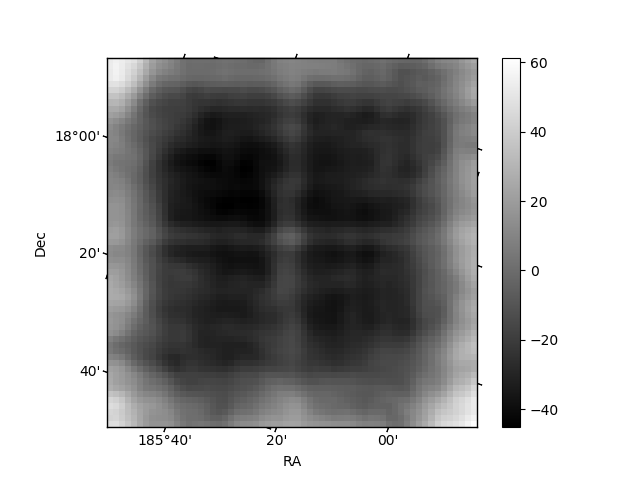
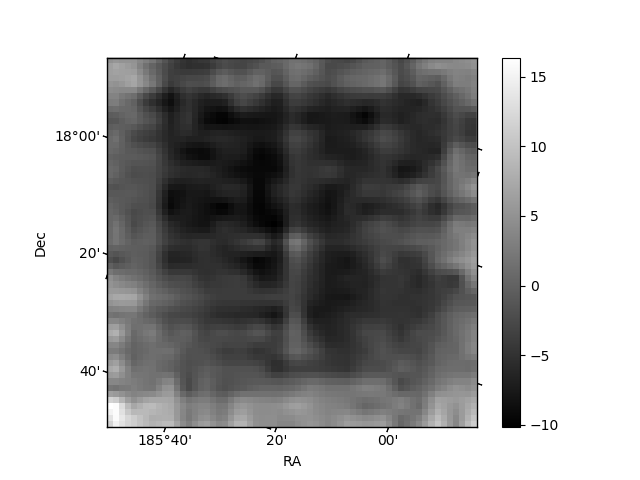
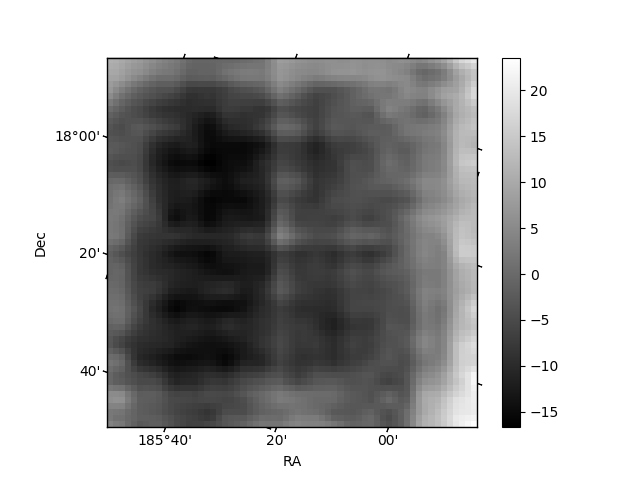
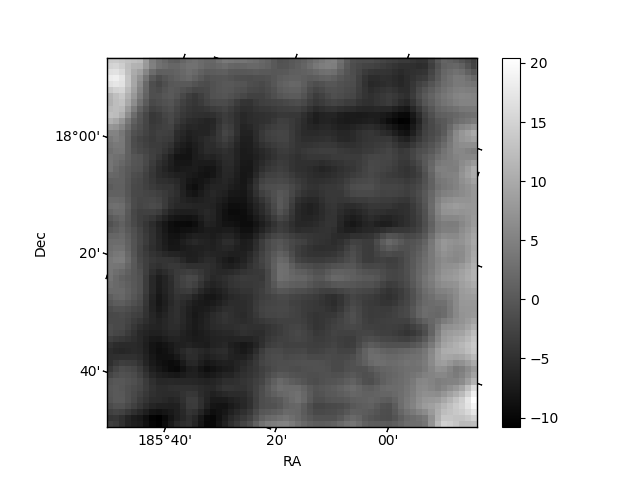
Histogram calculated using DETX and DETY for each event in the final _common_clean file
| Quadrant A | 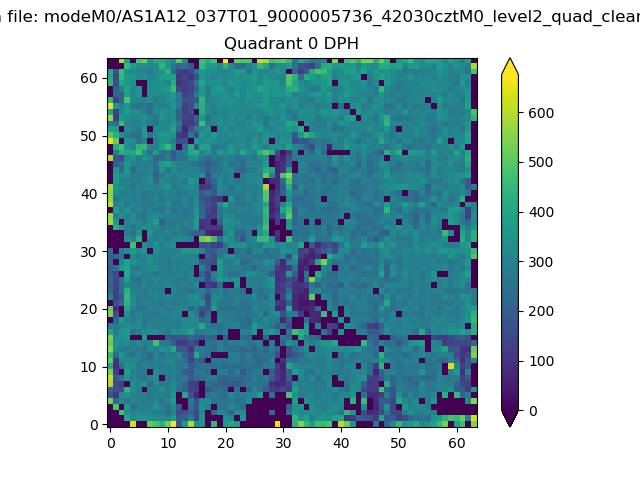 |
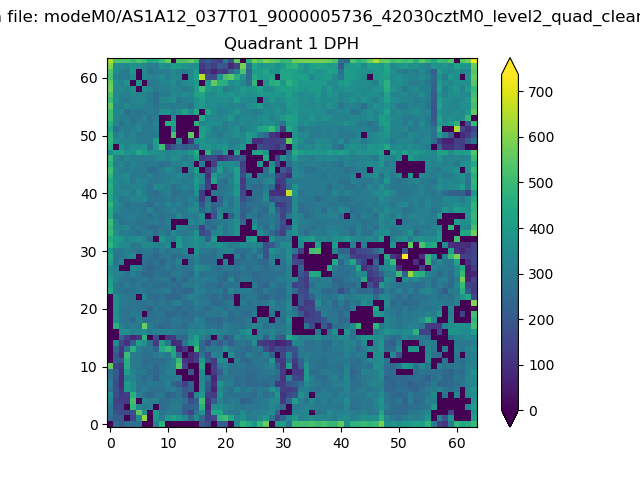 |
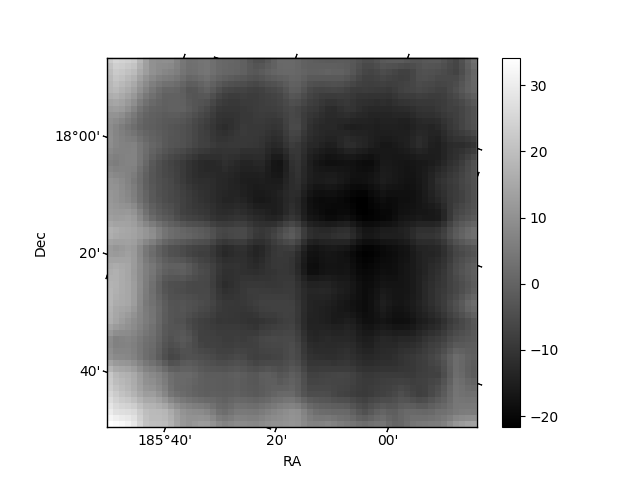
Quadrant B |
|---|---|---|---|
| Quadrant D | 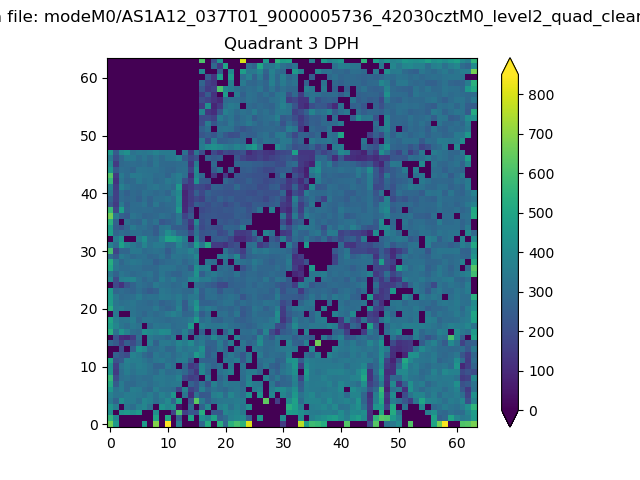 |
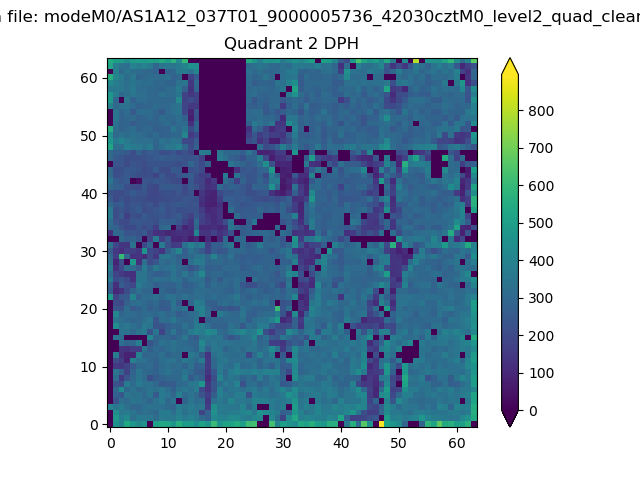 |
Quadrant C |
| Plot type | Count rate plots | Images |
|---|---|---|
| Comparison with Poisson distribution Blue bars denote a histogram of data divided into 1 sec bins. Red curve is a Poisson curve with rate = median count rate of data. |
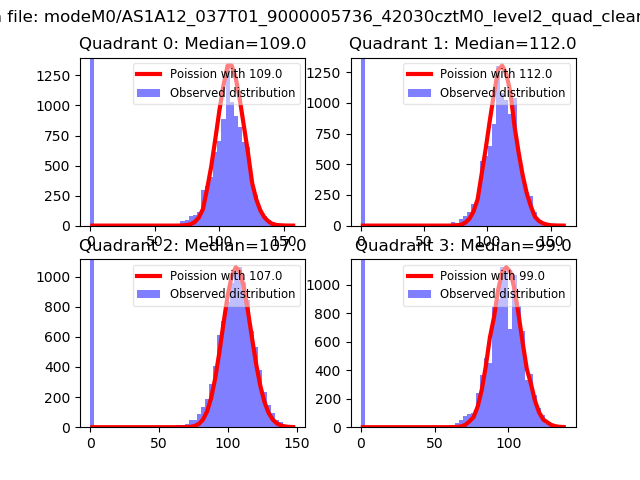 |
 |
| Quadrant-wise count rates Data is divided into 100 sec bins |
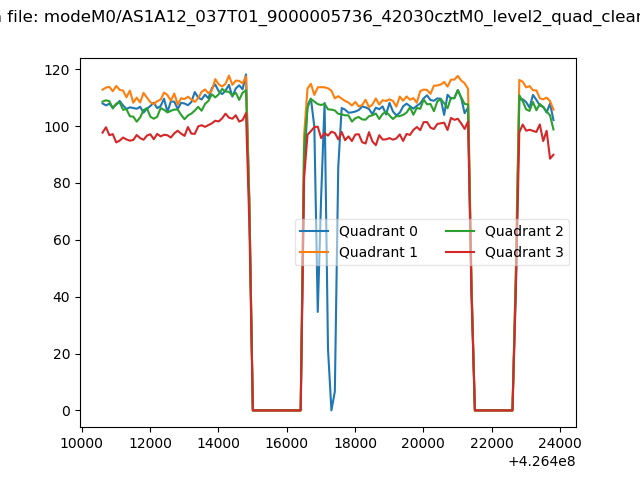 |
|
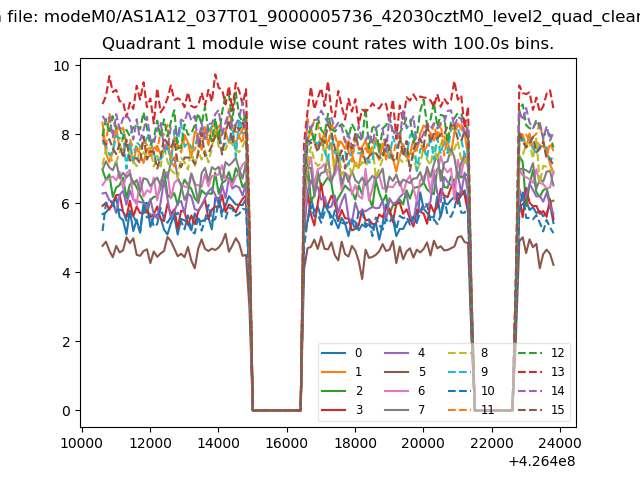
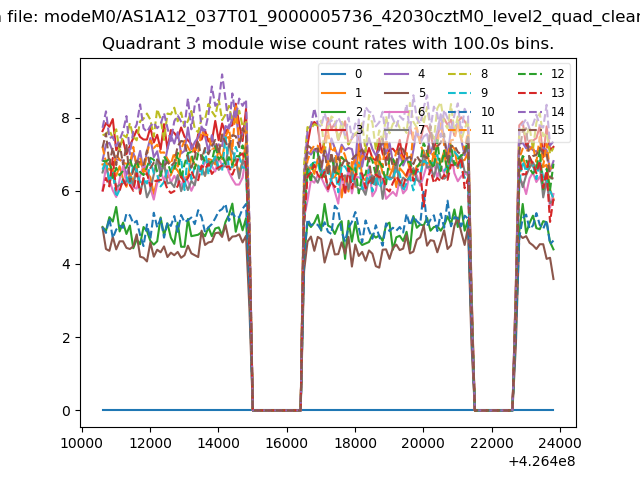
| Module-wise count rates for Quadrant A Data is divided into 100 sec bins |
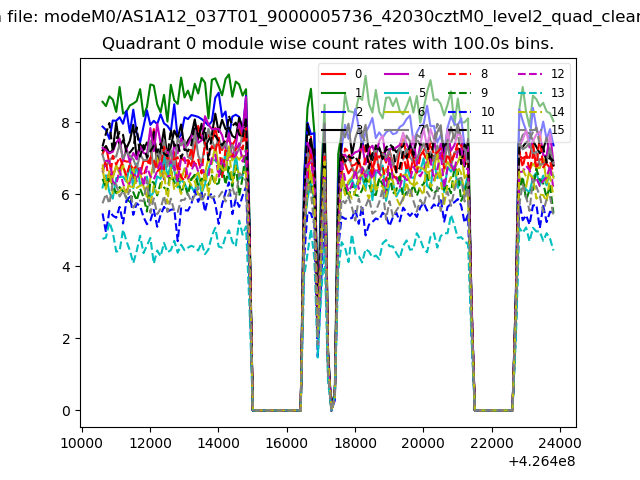 |
 |
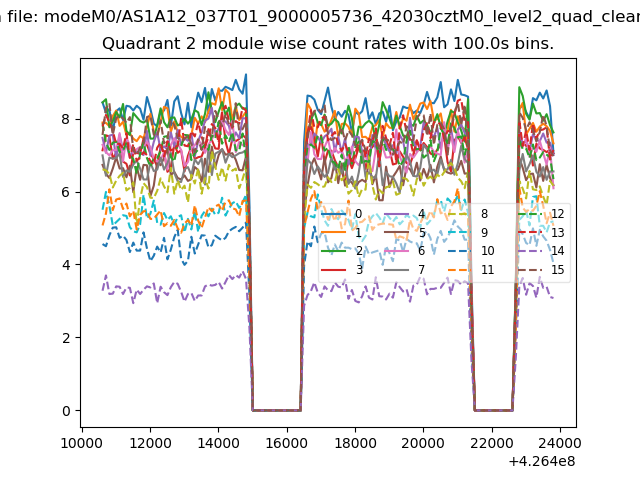
| Module-wise count rates for Quadrant B Data is divided into 100 sec bins |
 |
 |
| Module-wise count rates for Quadrant C Data is divided into 100 sec bins |
 |
 |
| Module-wise count rates for Quadrant D Data is divided into 100 sec bins |
 |
 |
| Parameter | Plot |
|---|---|
| CZT HV Monitor | 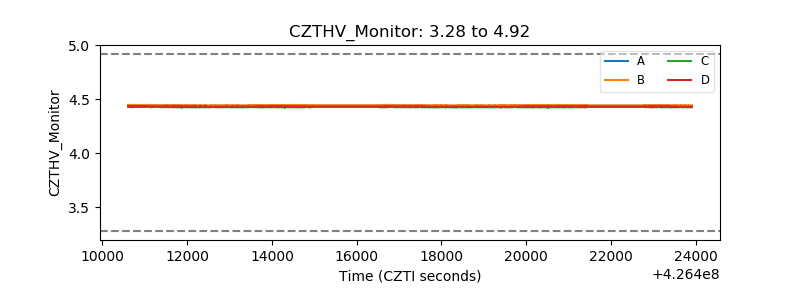 |
| D_VDD | 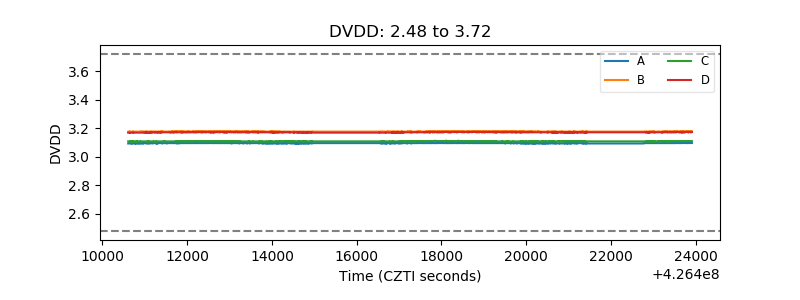 |
| Temperature 1 | 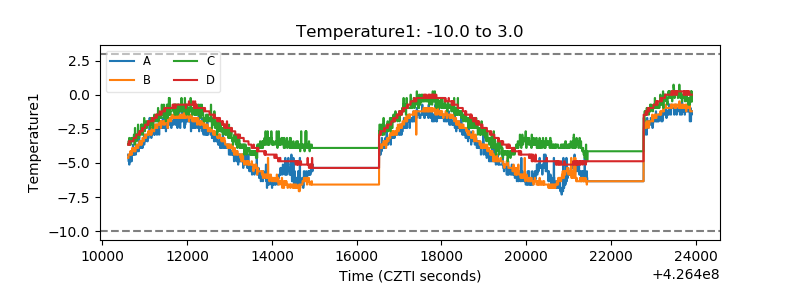 |
| Veto HV Monitor | 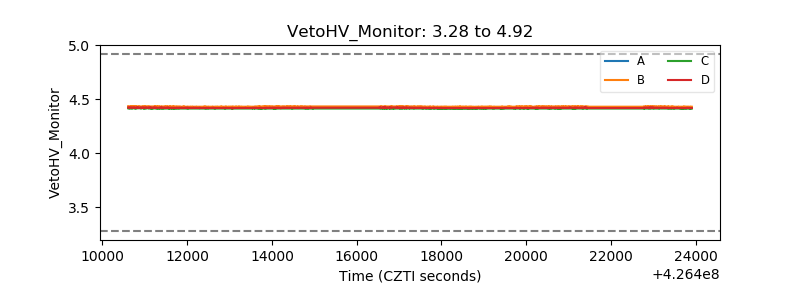 |
| Veto LLD |  |
| Alpha Counter | 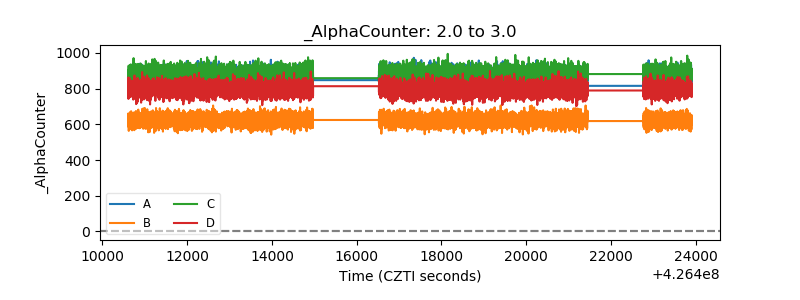 |
| _CPM_Rate | 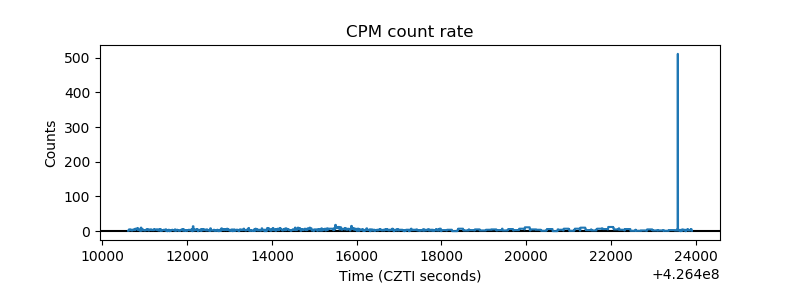 |
| CZT Counter | 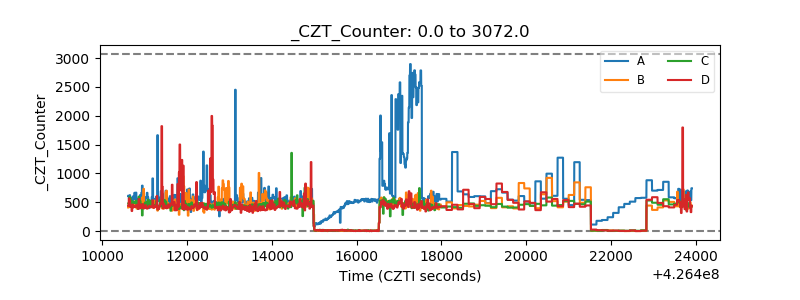 |
| +2.5 Volts monitor | 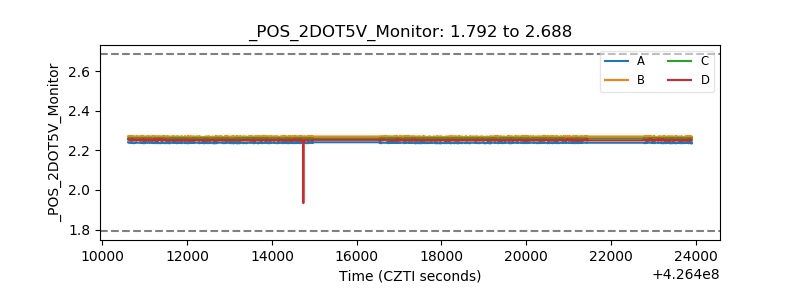 |
| +5 Volts monitor | 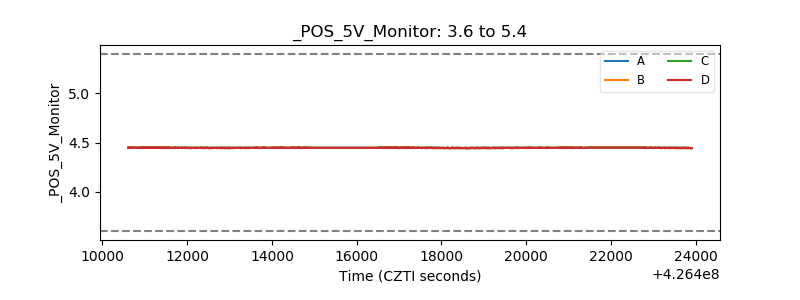 |
| _ROLL_ROT |  |
| _Roll_DEC | 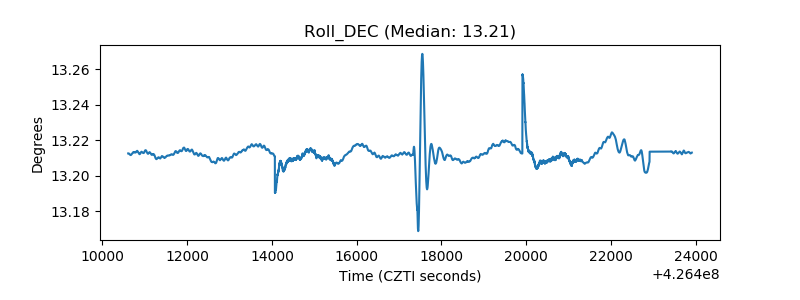 |
| _Roll_RA | 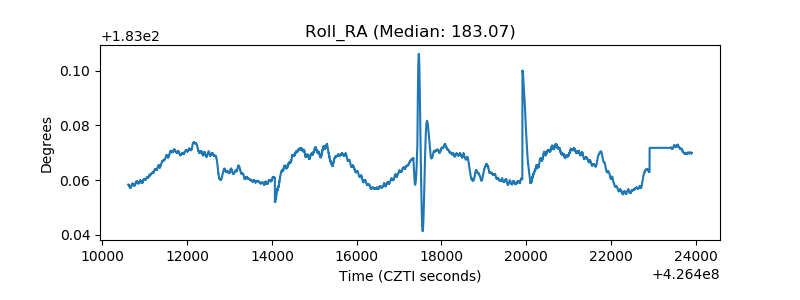 |
| Veto Counter |  |