| Param | Original file | Final file |
|---|---|---|
| Filename | modeM0/AS1A12_037T01_9000005736_42031cztM0_level2.fits | modeM0/AS1A12_037T01_9000005736_42031cztM0_level2_quad_clean.evt |
| Size (bytes) | 350,651,520 | 94,086,720 |
| Size | 334.4 MB | 89.7 MB |
| Events in quadrant A | 3,562,637 | 631,289 |
| Events in quadrant B | 2,826,205 | 641,189 |
| Events in quadrant C | 2,685,816 | 616,774 |
| Events in quadrant D | 3,449,106 | 550,289 |
| Mode SS | |||
|---|---|---|---|
| Quadrant | BADHDUFLAG | Total packets | Discarded packets |
| A | 0 | 118 | 0 |
| B | 0 | 118 | 0 |
| C | 0 | 118 | 0 |
| D | 0 | 118 | 0 |
| Mode M0 | |||
|---|---|---|---|
| Quadrant | BADHDUFLAG | Total packets | Discarded packets |
| A | 0 | 14317 | 2 |
| B | 0 | 12394 | 1 |
| C | 0 | 11760 | 1 |
| D | 0 | 14573 | 1 |
| Mode M9 | |||
|---|---|---|---|
| Quadrant | BADHDUFLAG | Total packets | Discarded packets |
| A | 0 | 13 | 0 |
| B | 0 | 13 | 0 |
| C | 0 | 13 | 0 |
| D | 0 | 13 | 0 |
| Quadrant | Total seconds | Saturated seconds | Saturation percentage |
|---|---|---|---|
| A | 5857 | 16 | 0.273177% |
| B | 5857 | 53 | 0.904900% |
| C | 5857 | 2 | 0.034147% |
| D | 5857 | 283 | 4.831825% |
Noise dominated data is calculated using 1-second bins in cleaned event files. If a bin has >2000 counts, and if more than 50% of those come from <1% of pixels, then it is considered to be noise-dominated and hence unusable.
| Quadrant | # 1 sec bins | Bins with >0 counts | Bins with >2000 counts | High rate bins dominated by noise | Noise dominated (total time) | Noise dominated (detector-on time) | Marked lightcurve |
|---|---|---|---|---|---|---|---|
| A | 7139 | 5858 | 3 | 3 | 0.04% | 0.05% | 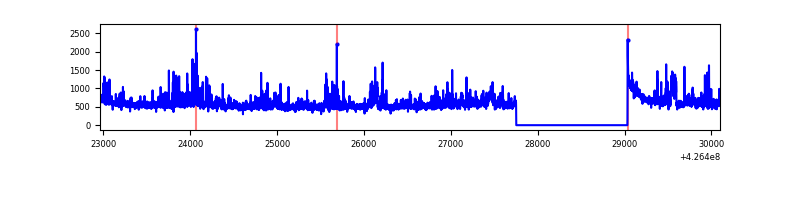 |
| B | 7139 | 5858 | 45 | 45 | 0.63% | 0.77% | 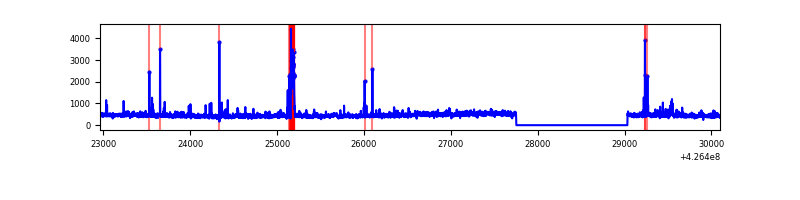 |
| C | 7139 | 5858 | 0 | 0 | 0.00% | 0.00% | 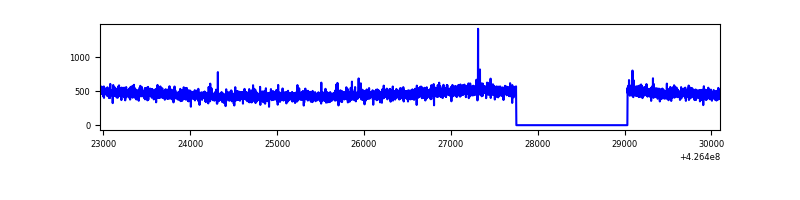 |
| D | 7139 | 5857 | 190 | 190 | 2.66% | 3.24% | 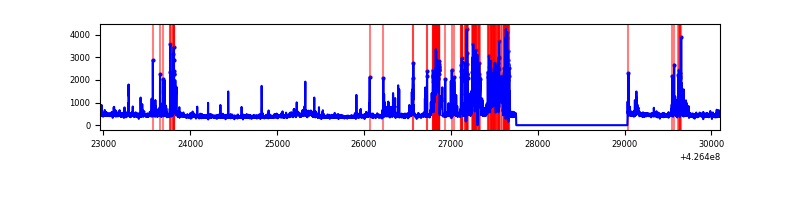 |
Top three noisy pixels from each quadrant. If the there are fewer than three noisy pixels in the level2.evt file, extra rows are filled as -1
| Pixel properties | Quadrant properties | ||||||
|---|---|---|---|---|---|---|---|
| Quadrant | DetID | PixID | Counts | Sigma | Mean | Median | Sigma |
| A | 10 | 83 | 578356 | 4362.07 | 640 | 625 | 132.4 |
| A | 15 | 222 | 226868 | 1708.21 | 640 | 625 | 132.4 |
| A | 12 | 189 | 109433 | 821.54 | 640 | 625 | 132.4 |
| B | 5 | 32 | 133631 | 1074.4 | 633 | 615 | 123.8 |
| B | 0 | 190 | 105597 | 847.97 | 633 | 615 | 123.8 |
| B | 3 | 112 | 35470 | 281.53 | 633 | 615 | 123.8 |
| C | 15 | 214 | 243298 | 1639.14 | 625 | 629 | 148.0 |
| C | 13 | 61 | 4304 | 24.82 | 625 | 629 | 148.0 |
| C | 12 | 249 | 2726 | 14.16 | 625 | 629 | 148.0 |
| D | 13 | 249 | 581516 | 3855.87 | 612 | 595 | 150.7 |
| D | 12 | 6 | 280445 | 1857.51 | 612 | 595 | 150.7 |
| D | 2 | 249 | 75648 | 498.17 | 612 | 595 | 150.7 |
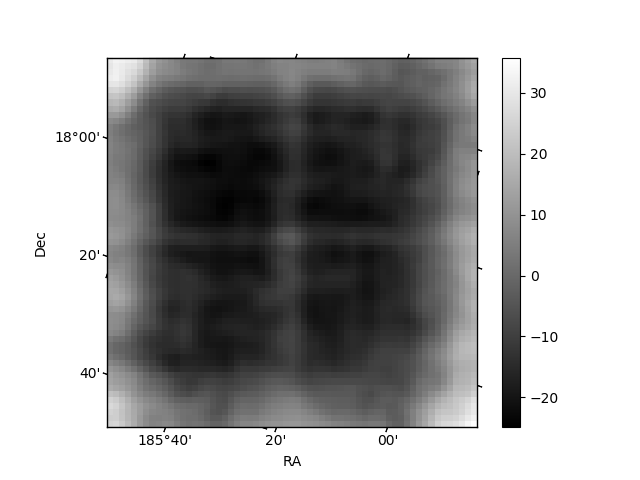
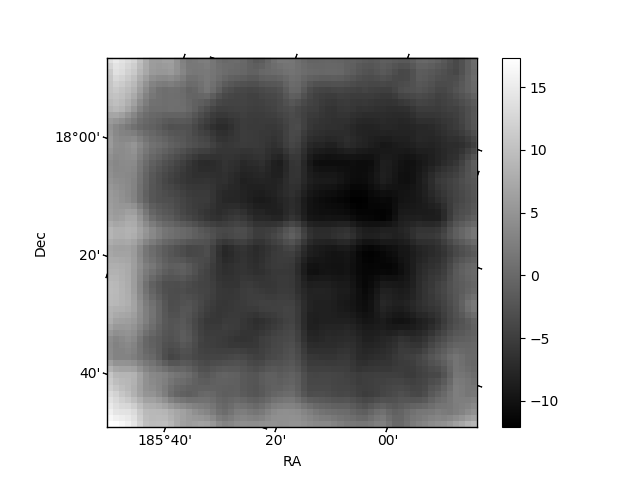
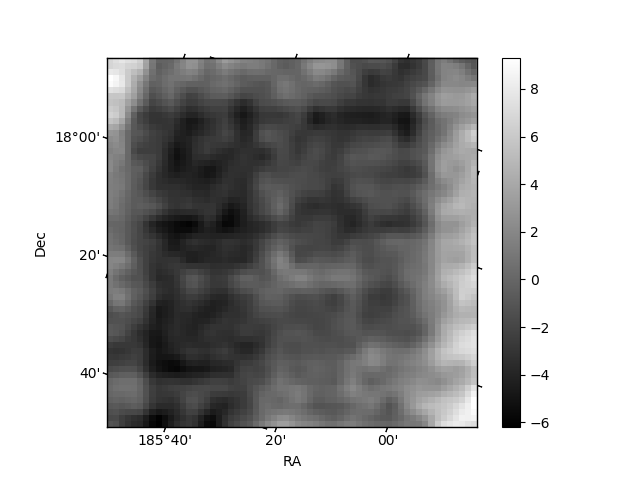
Histogram calculated using DETX and DETY for each event in the final _common_clean file
| Quadrant A | 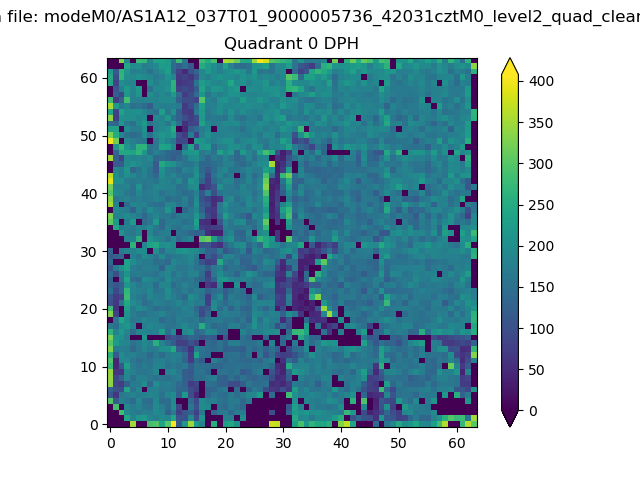 |
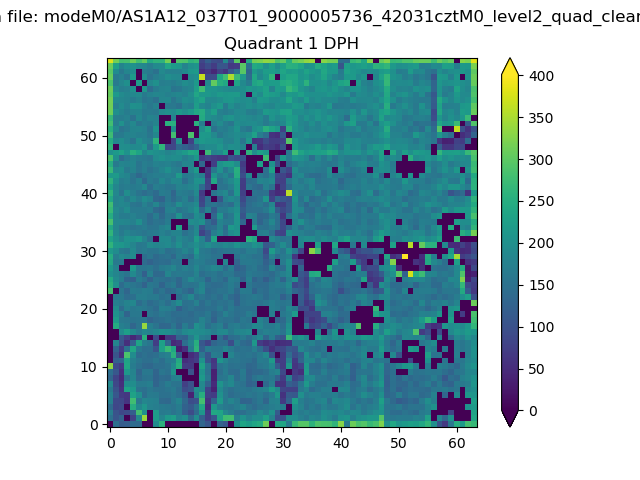 |
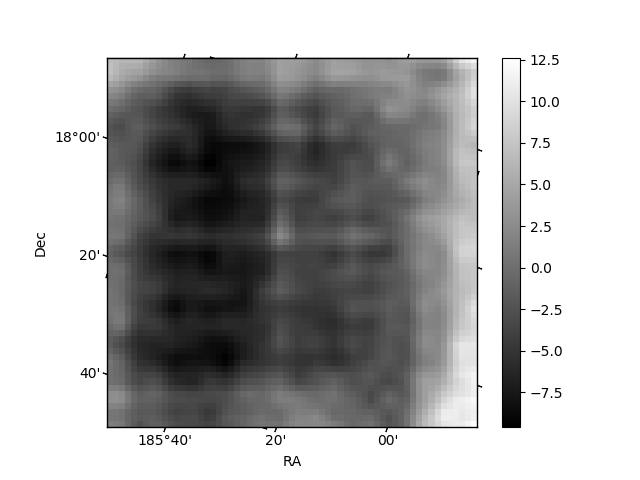
Quadrant B |
|---|---|---|---|
| Quadrant D | 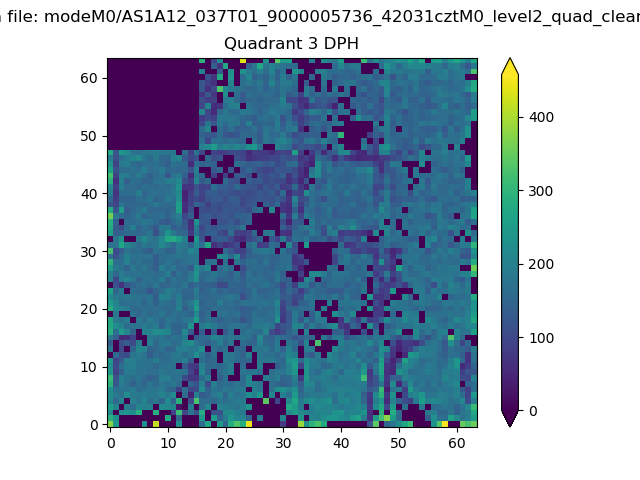 |
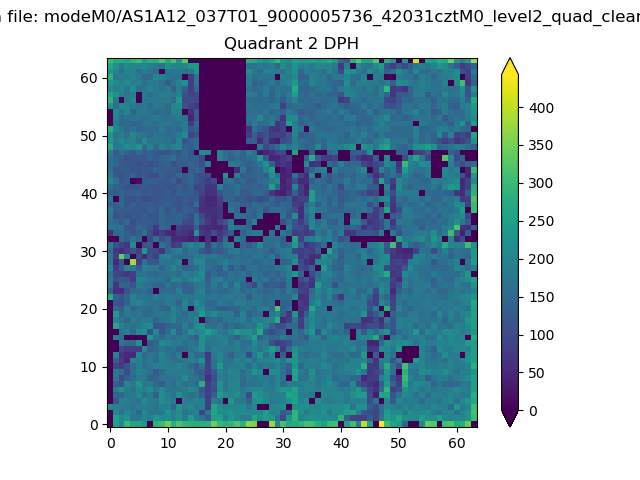 |
Quadrant C |
| Plot type | Count rate plots | Images |
|---|---|---|
| Comparison with Poisson distribution Blue bars denote a histogram of data divided into 1 sec bins. Red curve is a Poisson curve with rate = median count rate of data. |
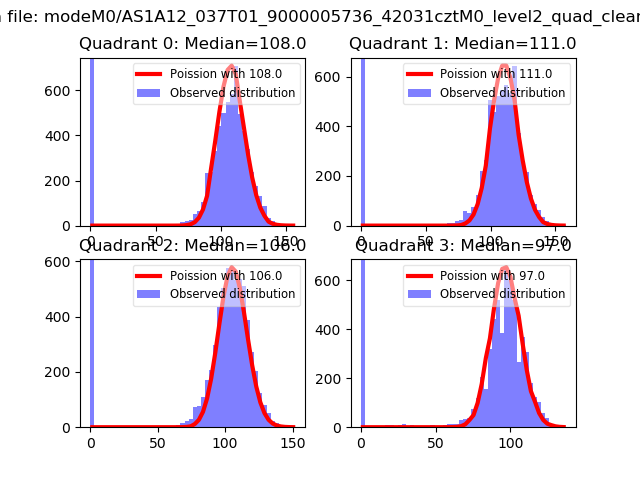 |
 |
| Quadrant-wise count rates Data is divided into 100 sec bins |
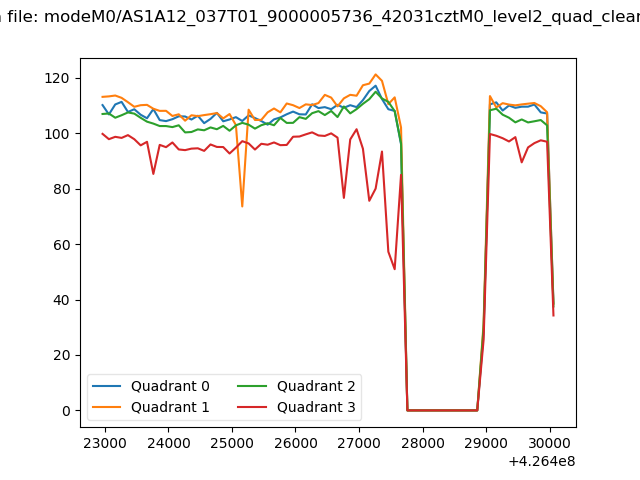 |
|
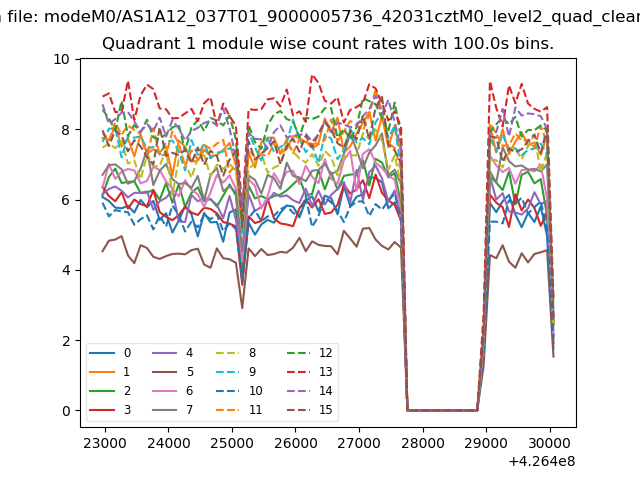
| Module-wise count rates for Quadrant A Data is divided into 100 sec bins |
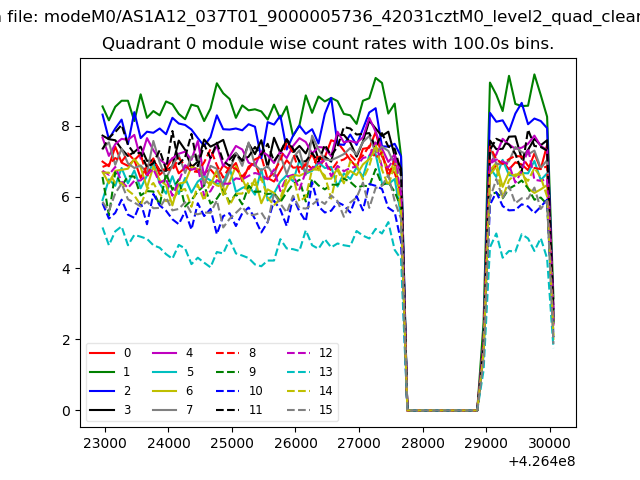 |
 |
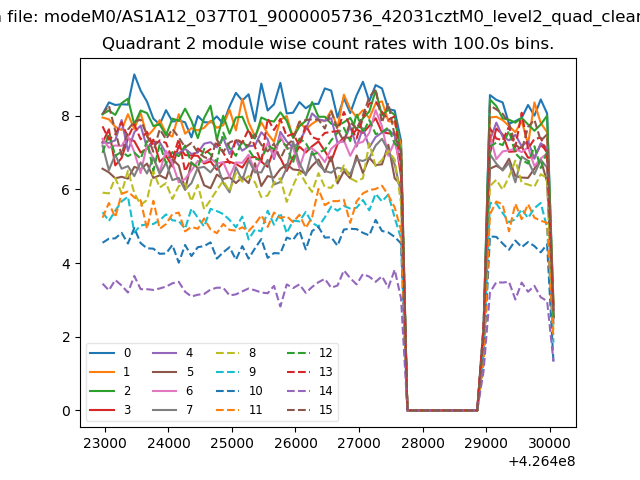
| Module-wise count rates for Quadrant B Data is divided into 100 sec bins |
 |
 |
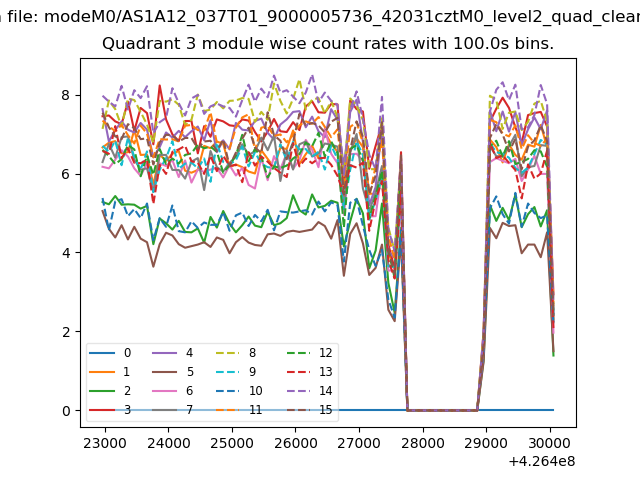
| Module-wise count rates for Quadrant C Data is divided into 100 sec bins |
 |
 |
| Module-wise count rates for Quadrant D Data is divided into 100 sec bins |
 |
 |
| Parameter | Plot |
|---|---|
| CZT HV Monitor | 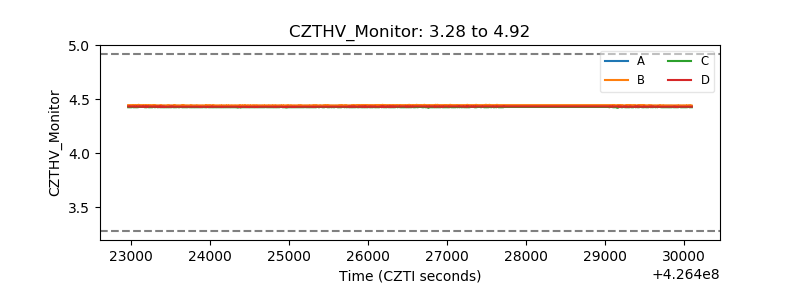 |
| D_VDD | 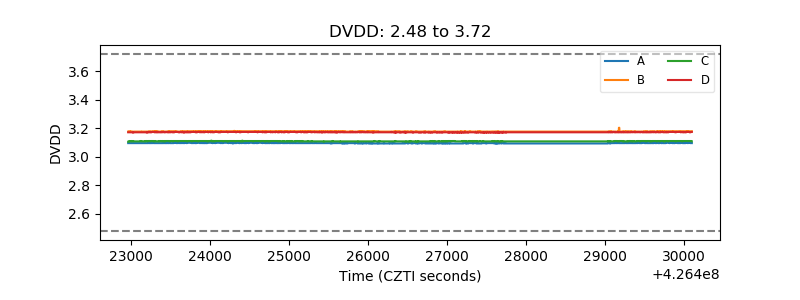 |
| Temperature 1 | 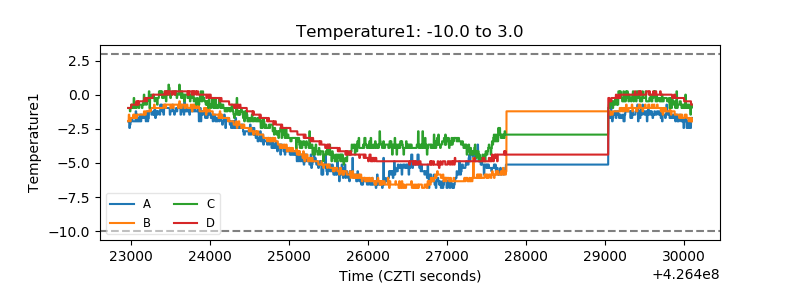 |
| Veto HV Monitor | 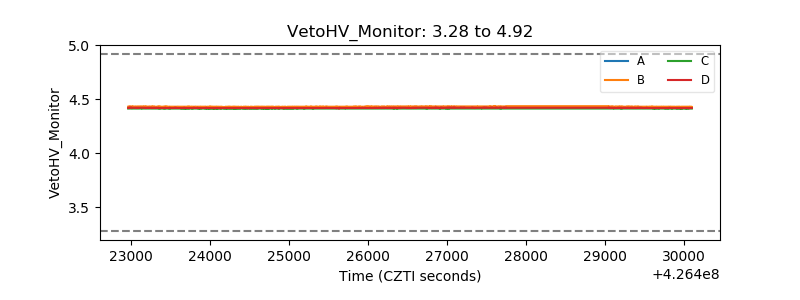 |
| Veto LLD | 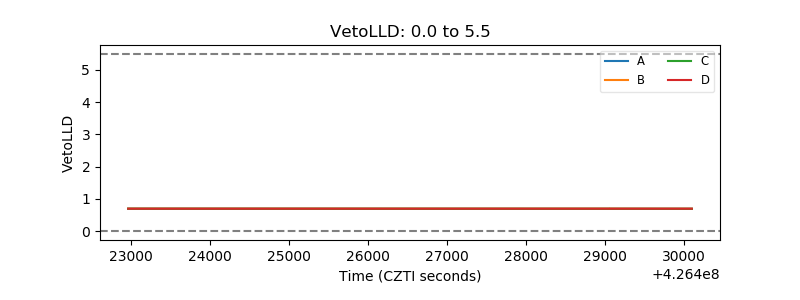 |
| Alpha Counter | 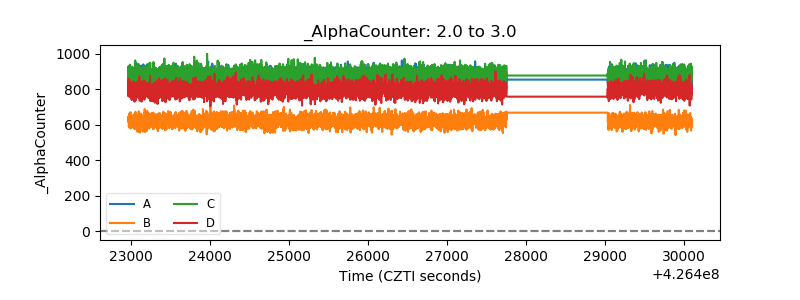 |
| _CPM_Rate | 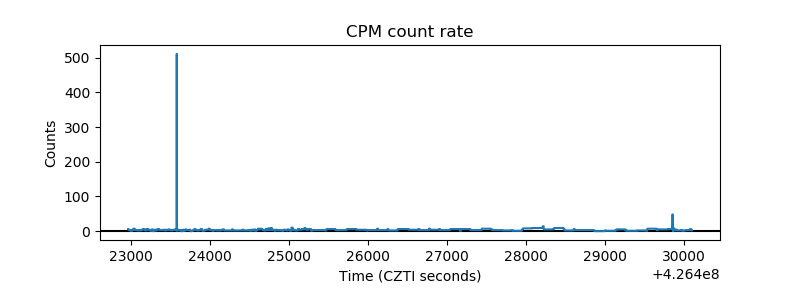 |
| CZT Counter | 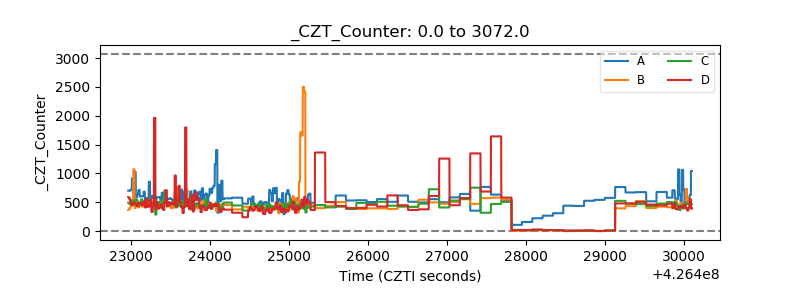 |
| +2.5 Volts monitor |  |
| +5 Volts monitor |  |
| _ROLL_ROT | 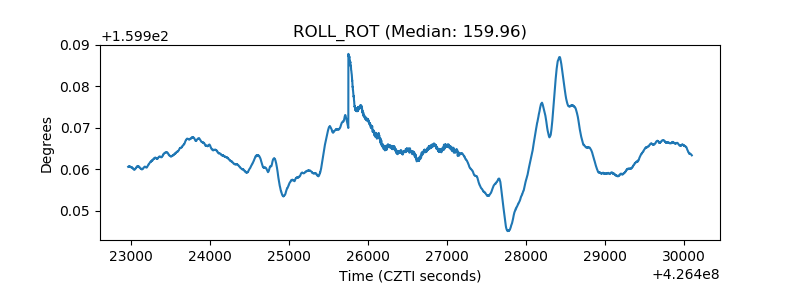 |
| _Roll_DEC | 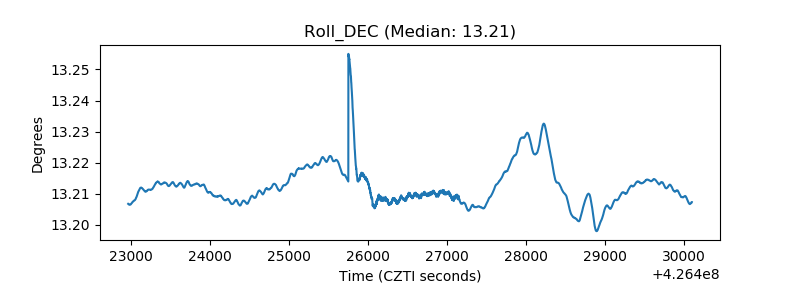 |
| _Roll_RA | 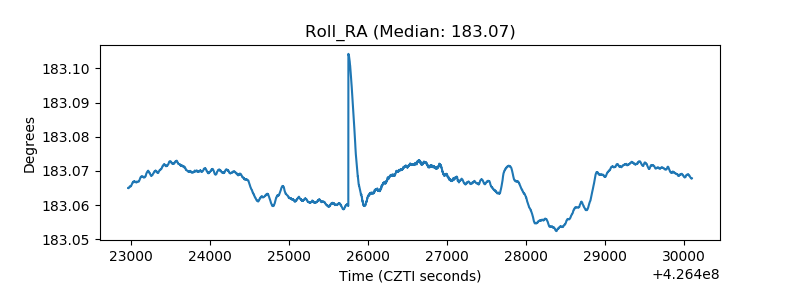 |
| Veto Counter | 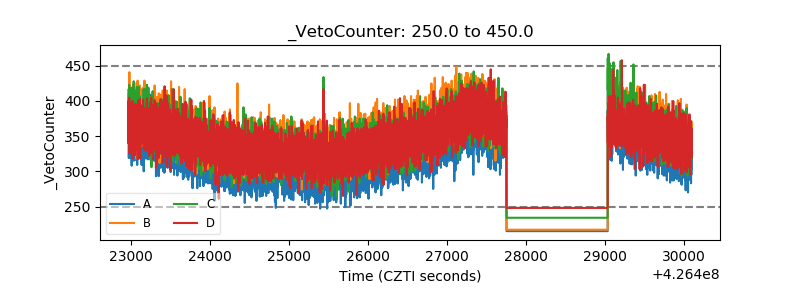 |