| Param | Original file | Final file |
|---|---|---|
| Filename | modeM0/AS1A12_037T01_9000005736_42033cztM0_level2.fits | modeM0/AS1A12_037T01_9000005736_42033cztM0_level2_quad_clean.evt |
| Size (bytes) | 677,629,440 | 169,067,520 |
| Size | 646.2 MB | 161.2 MB |
| Events in quadrant A | 7,125,907 | 1,114,355 |
| Events in quadrant B | 5,052,258 | 1,157,870 |
| Events in quadrant C | 4,866,745 | 1,109,014 |
| Events in quadrant D | 7,216,371 | 1,002,350 |
| Mode SS | |||
|---|---|---|---|
| Quadrant | BADHDUFLAG | Total packets | Discarded packets |
| A | 0 | 218 | 0 |
| B | 0 | 218 | 0 |
| C | 0 | 218 | 0 |
| D | 0 | 218 | 0 |
| Mode M0 | |||
|---|---|---|---|
| Quadrant | BADHDUFLAG | Total packets | Discarded packets |
| A | 0 | 28023 | 3 |
| B | 0 | 22414 | 2 |
| C | 0 | 21420 | 2 |
| D | 0 | 28856 | 2 |
| Mode M9 | |||
|---|---|---|---|
| Quadrant | BADHDUFLAG | Total packets | Discarded packets |
| A | 0 | 27 | 0 |
| B | 0 | 27 | 0 |
| C | 0 | 27 | 0 |
| D | 0 | 27 | 0 |
| Quadrant | Total seconds | Saturated seconds | Saturation percentage |
|---|---|---|---|
| A | 10608 | 302 | 2.846908% |
| B | 10608 | 66 | 0.622172% |
| C | 10608 | 10 | 0.094268% |
| D | 10608 | 347 | 3.271116% |
Noise dominated data is calculated using 1-second bins in cleaned event files. If a bin has >2000 counts, and if more than 50% of those come from <1% of pixels, then it is considered to be noise-dominated and hence unusable.
| Quadrant | # 1 sec bins | Bins with >0 counts | Bins with >2000 counts | High rate bins dominated by noise | Noise dominated (total time) | Noise dominated (detector-on time) | Marked lightcurve |
|---|---|---|---|---|---|---|---|
| A | 13382 | 10610 | 218 | 218 | 1.63% | 2.05% | 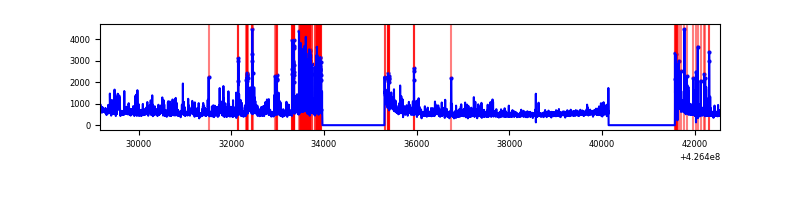 |
| B | 13382 | 10610 | 44 | 44 | 0.33% | 0.41% | 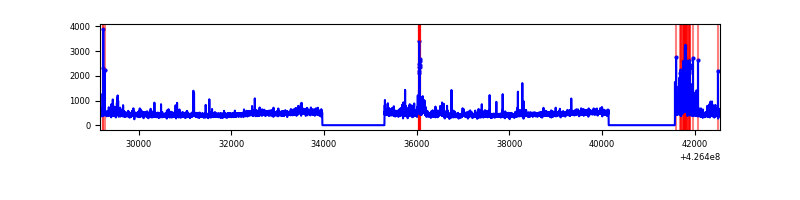 |
| C | 13382 | 10610 | 3 | 3 | 0.02% | 0.03% | 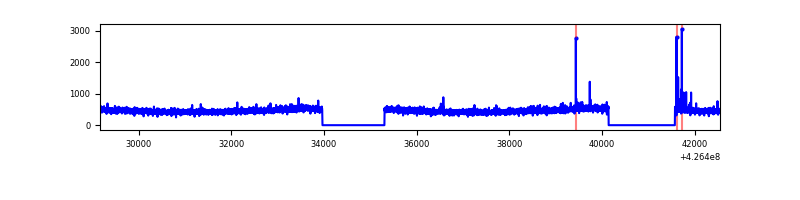 |
| D | 13382 | 10610 | 310 | 310 | 2.32% | 2.92% | 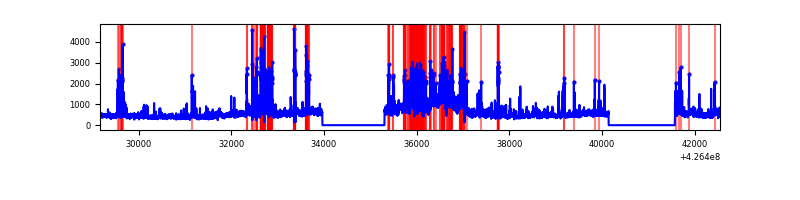 |
Top three noisy pixels from each quadrant. If the there are fewer than three noisy pixels in the level2.evt file, extra rows are filled as -1
| Pixel properties | Quadrant properties | ||||||
|---|---|---|---|---|---|---|---|
| Quadrant | DetID | PixID | Counts | Sigma | Mean | Median | Sigma |
| A | 15 | 223 | 1156687 | 4966.24 | 1132 | 1108 | 232.7 |
| A | 10 | 83 | 1007201 | 4323.81 | 1132 | 1108 | 232.7 |
| A | 15 | 222 | 342307 | 1466.34 | 1132 | 1108 | 232.7 |
| B | 0 | 190 | 174710 | 786.22 | 1144 | 1112 | 220.8 |
| B | 4 | 81 | 173897 | 782.54 | 1144 | 1112 | 220.8 |
| B | 5 | 255 | 51567 | 228.51 | 1144 | 1112 | 220.8 |
| C | 15 | 214 | 441814 | 1677.67 | 1123 | 1130 | 262.7 |
| C | 8 | 79 | 21187 | 76.36 | 1123 | 1130 | 262.7 |
| C | 12 | 249 | 19046 | 68.21 | 1123 | 1130 | 262.7 |
| D | 1 | 52 | 1976819 | 7298.25 | 1108 | 1078 | 270.7 |
| D | 13 | 249 | 461968 | 1702.5 | 1108 | 1078 | 270.7 |
| D | 2 | 249 | 150050 | 550.29 | 1108 | 1078 | 270.7 |
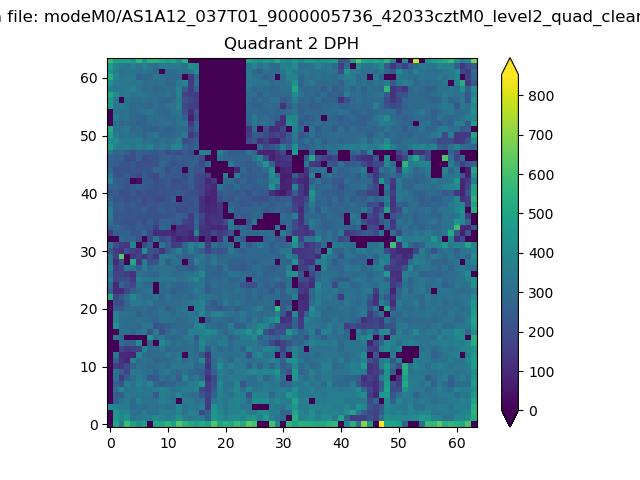
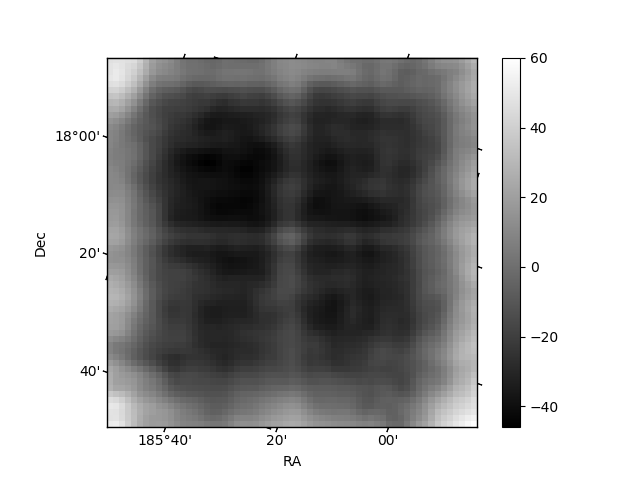
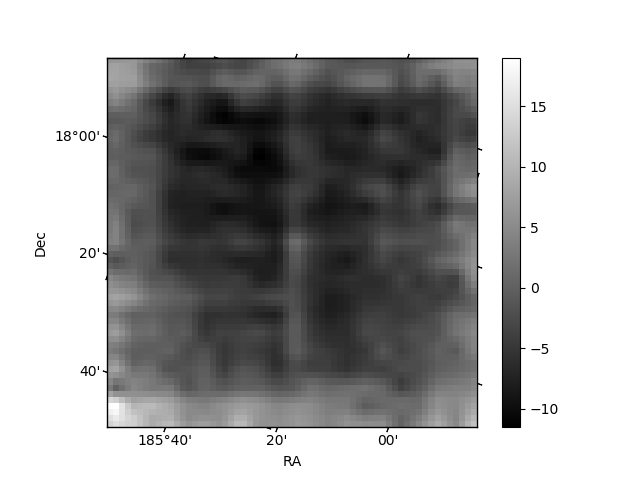
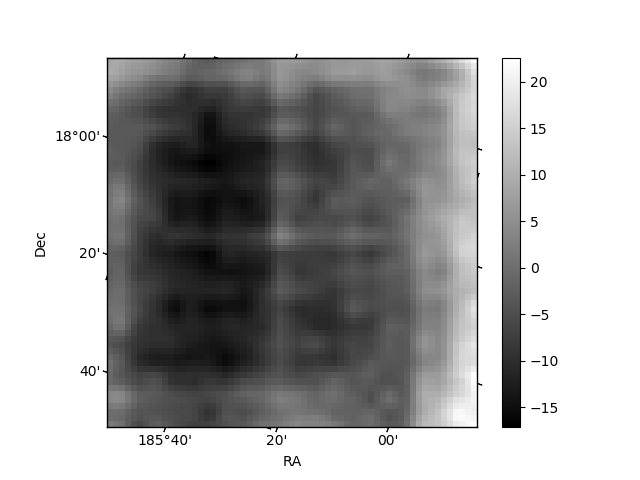
Histogram calculated using DETX and DETY for each event in the final _common_clean file
| Quadrant A | 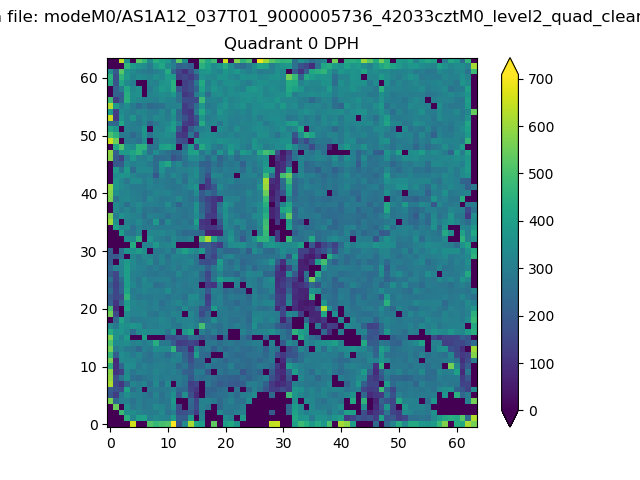 |
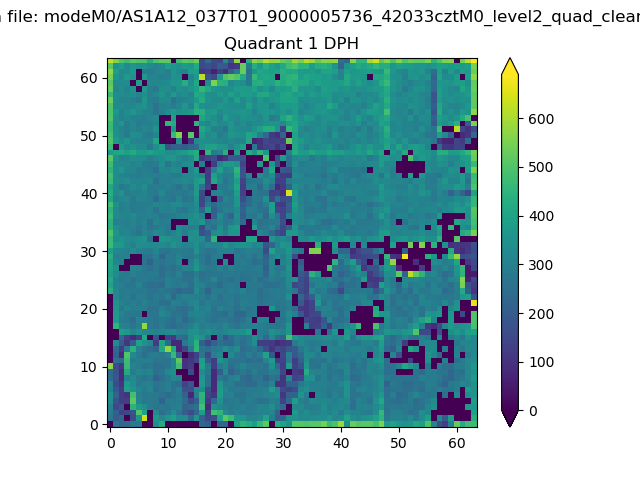 |
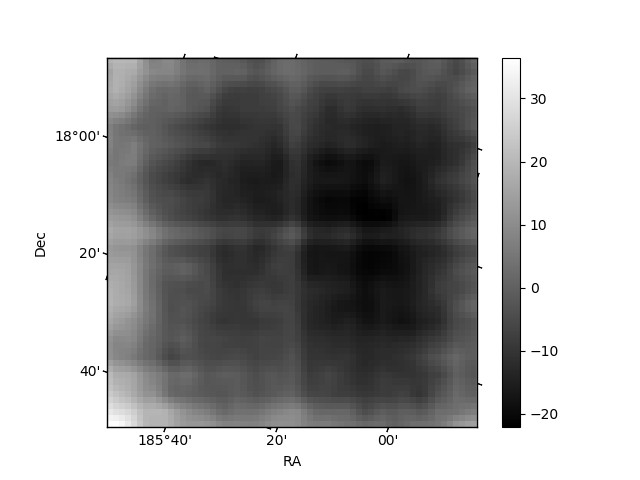
Quadrant B |
|---|---|---|---|
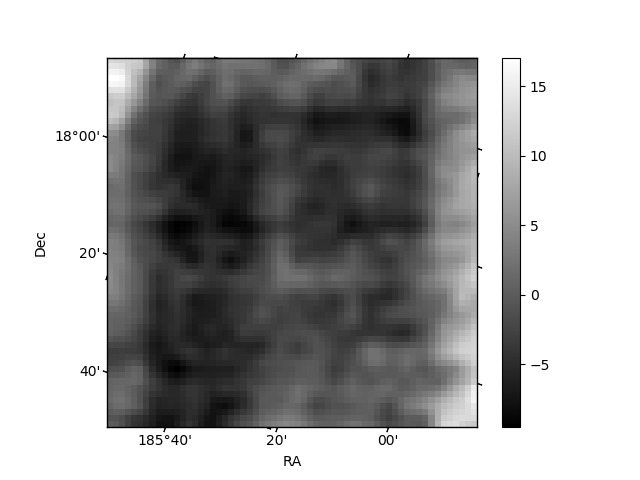
| Quadrant D | 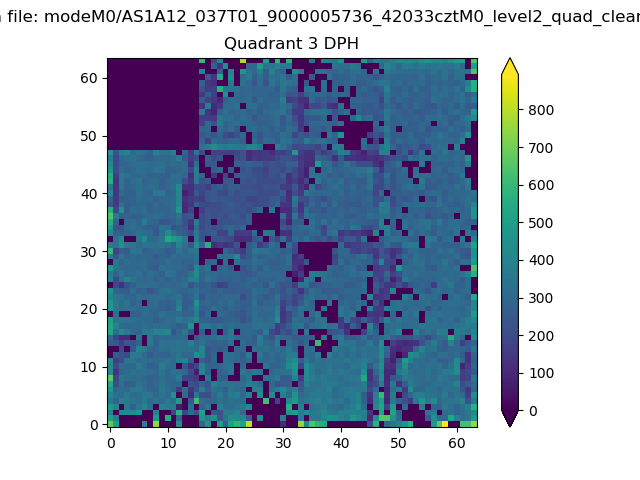 |
 |
Quadrant C |
| Plot type | Count rate plots | Images |
|---|---|---|
| Comparison with Poisson distribution Blue bars denote a histogram of data divided into 1 sec bins. Red curve is a Poisson curve with rate = median count rate of data. |
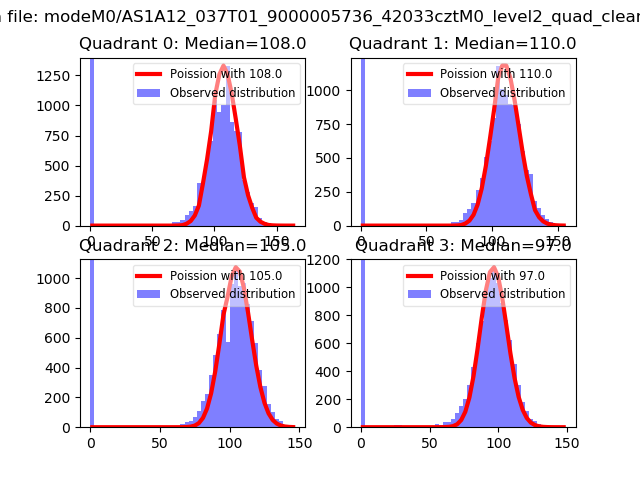 |
 |
| Quadrant-wise count rates Data is divided into 100 sec bins |
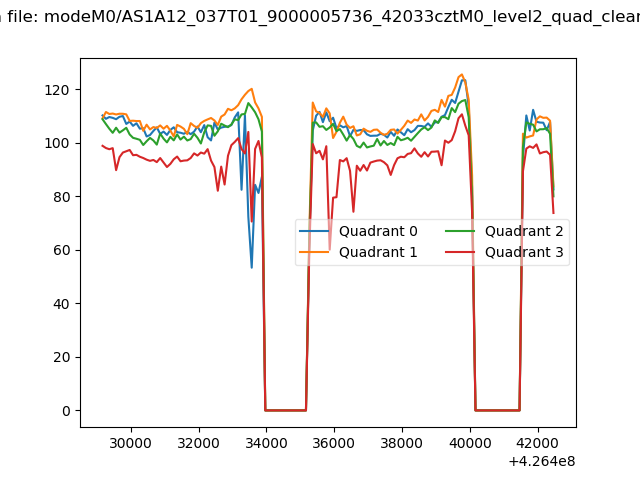 |
|
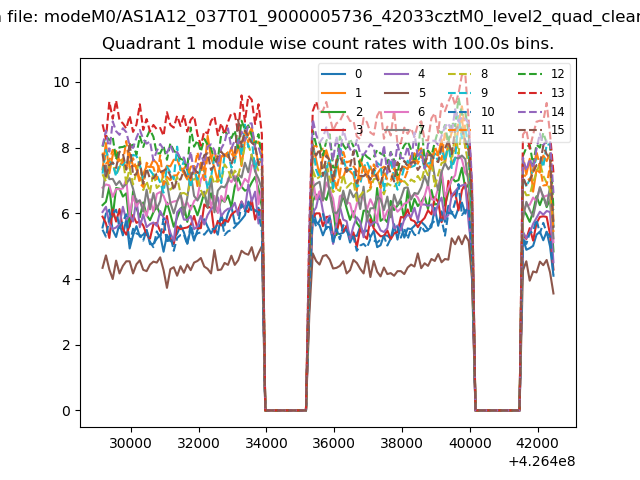
| Module-wise count rates for Quadrant A Data is divided into 100 sec bins |
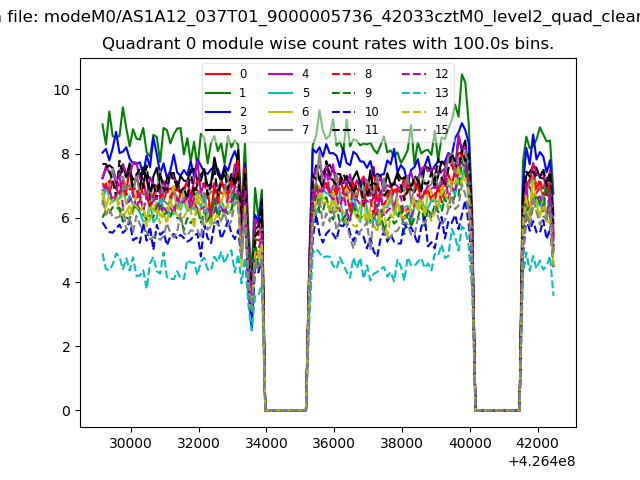 |
 |
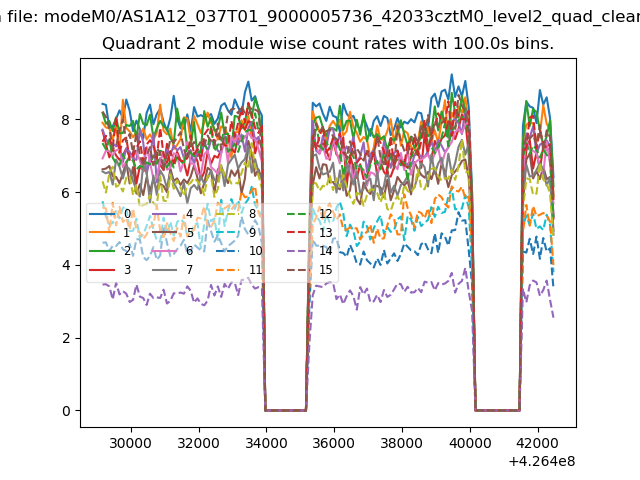
| Module-wise count rates for Quadrant B Data is divided into 100 sec bins |
 |
 |
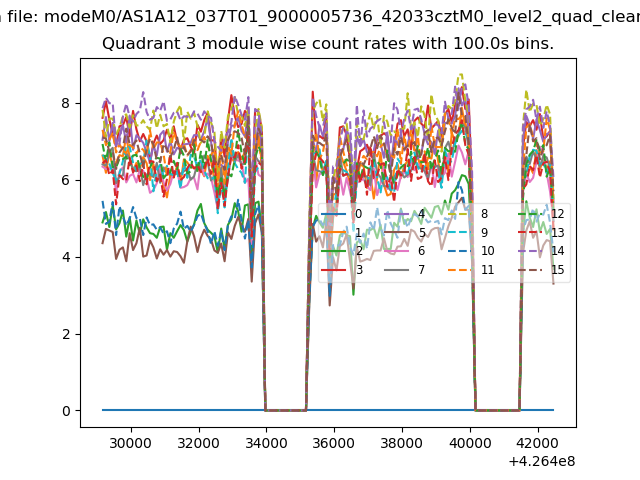
| Module-wise count rates for Quadrant C Data is divided into 100 sec bins |
 |
 |
| Module-wise count rates for Quadrant D Data is divided into 100 sec bins |
 |
 |
| Parameter | Plot |
|---|---|
| CZT HV Monitor | 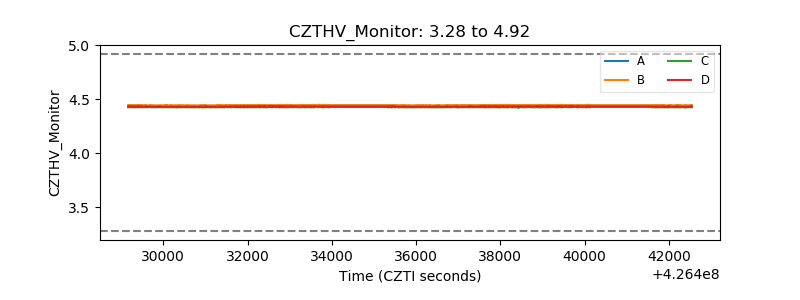 |
| D_VDD | 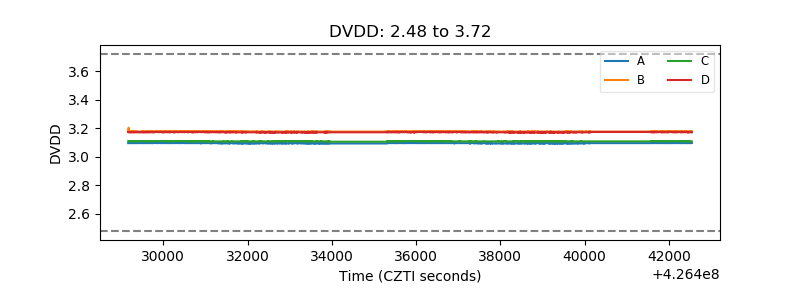 |
| Temperature 1 | 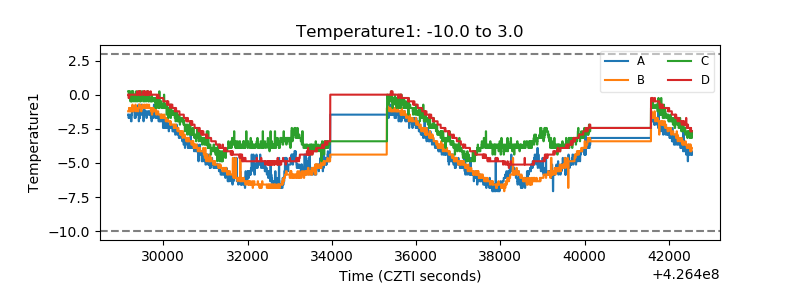 |
| Veto HV Monitor |  |
| Veto LLD | 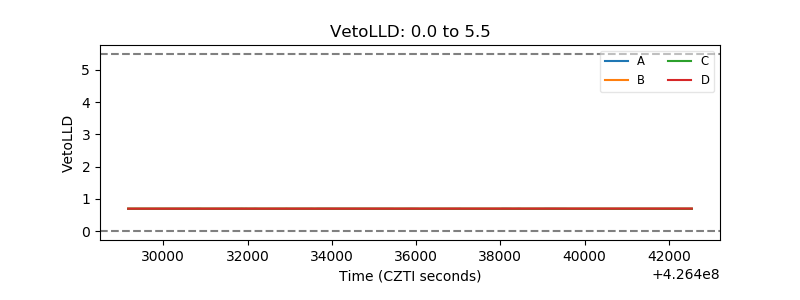 |
| Alpha Counter | 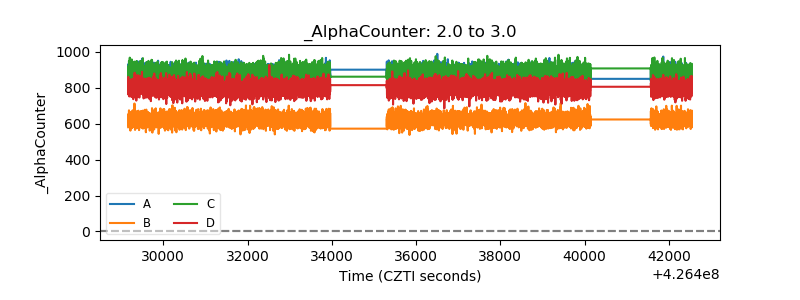 |
| _CPM_Rate | 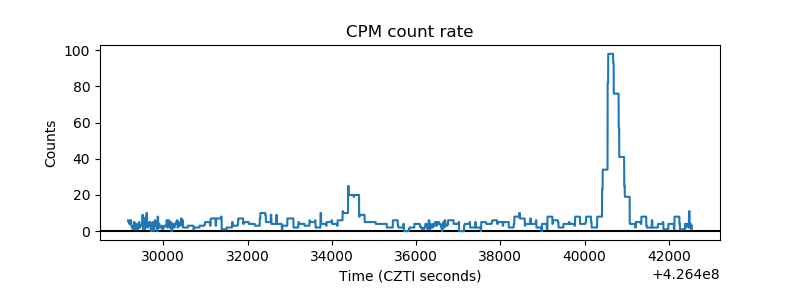 |
| CZT Counter | 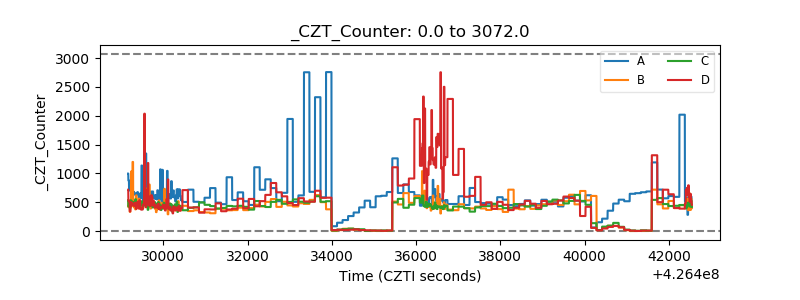 |
| +2.5 Volts monitor | 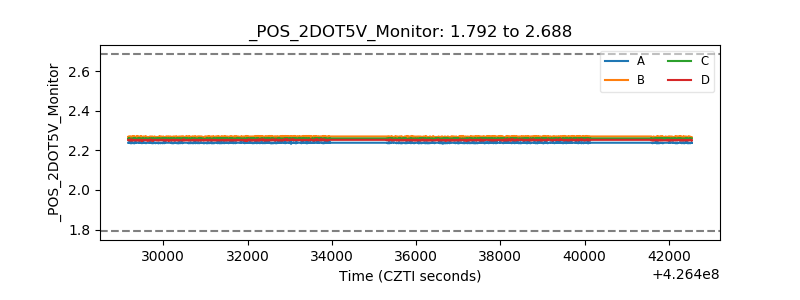 |
| +5 Volts monitor | 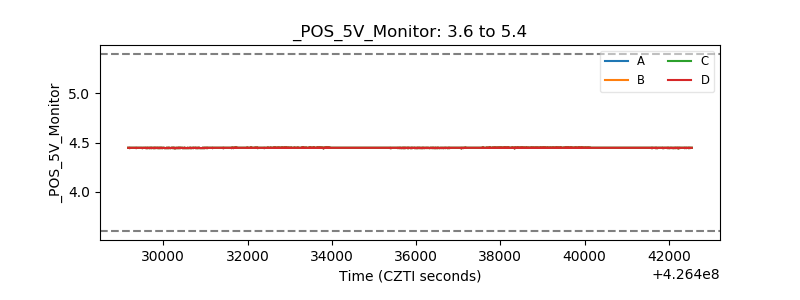 |
| _ROLL_ROT | 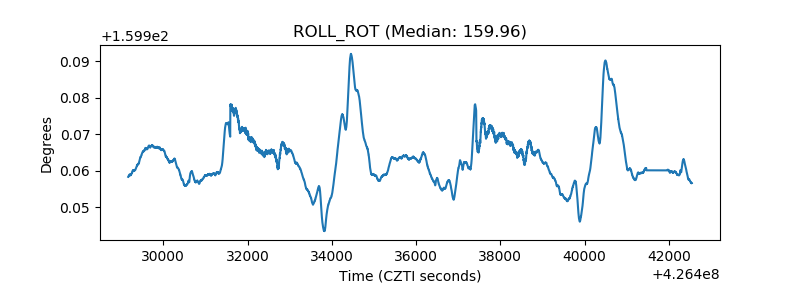 |
| _Roll_DEC | 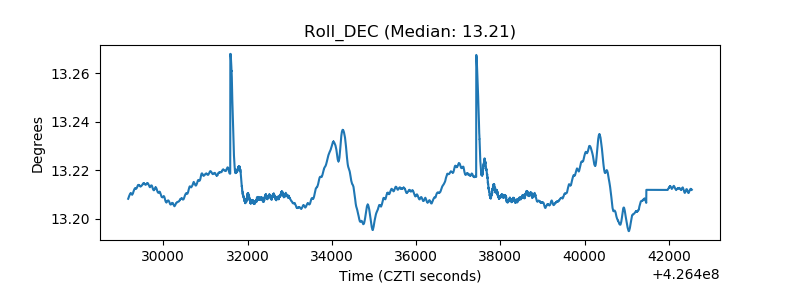 |
| _Roll_RA | 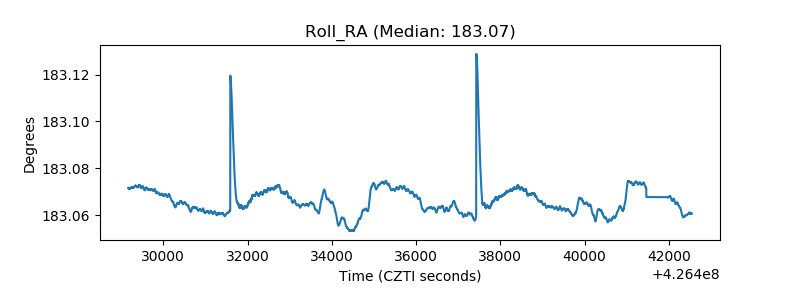 |
| Veto Counter | 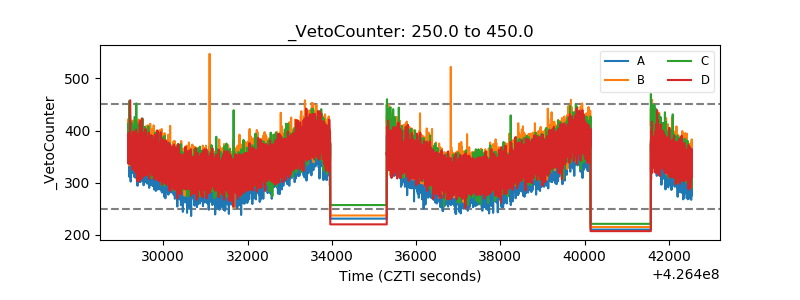 |