| Param | Original file | Final file |
|---|---|---|
| Filename | modeM0/AS1A12_037T01_9000005736_42035cztM0_level2.fits | modeM0/AS1A12_037T01_9000005736_42035cztM0_level2_quad_clean.evt |
| Size (bytes) | 355,743,360 | 85,968,000 |
| Size | 339.3 MB | 82.0 MB |
| Events in quadrant A | 4,749,171 | 550,717 |
| Events in quadrant B | 2,714,364 | 591,887 |
| Events in quadrant C | 2,474,624 | 566,557 |
| Events in quadrant D | 2,813,537 | 518,521 |
| Mode SS | |||
|---|---|---|---|
| Quadrant | BADHDUFLAG | Total packets | Discarded packets |
| A | 0 | 110 | 0 |
| B | 0 | 110 | 0 |
| C | 0 | 110 | 0 |
| D | 0 | 110 | 0 |
| Mode M0 | |||
|---|---|---|---|
| Quadrant | BADHDUFLAG | Total packets | Discarded packets |
| A | 0 | 17770 | 3 |
| B | 0 | 11799 | 2 |
| C | 0 | 10820 | 2 |
| D | 0 | 12237 | 2 |
| Mode M9 | |||
|---|---|---|---|
| Quadrant | BADHDUFLAG | Total packets | Discarded packets |
| A | 0 | 17 | 0 |
| B | 0 | 17 | 0 |
| C | 0 | 17 | 0 |
| D | 0 | 18 | 0 |
| Quadrant | Total seconds | Saturated seconds | Saturation percentage |
|---|---|---|---|
| A | 5354 | 311 | 5.808741% |
| B | 5354 | 50 | 0.933881% |
| C | 5354 | 4 | 0.074710% |
| D | 5354 | 96 | 1.793052% |
Noise dominated data is calculated using 1-second bins in cleaned event files. If a bin has >2000 counts, and if more than 50% of those come from <1% of pixels, then it is considered to be noise-dominated and hence unusable.
| Quadrant | # 1 sec bins | Bins with >0 counts | Bins with >2000 counts | High rate bins dominated by noise | Noise dominated (total time) | Noise dominated (detector-on time) | Marked lightcurve |
|---|---|---|---|---|---|---|---|
| A | 7027 | 5355 | 255 | 255 | 3.63% | 4.76% | 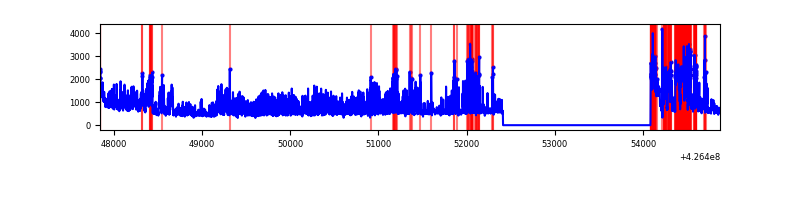 |
| B | 7027 | 5355 | 37 | 37 | 0.53% | 0.69% | 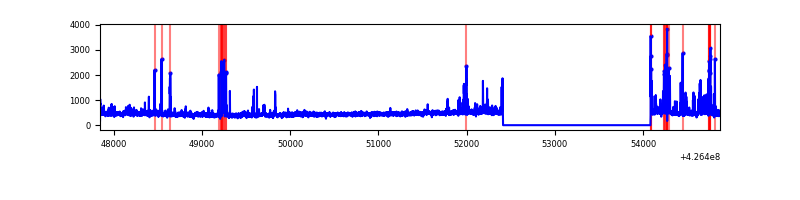 |
| C | 7027 | 5355 | 0 | 0 | 0.00% | 0.00% | 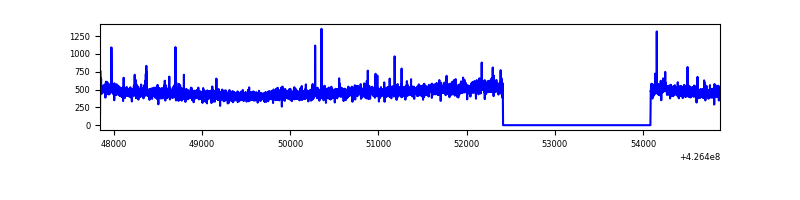 |
| D | 7027 | 5355 | 74 | 74 | 1.05% | 1.38% | 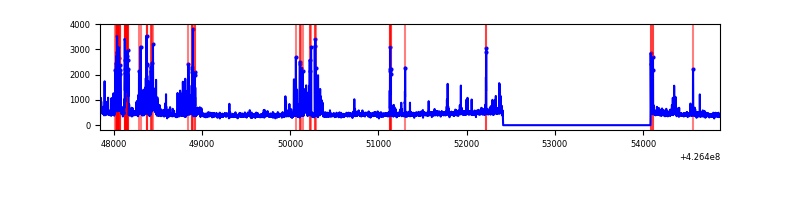 |
Top three noisy pixels from each quadrant. If the there are fewer than three noisy pixels in the level2.evt file, extra rows are filled as -1
| Pixel properties | Quadrant properties | ||||||
|---|---|---|---|---|---|---|---|
| Quadrant | DetID | PixID | Counts | Sigma | Mean | Median | Sigma |
| A | 15 | 223 | 1745150 | 14710.26 | 571 | 559 | 118.6 |
| A | 10 | 83 | 545075 | 4591.32 | 571 | 559 | 118.6 |
| A | 12 | 189 | 225949 | 1900.47 | 571 | 559 | 118.6 |
| B | 5 | 255 | 330225 | 2890.72 | 581 | 564 | 114.0 |
| B | 0 | 190 | 72590 | 631.58 | 581 | 564 | 114.0 |
| B | 12 | 111 | 14367 | 121.04 | 581 | 564 | 114.0 |
| C | 15 | 214 | 223353 | 1660.91 | 569 | 573 | 134.1 |
| C | 12 | 249 | 21090 | 152.96 | 569 | 573 | 134.1 |
| C | 0 | 207 | 4905 | 32.3 | 569 | 573 | 134.1 |
| D | 13 | 249 | 366722 | 2626.11 | 565 | 550 | 139.4 |
| D | 1 | 52 | 97814 | 697.56 | 565 | 550 | 139.4 |
| D | 10 | 199 | 47349 | 335.63 | 565 | 550 | 139.4 |
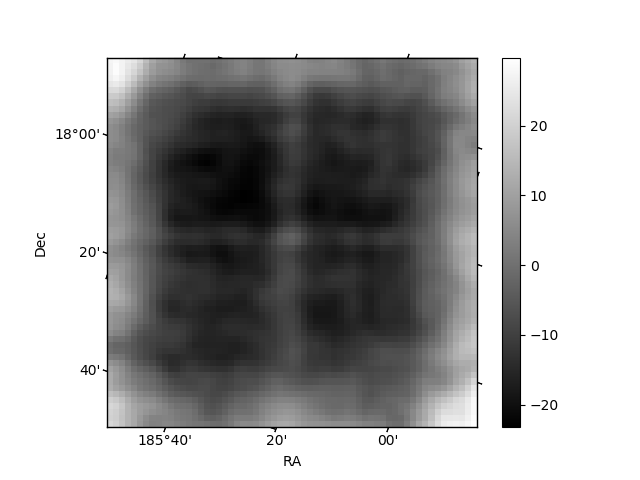
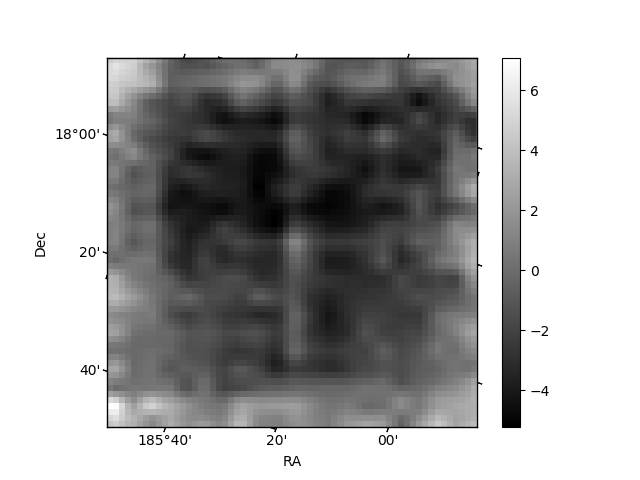
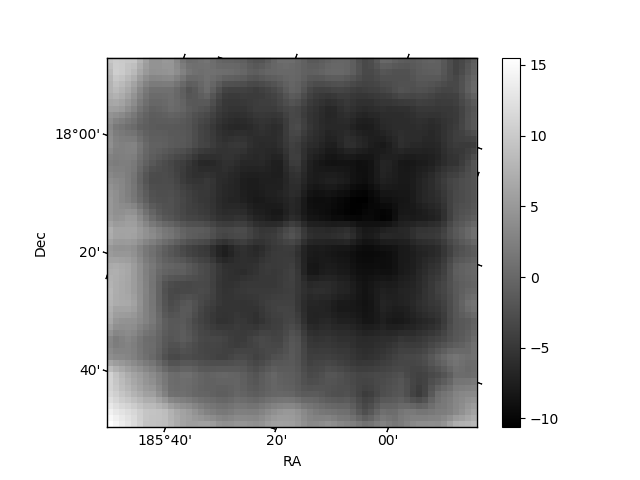
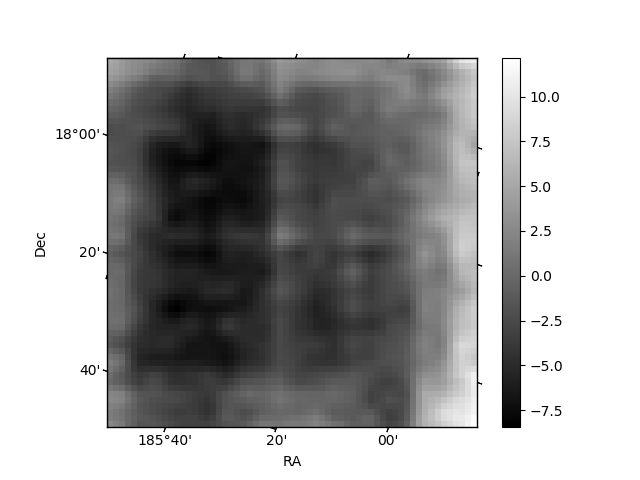
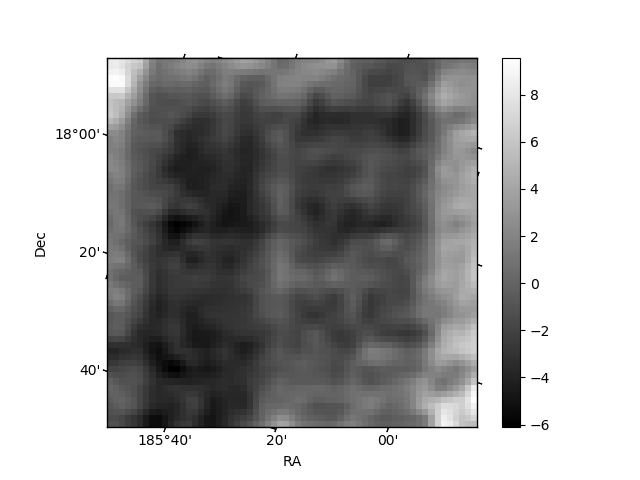
Histogram calculated using DETX and DETY for each event in the final _common_clean file
| Quadrant A | 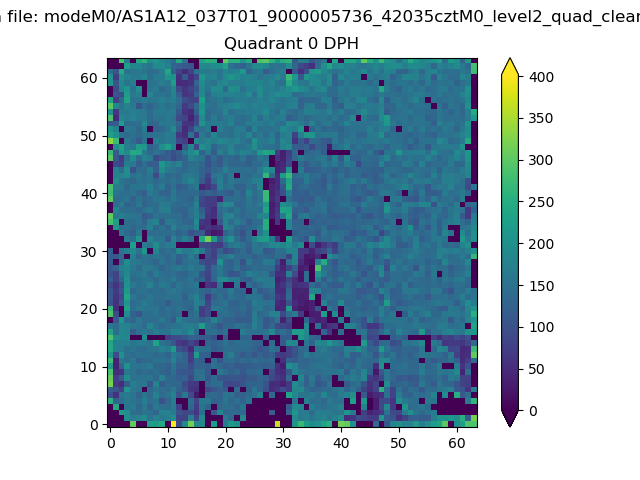 |
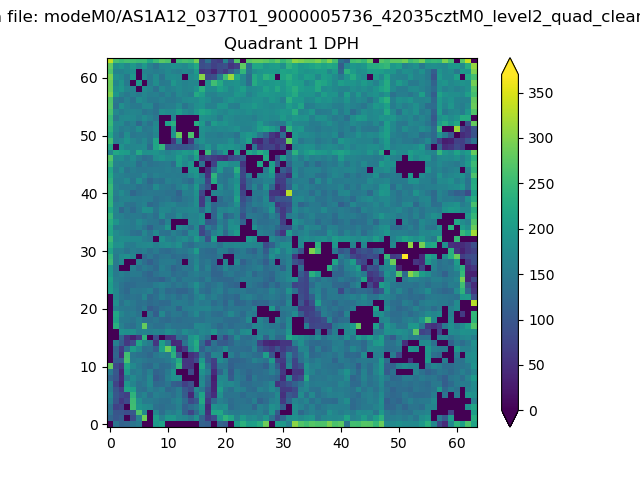 |
Quadrant B |
|---|---|---|---|
| Quadrant D | 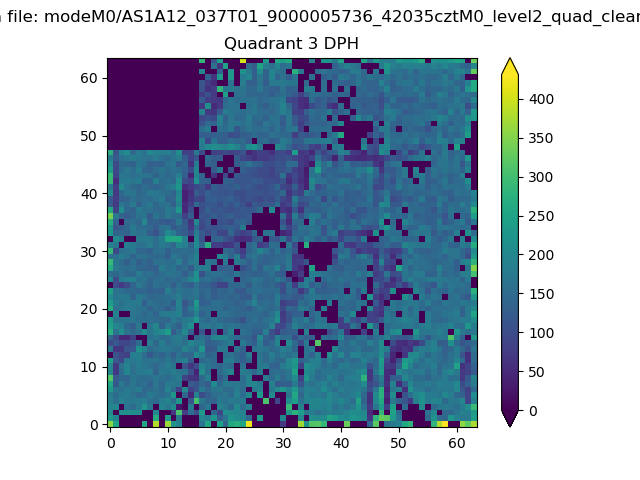 |
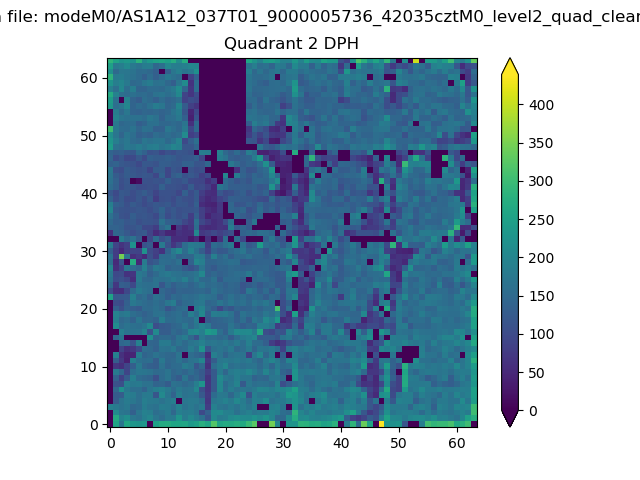 |
Quadrant C |
| Plot type | Count rate plots | Images |
|---|---|---|
| Comparison with Poisson distribution Blue bars denote a histogram of data divided into 1 sec bins. Red curve is a Poisson curve with rate = median count rate of data. |
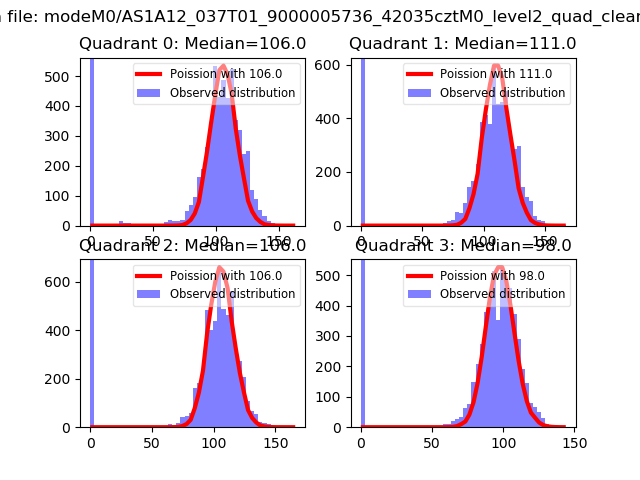 |
 |
| Quadrant-wise count rates Data is divided into 100 sec bins |
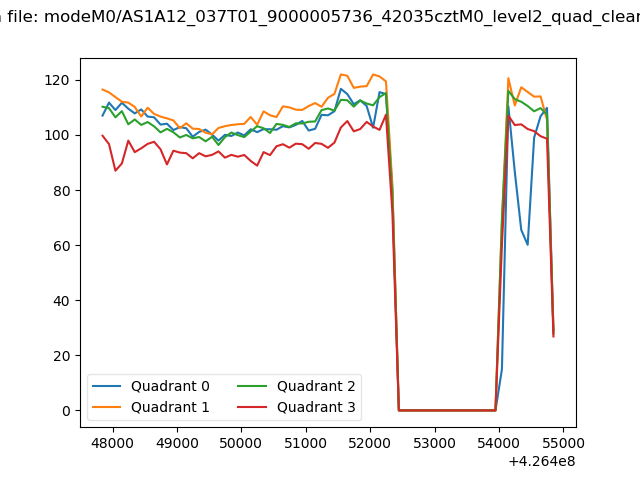 |
|
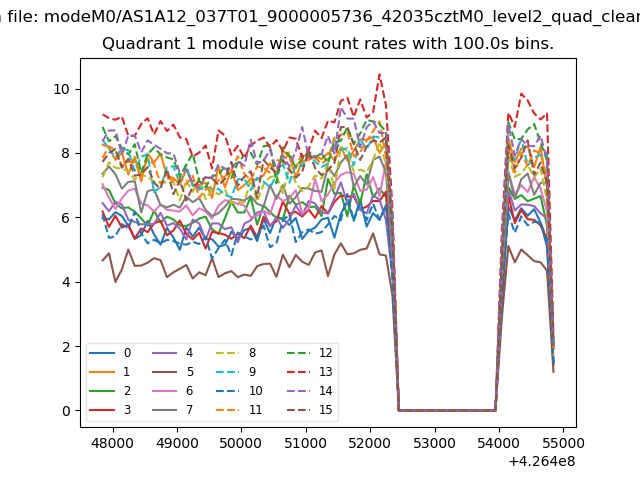
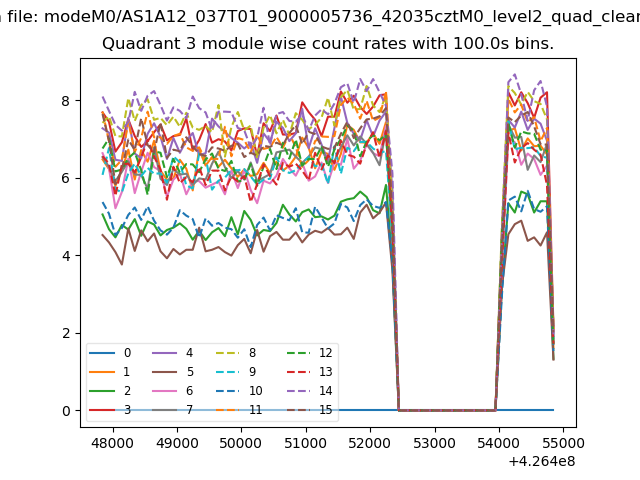
| Module-wise count rates for Quadrant A Data is divided into 100 sec bins |
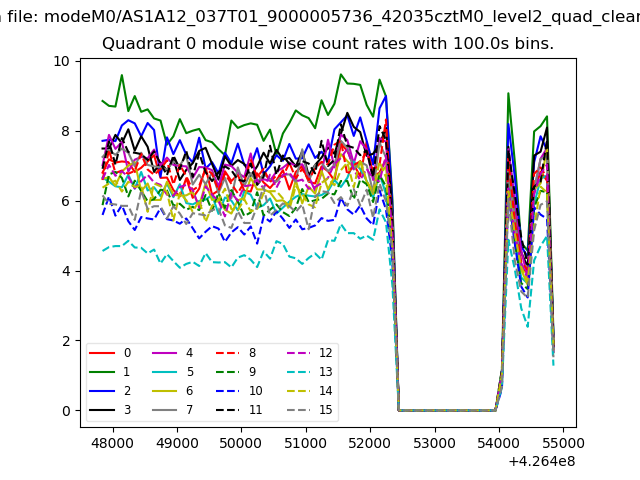 |
 |
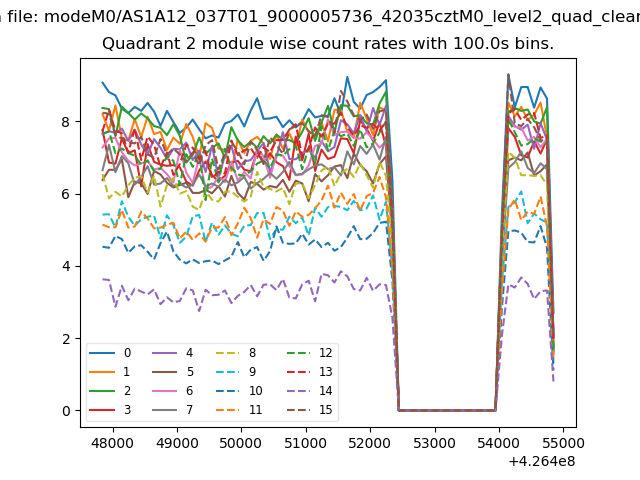
| Module-wise count rates for Quadrant B Data is divided into 100 sec bins |
 |
 |
| Module-wise count rates for Quadrant C Data is divided into 100 sec bins |
 |
 |
| Module-wise count rates for Quadrant D Data is divided into 100 sec bins |
 |
 |
| Parameter | Plot |
|---|---|
| CZT HV Monitor | 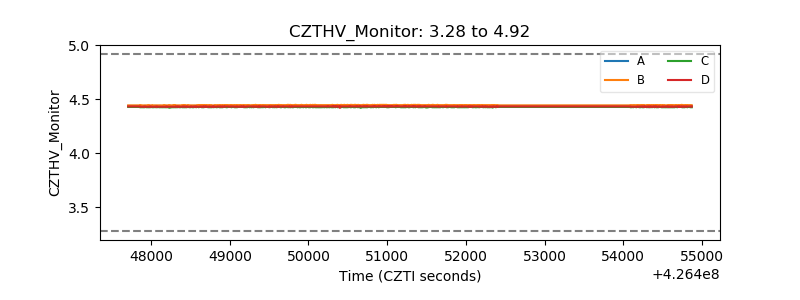 |
| D_VDD | 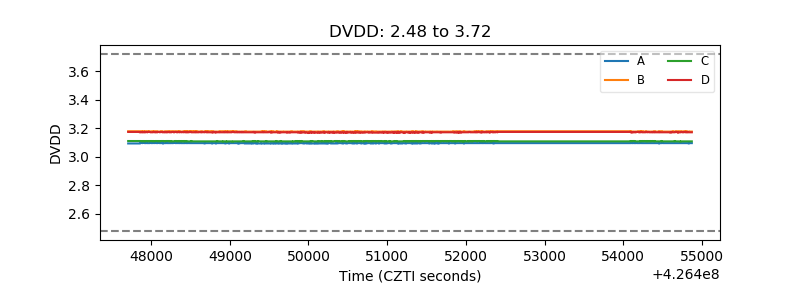 |
| Temperature 1 | 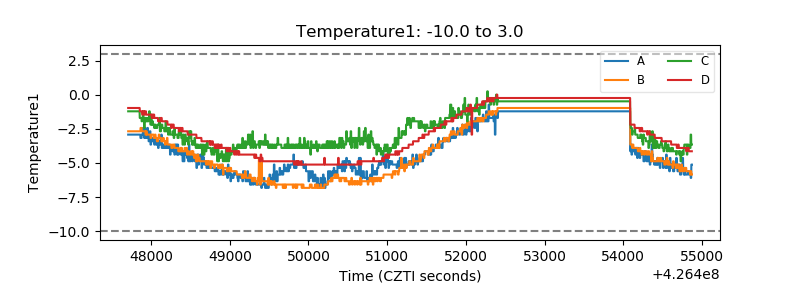 |
| Veto HV Monitor |  |
| Veto LLD | 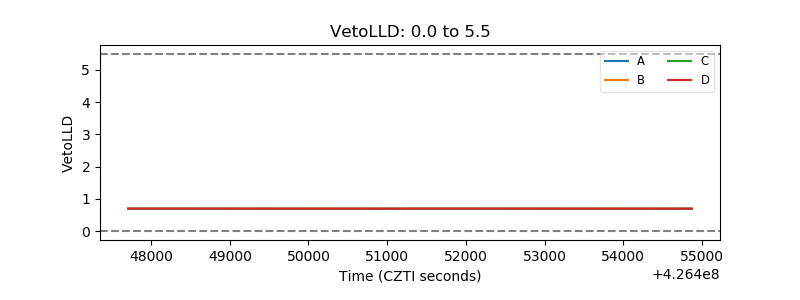 |
| Alpha Counter | 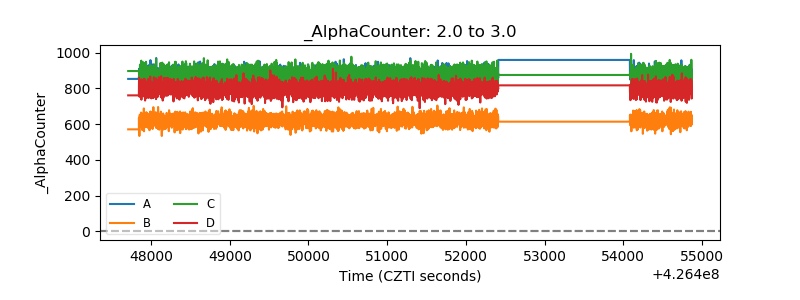 |
| _CPM_Rate | 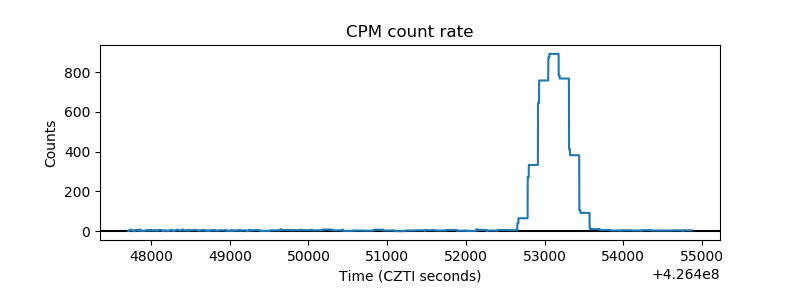 |
| CZT Counter | 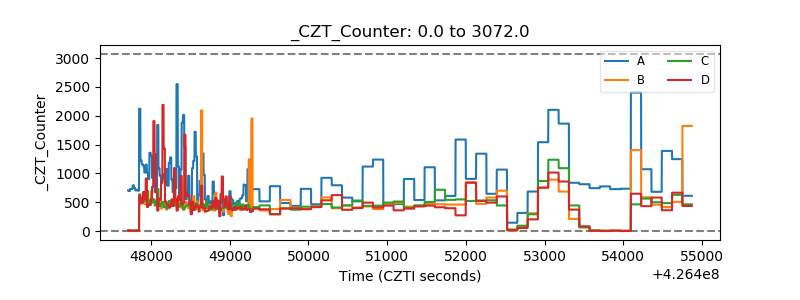 |
| +2.5 Volts monitor | 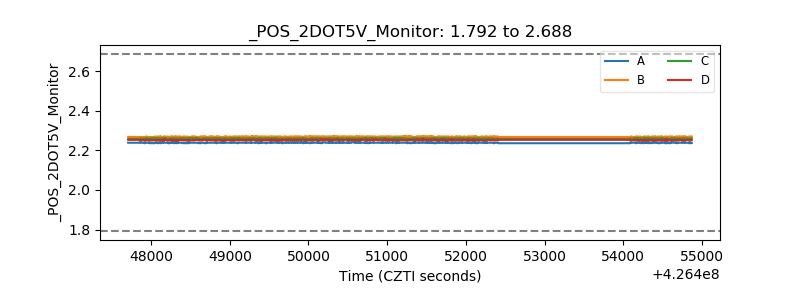 |
| +5 Volts monitor | 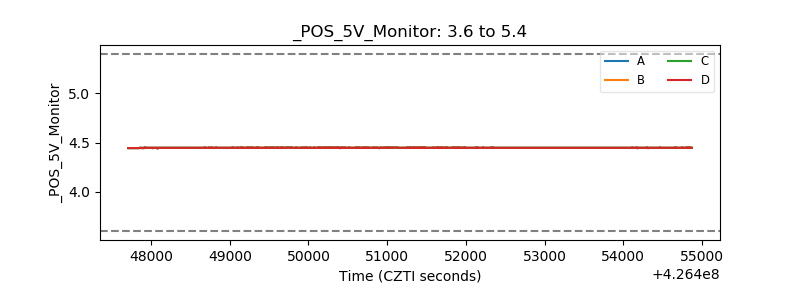 |
| _ROLL_ROT | 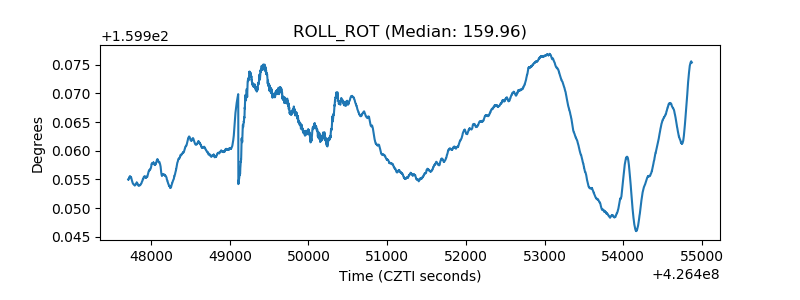 |
| _Roll_DEC | 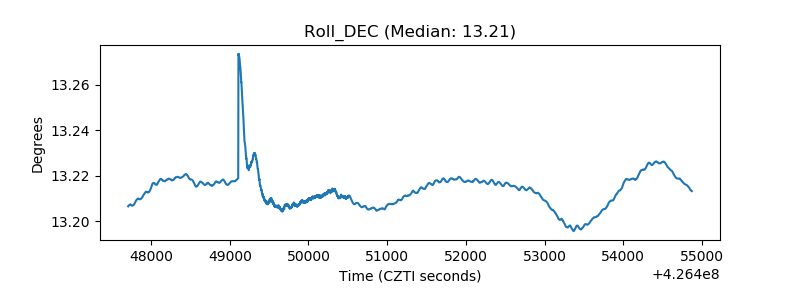 |
| _Roll_RA | 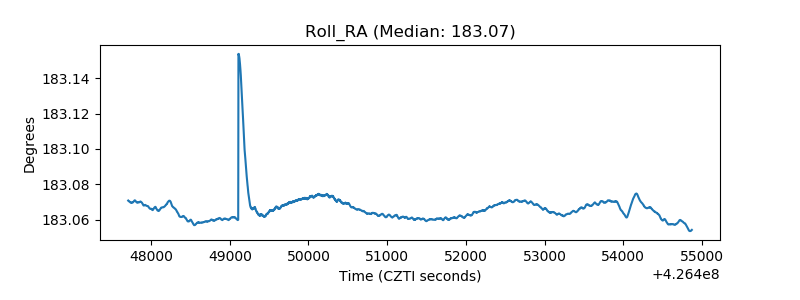 |
| Veto Counter | 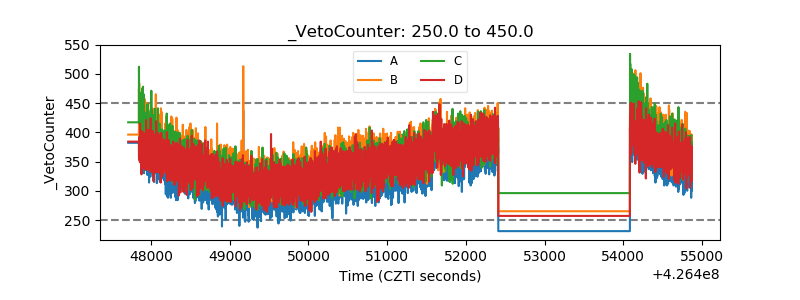 |