| Param | Original file | Final file |
|---|---|---|
| Filename | modeM0/AS1A12_037T01_9000005736_42037cztM0_level2.fits | modeM0/AS1A12_037T01_9000005736_42037cztM0_level2_quad_clean.evt |
| Size (bytes) | 324,103,680 | 85,792,320 |
| Size | 309.1 MB | 81.8 MB |
| Events in quadrant A | 3,938,060 | 554,739 |
| Events in quadrant B | 2,795,602 | 593,161 |
| Events in quadrant C | 2,455,516 | 565,016 |
| Events in quadrant D | 2,401,335 | 518,758 |
| Mode SS | |||
|---|---|---|---|
| Quadrant | BADHDUFLAG | Total packets | Discarded packets |
| A | 0 | 108 | 0 |
| B | 0 | 108 | 0 |
| C | 0 | 108 | 0 |
| D | 0 | 108 | 0 |
| Mode M0 | |||
|---|---|---|---|
| Quadrant | BADHDUFLAG | Total packets | Discarded packets |
| A | 0 | 14914 | 3 |
| B | 0 | 11836 | 2 |
| C | 0 | 10545 | 2 |
| D | 0 | 11061 | 2 |
| Mode M9 | |||
|---|---|---|---|
| Quadrant | BADHDUFLAG | Total packets | Discarded packets |
| A | 0 | 28 | 0 |
| B | 0 | 28 | 0 |
| C | 0 | 28 | 0 |
| D | 0 | 29 | 0 |
| Quadrant | Total seconds | Saturated seconds | Saturation percentage |
|---|---|---|---|
| A | 5219 | 276 | 5.288369% |
| B | 5219 | 85 | 1.628664% |
| C | 5219 | 4 | 0.076643% |
| D | 5219 | 42 | 0.804752% |
Noise dominated data is calculated using 1-second bins in cleaned event files. If a bin has >2000 counts, and if more than 50% of those come from <1% of pixels, then it is considered to be noise-dominated and hence unusable.
| Quadrant | # 1 sec bins | Bins with >0 counts | Bins with >2000 counts | High rate bins dominated by noise | Noise dominated (total time) | Noise dominated (detector-on time) | Marked lightcurve |
|---|---|---|---|---|---|---|---|
| A | 7041 | 5220 | 244 | 244 | 3.47% | 4.67% | 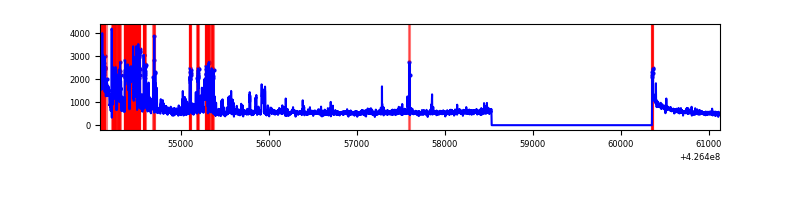 |
| B | 7041 | 5220 | 58 | 58 | 0.82% | 1.11% | 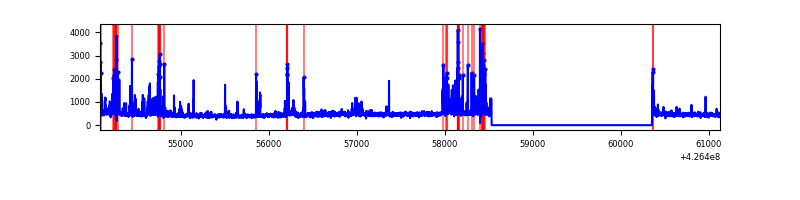 |
| C | 7041 | 5220 | 0 | 0 | 0.00% | 0.00% | 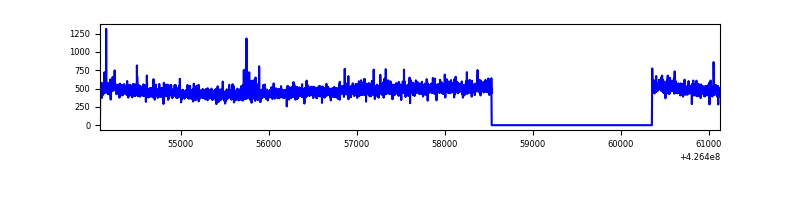 |
| D | 7041 | 5220 | 31 | 31 | 0.44% | 0.59% | 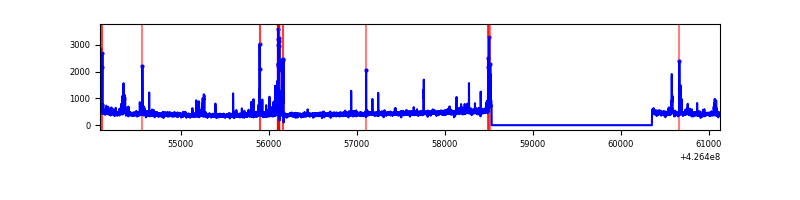 |
Top three noisy pixels from each quadrant. If the there are fewer than three noisy pixels in the level2.evt file, extra rows are filled as -1
| Pixel properties | Quadrant properties | ||||||
|---|---|---|---|---|---|---|---|
| Quadrant | DetID | PixID | Counts | Sigma | Mean | Median | Sigma |
| A | 15 | 223 | 1031943 | 8731.31 | 568 | 555 | 118.1 |
| A | 10 | 83 | 513385 | 4341.41 | 568 | 555 | 118.1 |
| A | 2 | 79 | 109280 | 920.42 | 568 | 555 | 118.1 |
| B | 5 | 255 | 395435 | 3539.32 | 574 | 558 | 111.6 |
| B | 5 | 32 | 66837 | 594.07 | 574 | 558 | 111.6 |
| B | 0 | 190 | 51888 | 460.08 | 574 | 558 | 111.6 |
| C | 15 | 214 | 220786 | 1646.89 | 564 | 567 | 133.7 |
| C | 12 | 249 | 13279 | 95.07 | 564 | 567 | 133.7 |
| C | 0 | 207 | 11408 | 81.07 | 564 | 567 | 133.7 |
| D | 13 | 249 | 103119 | 738.95 | 558 | 542 | 138.8 |
| D | 2 | 249 | 78500 | 561.6 | 558 | 542 | 138.8 |
| D | 12 | 6 | 30138 | 213.21 | 558 | 542 | 138.8 |
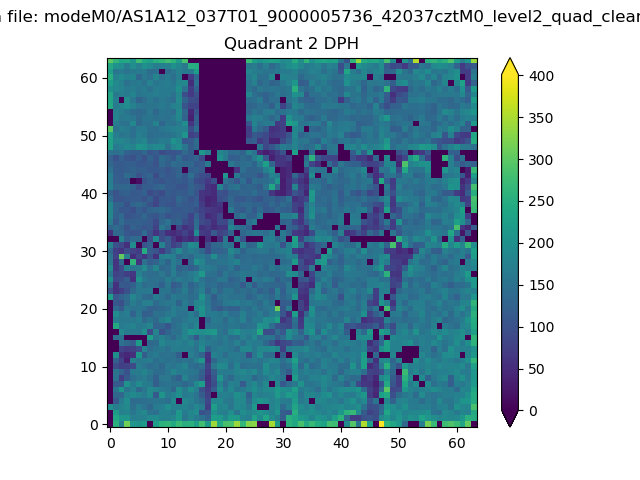
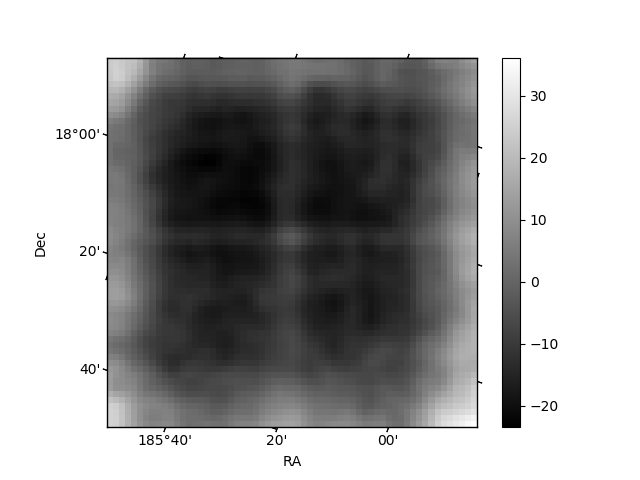
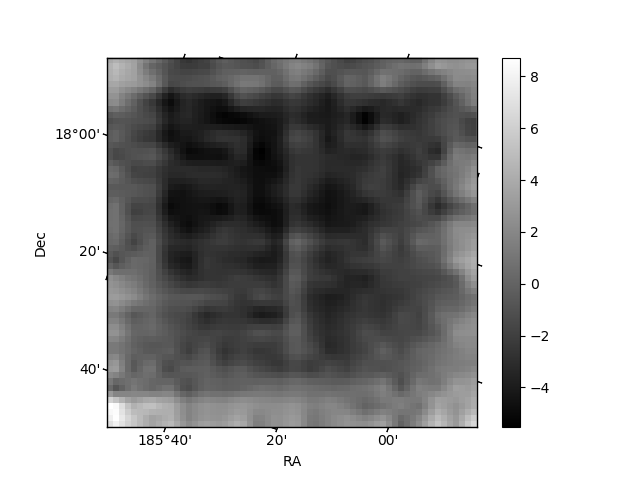
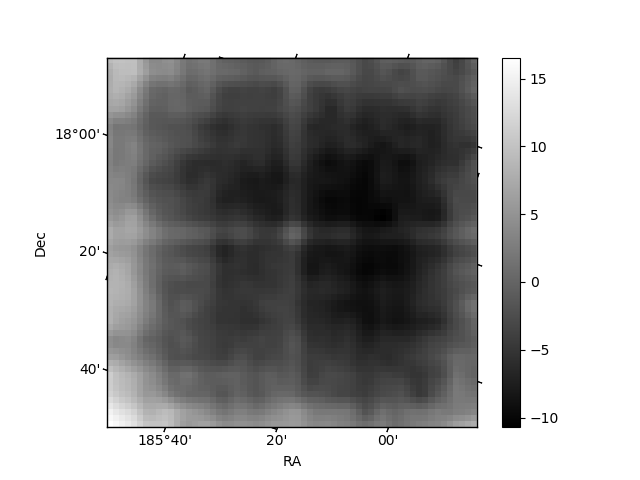
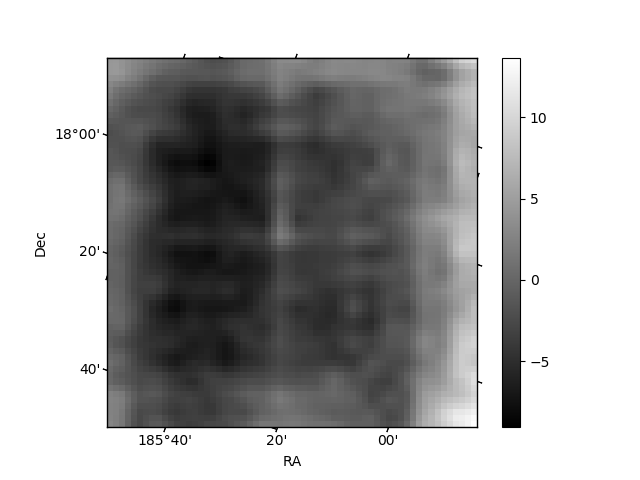
Histogram calculated using DETX and DETY for each event in the final _common_clean file
| Quadrant A | 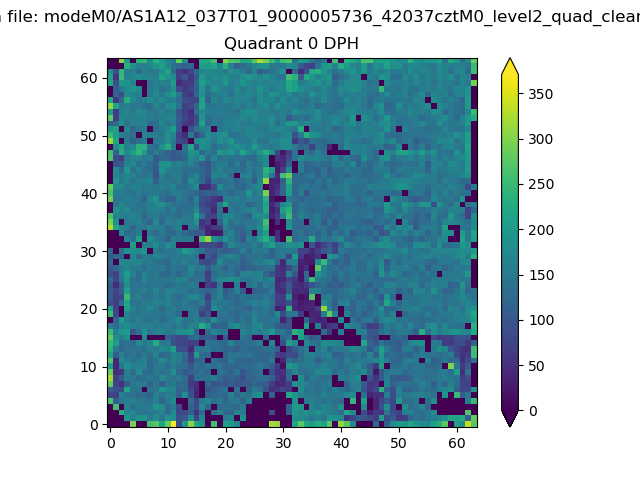 |
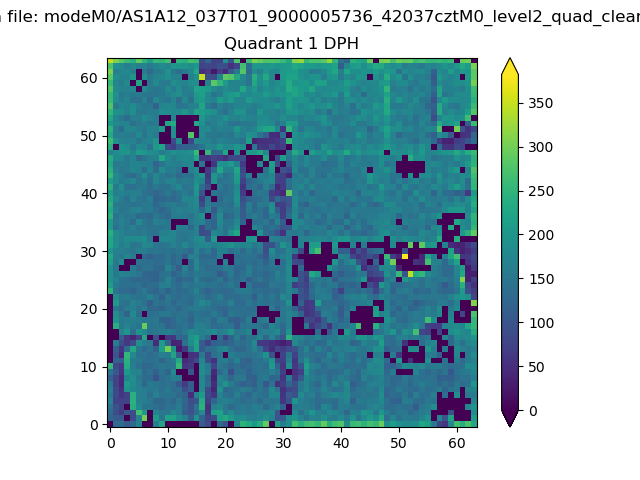 |
Quadrant B |
|---|---|---|---|
| Quadrant D | 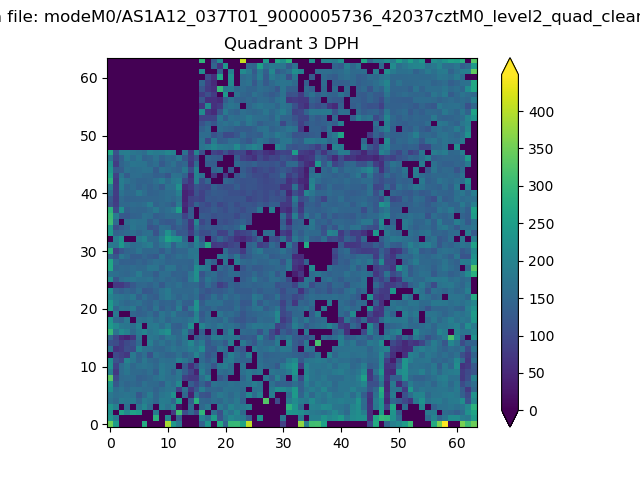 |
 |
Quadrant C |
| Plot type | Count rate plots | Images |
|---|---|---|
| Comparison with Poisson distribution Blue bars denote a histogram of data divided into 1 sec bins. Red curve is a Poisson curve with rate = median count rate of data. |
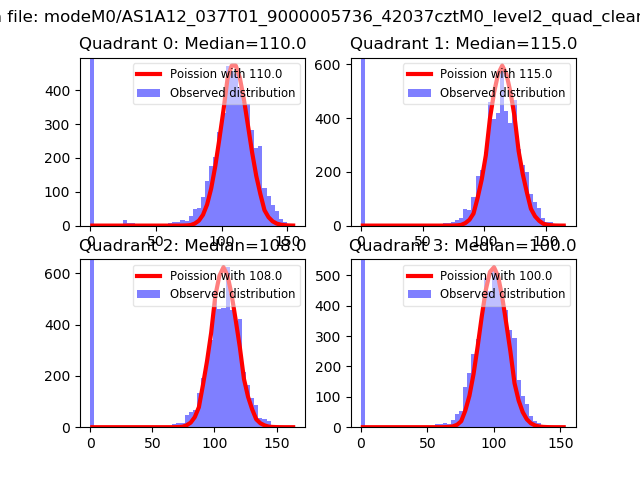 |
 |
| Quadrant-wise count rates Data is divided into 100 sec bins |
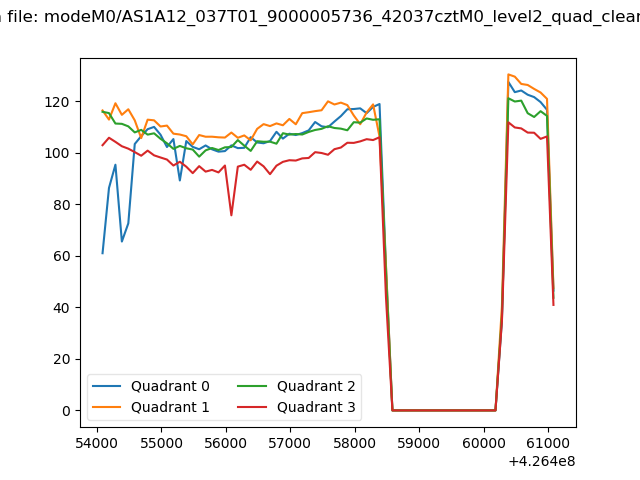 |
|
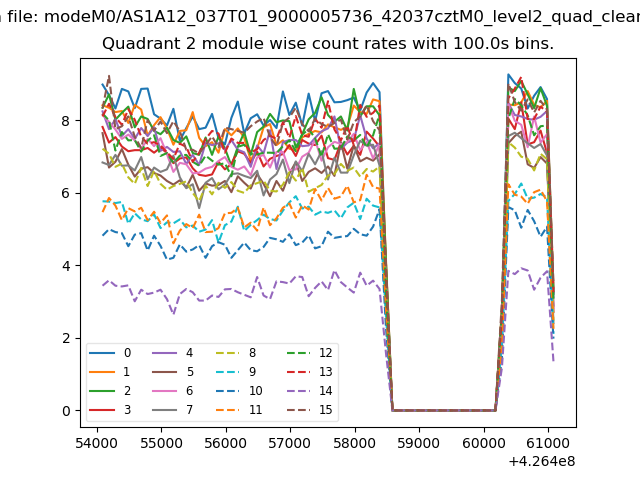
| Module-wise count rates for Quadrant A Data is divided into 100 sec bins |
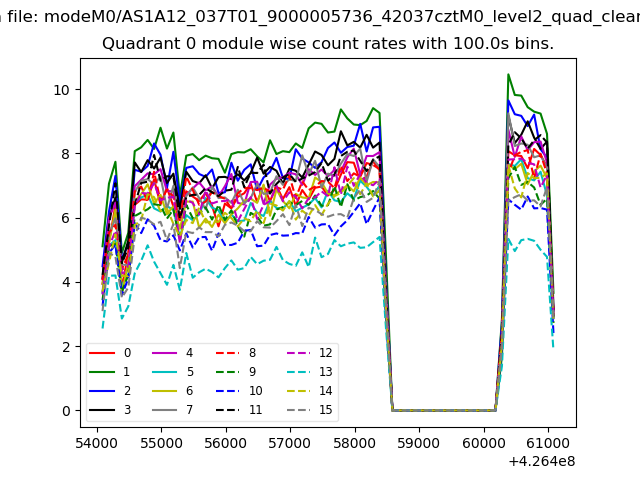 |
 |
| Module-wise count rates for Quadrant B Data is divided into 100 sec bins |
 |
 |
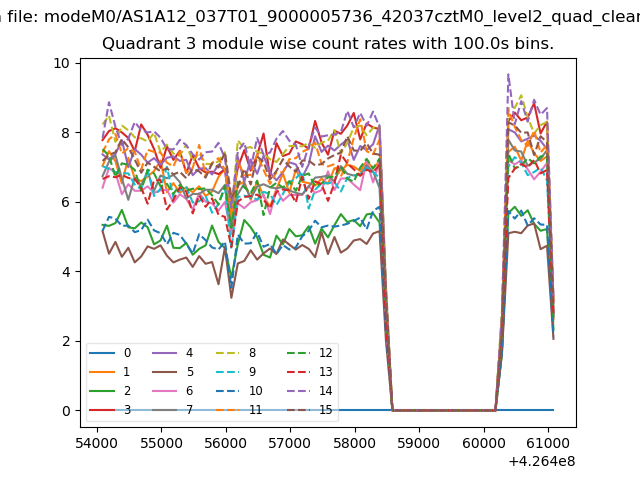
| Module-wise count rates for Quadrant C Data is divided into 100 sec bins |
 |
 |
| Module-wise count rates for Quadrant D Data is divided into 100 sec bins |
 |
 |
| Parameter | Plot |
|---|---|
| CZT HV Monitor |  |
| D_VDD | 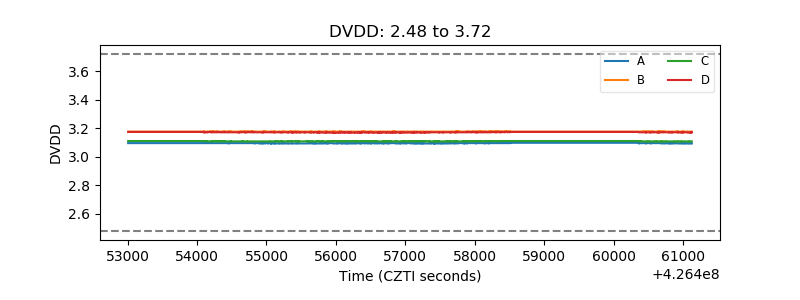 |
| Temperature 1 | 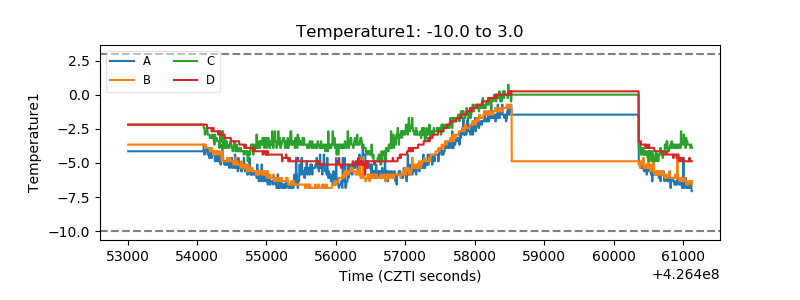 |
| Veto HV Monitor |  |
| Veto LLD | 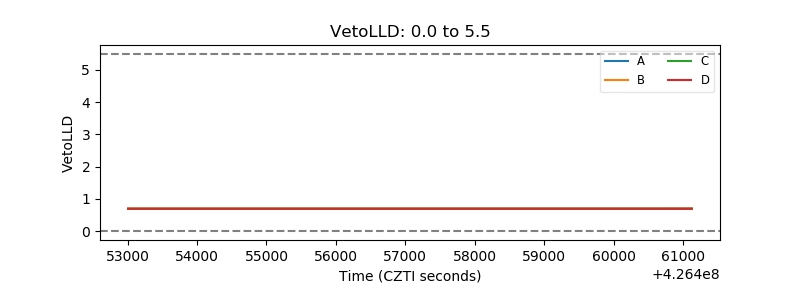 |
| Alpha Counter | 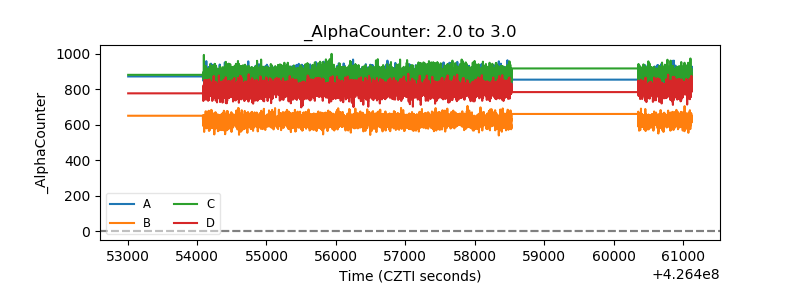 |
| _CPM_Rate |  |
| CZT Counter | 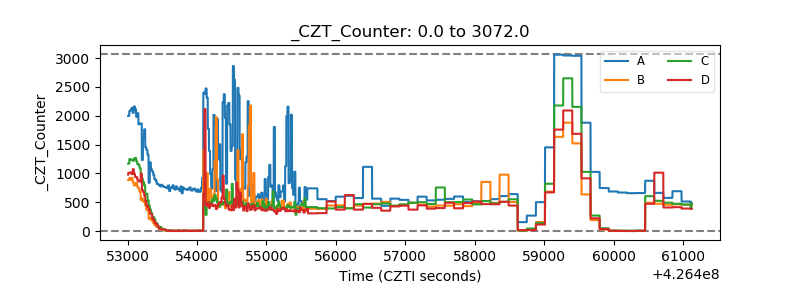 |
| +2.5 Volts monitor | 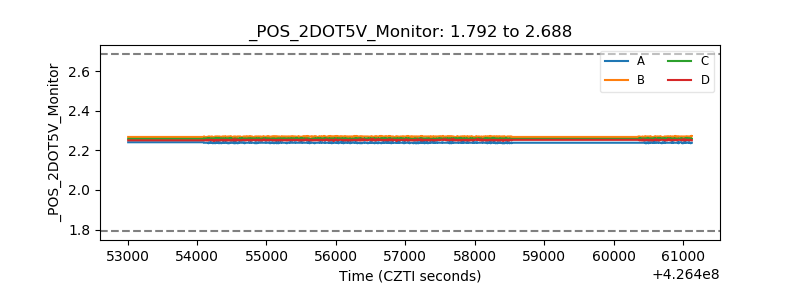 |
| +5 Volts monitor |  |
| _ROLL_ROT | 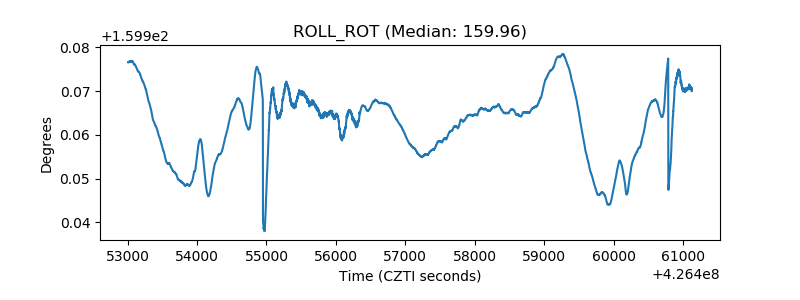 |
| _Roll_DEC | 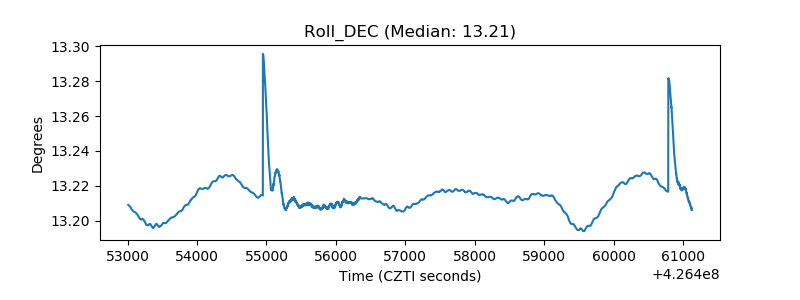 |
| _Roll_RA | 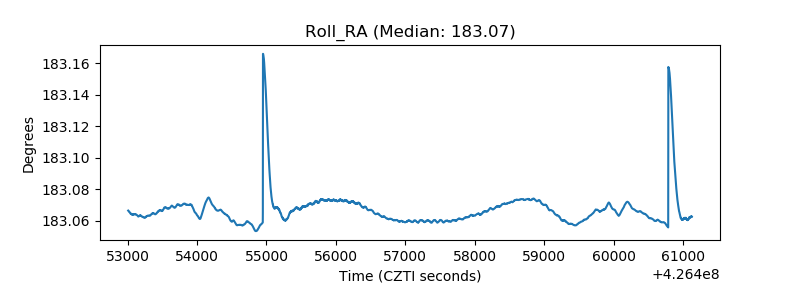 |
| Veto Counter | 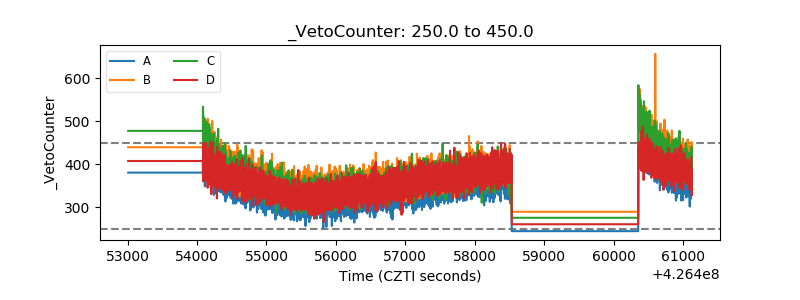 |