| Param | Original file | Final file |
|---|---|---|
| Filename | modeM0/AS1A12_037T01_9000005736_42038cztM0_level2.fits | modeM0/AS1A12_037T01_9000005736_42038cztM0_level2_quad_clean.evt |
| Size (bytes) | 288,984,960 | 87,059,520 |
| Size | 275.6 MB | 83.0 MB |
| Events in quadrant A | 2,942,115 | 588,322 |
| Events in quadrant B | 2,458,015 | 605,826 |
| Events in quadrant C | 2,520,264 | 567,506 |
| Events in quadrant D | 2,383,722 | 521,429 |
| Mode SS | |||
|---|---|---|---|
| Quadrant | BADHDUFLAG | Total packets | Discarded packets |
| A | 0 | 102 | 0 |
| B | 0 | 102 | 0 |
| C | 0 | 102 | 0 |
| D | 0 | 102 | 0 |
| Mode M0 | |||
|---|---|---|---|
| Quadrant | BADHDUFLAG | Total packets | Discarded packets |
| A | 0 | 11870 | 3 |
| B | 0 | 10565 | 2 |
| C | 0 | 10481 | 2 |
| D | 0 | 10624 | 2 |
| Mode M9 | |||
|---|---|---|---|
| Quadrant | BADHDUFLAG | Total packets | Discarded packets |
| A | 0 | 29 | 0 |
| B | 0 | 29 | 0 |
| C | 0 | 29 | 0 |
| D | 0 | 30 | 0 |
| Quadrant | Total seconds | Saturated seconds | Saturation percentage |
|---|---|---|---|
| A | 5041 | 22 | 0.436421% |
| B | 5041 | 18 | 0.357072% |
| C | 5041 | 6 | 0.119024% |
| D | 5041 | 9 | 0.178536% |
Noise dominated data is calculated using 1-second bins in cleaned event files. If a bin has >2000 counts, and if more than 50% of those come from <1% of pixels, then it is considered to be noise-dominated and hence unusable.
| Quadrant | # 1 sec bins | Bins with >0 counts | Bins with >2000 counts | High rate bins dominated by noise | Noise dominated (total time) | Noise dominated (detector-on time) | Marked lightcurve |
|---|---|---|---|---|---|---|---|
| A | 6983 | 5042 | 19 | 19 | 0.27% | 0.38% | 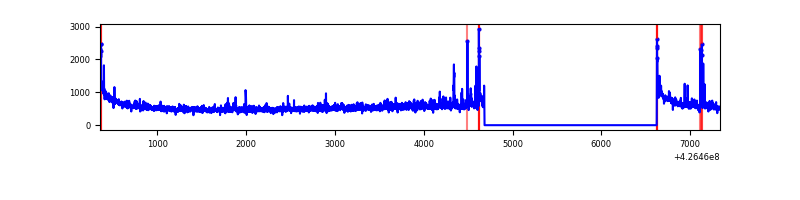 |
| B | 6983 | 5042 | 10 | 10 | 0.14% | 0.20% | 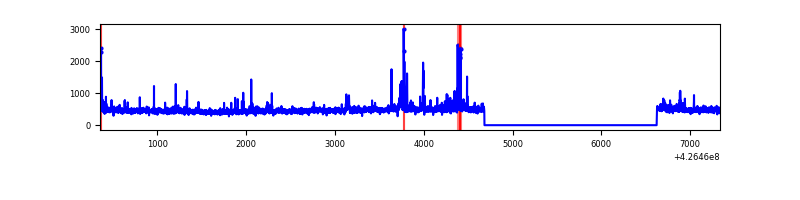 |
| C | 6983 | 5042 | 2 | 2 | 0.03% | 0.04% | 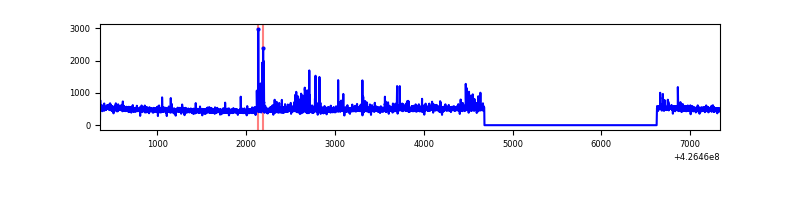 |
| D | 6983 | 5042 | 8 | 8 | 0.11% | 0.16% | 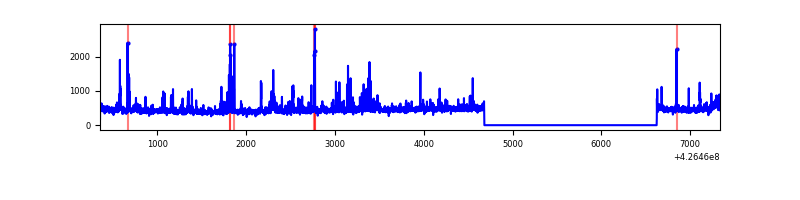 |
Top three noisy pixels from each quadrant. If the there are fewer than three noisy pixels in the level2.evt file, extra rows are filled as -1
| Pixel properties | Quadrant properties | ||||||
|---|---|---|---|---|---|---|---|
| Quadrant | DetID | PixID | Counts | Sigma | Mean | Median | Sigma |
| A | 10 | 83 | 507037 | 4252.21 | 575 | 565 | 119.1 |
| A | 12 | 189 | 115180 | 962.28 | 575 | 565 | 119.1 |
| A | 2 | 79 | 58802 | 488.94 | 575 | 565 | 119.1 |
| B | 5 | 255 | 128322 | 1141.85 | 577 | 561 | 111.9 |
| B | 0 | 190 | 32234 | 283.07 | 577 | 561 | 111.9 |
| B | 12 | 111 | 14357 | 123.3 | 577 | 561 | 111.9 |
| C | 15 | 214 | 212506 | 1602.26 | 562 | 566 | 132.3 |
| C | 8 | 79 | 76948 | 577.45 | 562 | 566 | 132.3 |
| C | 12 | 249 | 34136 | 253.79 | 562 | 566 | 132.3 |
| D | 2 | 249 | 93850 | 676.96 | 555 | 540 | 137.8 |
| D | 12 | 6 | 64426 | 463.49 | 555 | 540 | 137.8 |
| D | 1 | 52 | 36933 | 264.03 | 555 | 540 | 137.8 |
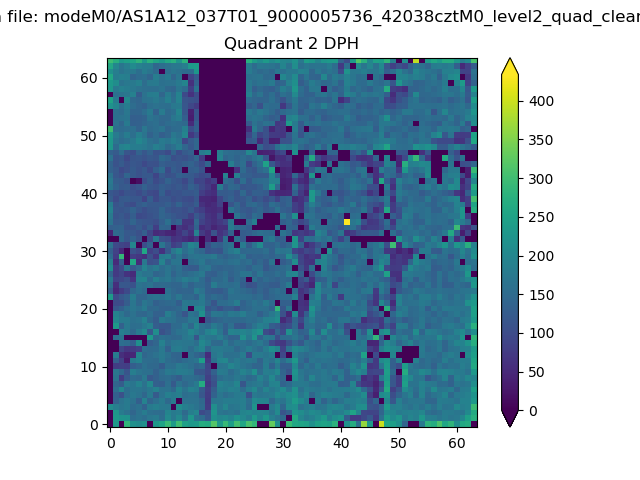
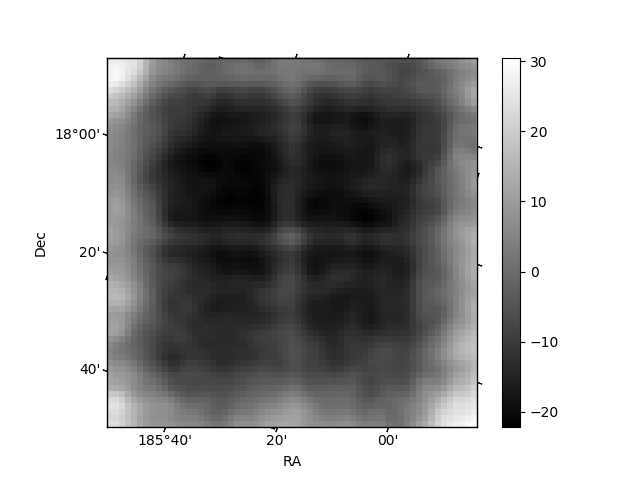
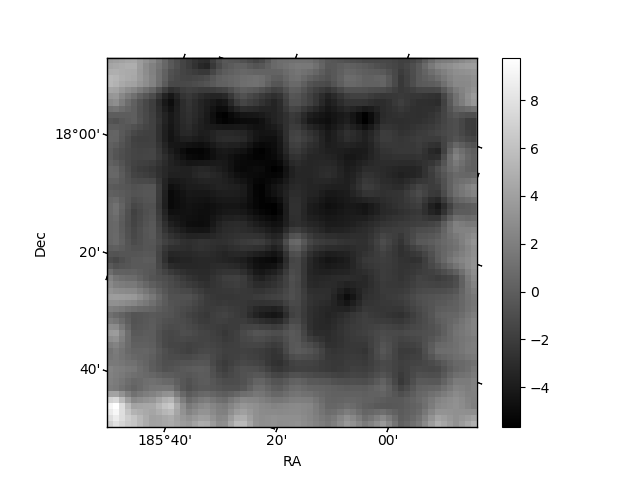
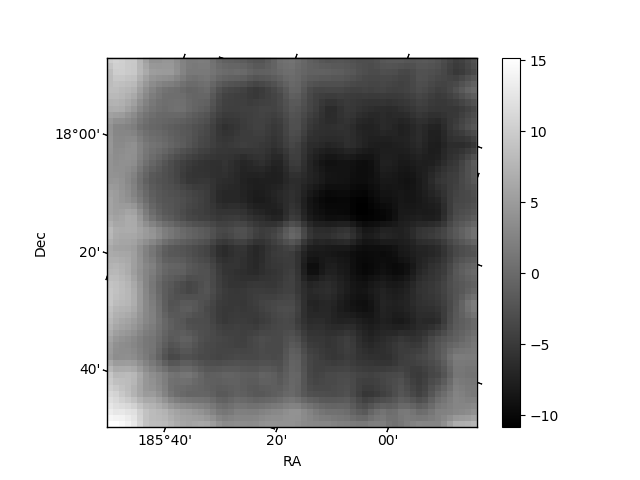
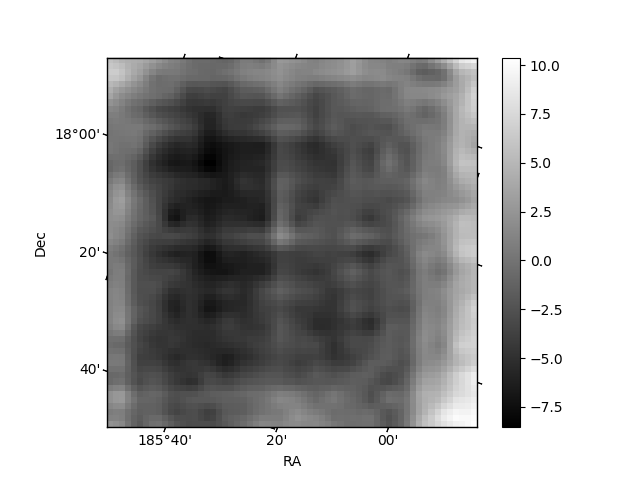
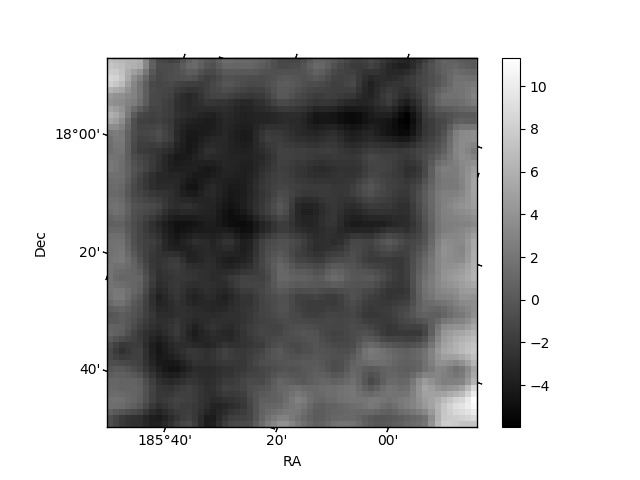
Histogram calculated using DETX and DETY for each event in the final _common_clean file
| Quadrant A | 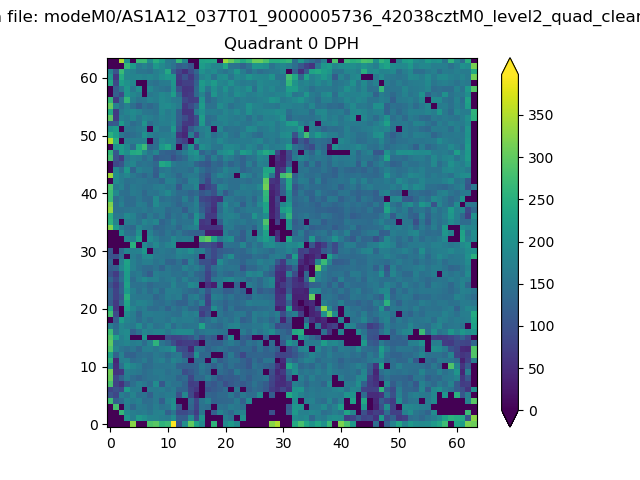 |
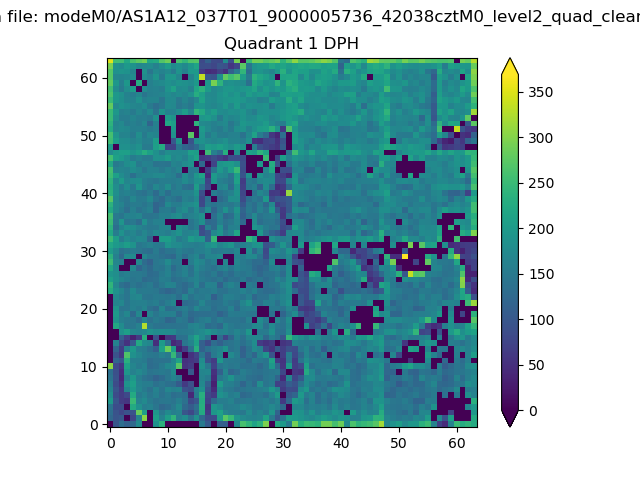 |
Quadrant B |
|---|---|---|---|
| Quadrant D | 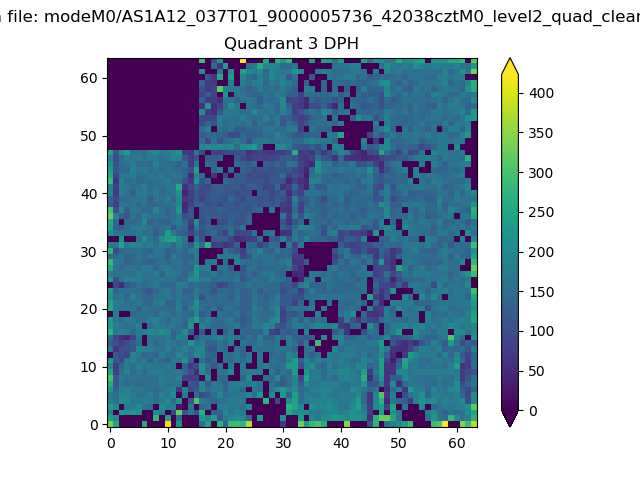 |
 |
Quadrant C |
| Plot type | Count rate plots | Images |
|---|---|---|
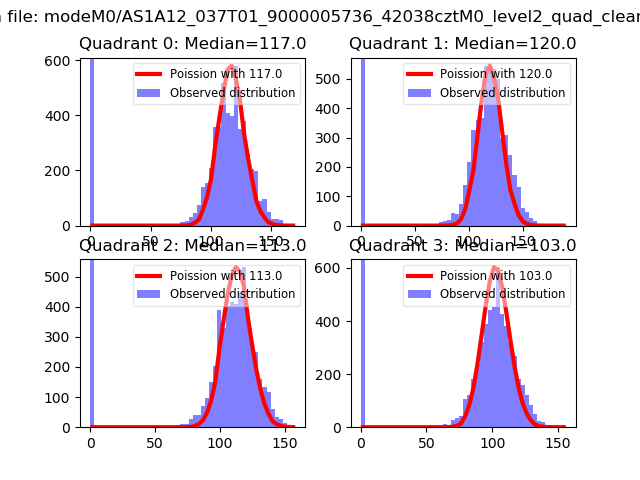
| Comparison with Poisson distribution Blue bars denote a histogram of data divided into 1 sec bins. Red curve is a Poisson curve with rate = median count rate of data. |
 |
 |
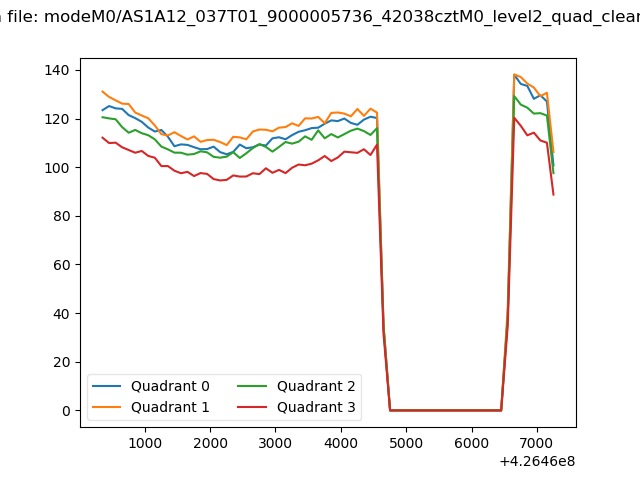
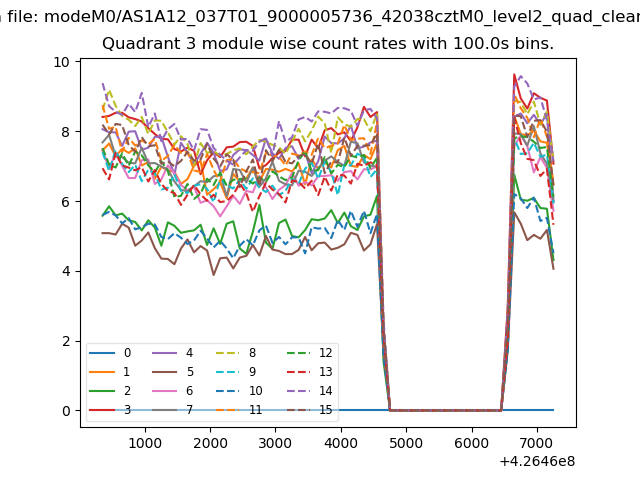
| Quadrant-wise count rates Data is divided into 100 sec bins |
 |
|
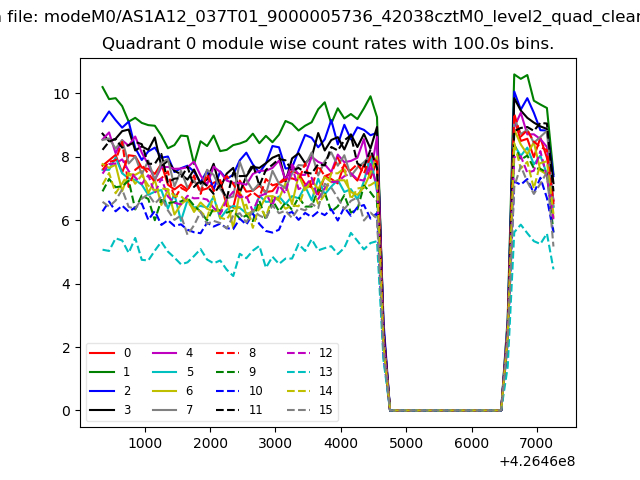
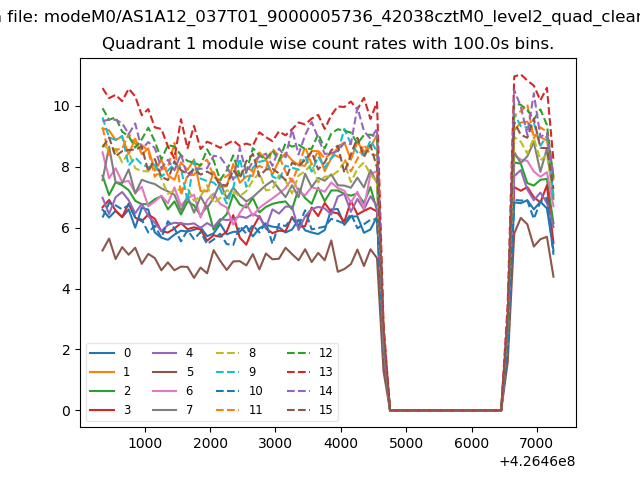
| Module-wise count rates for Quadrant A Data is divided into 100 sec bins |
 |
 |
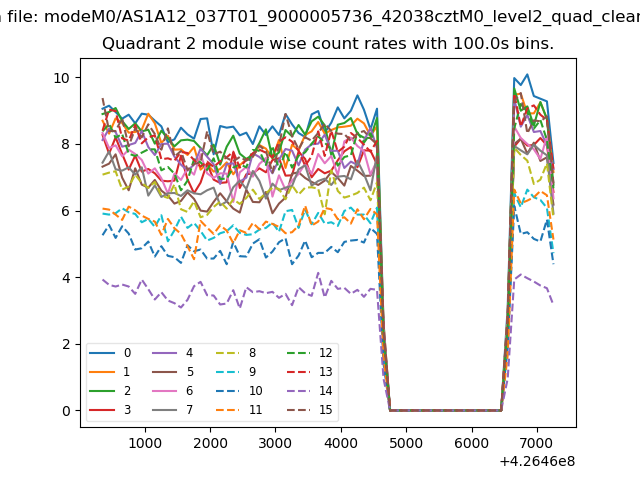
| Module-wise count rates for Quadrant B Data is divided into 100 sec bins |
 |
 |
| Module-wise count rates for Quadrant C Data is divided into 100 sec bins |
 |
 |
| Module-wise count rates for Quadrant D Data is divided into 100 sec bins |
 |
 |
| Parameter | Plot |
|---|---|
| CZT HV Monitor | 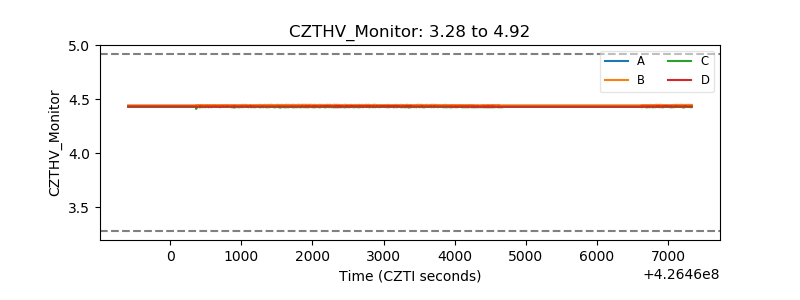 |
| D_VDD | 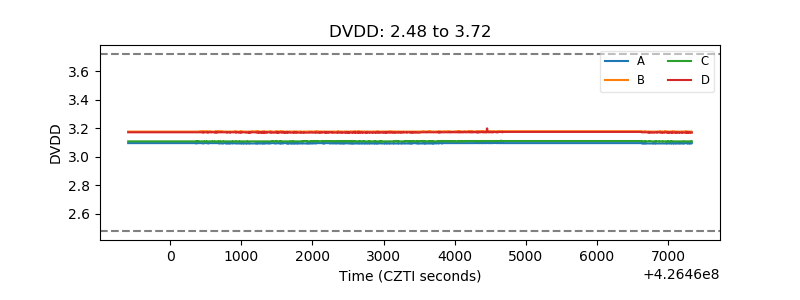 |
| Temperature 1 | 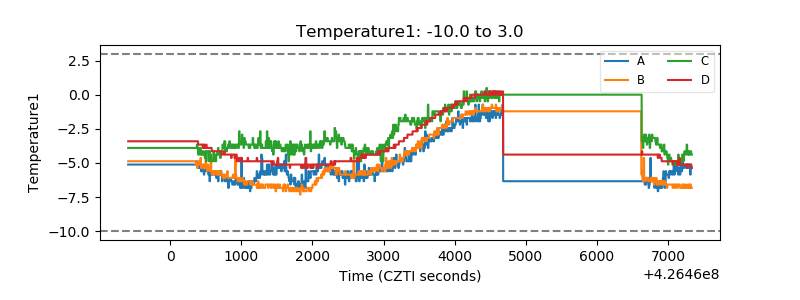 |
| Veto HV Monitor | 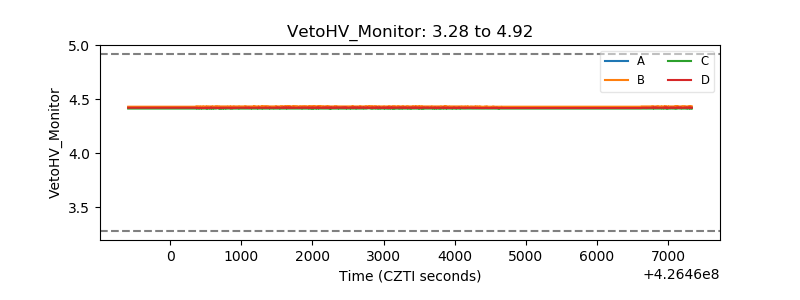 |
| Veto LLD | 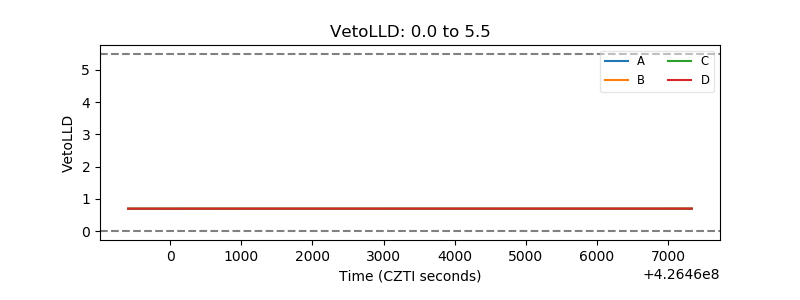 |
| Alpha Counter | 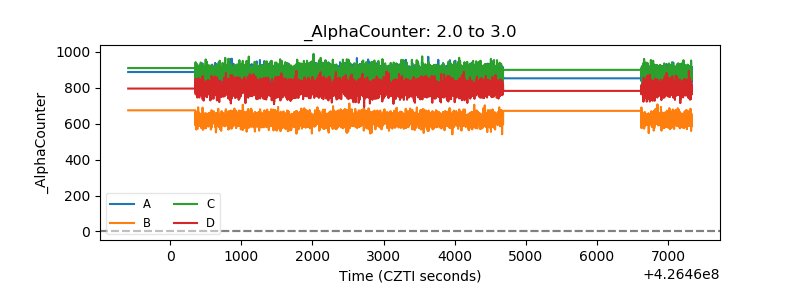 |
| _CPM_Rate | 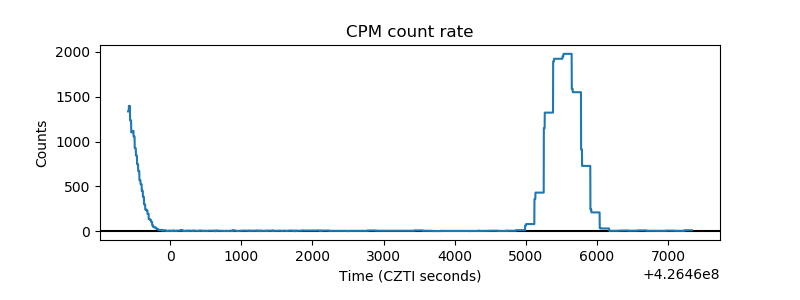 |
| CZT Counter | 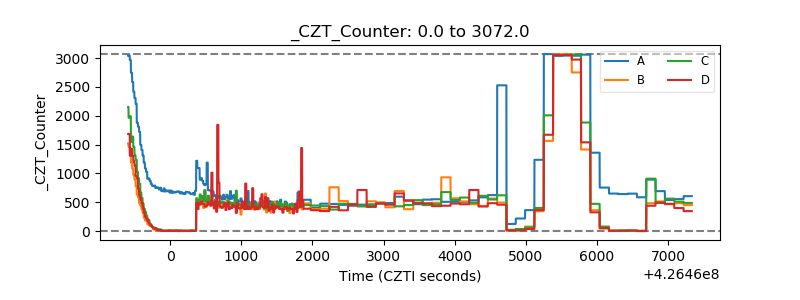 |
| +2.5 Volts monitor |  |
| +5 Volts monitor | 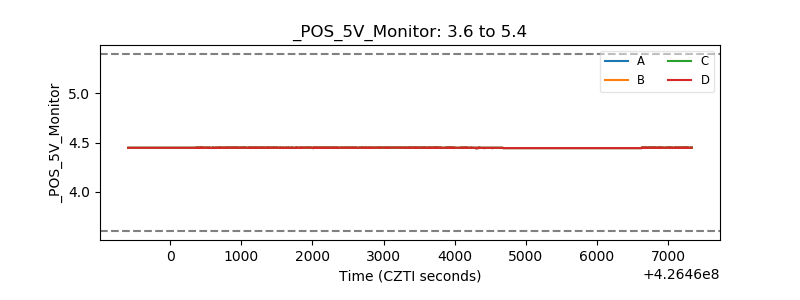 |
| _ROLL_ROT | 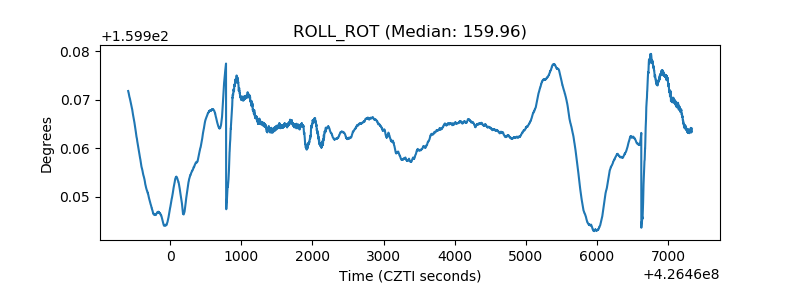 |
| _Roll_DEC | 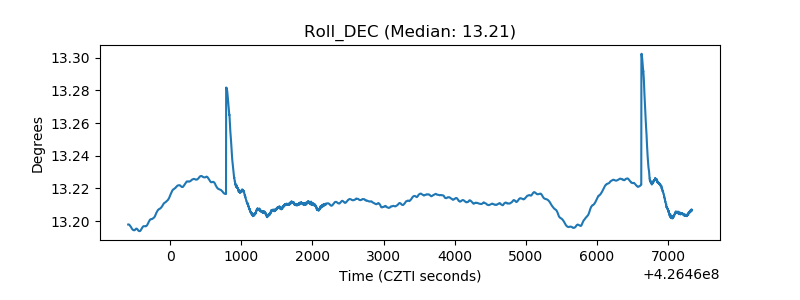 |
| _Roll_RA |  |
| Veto Counter | 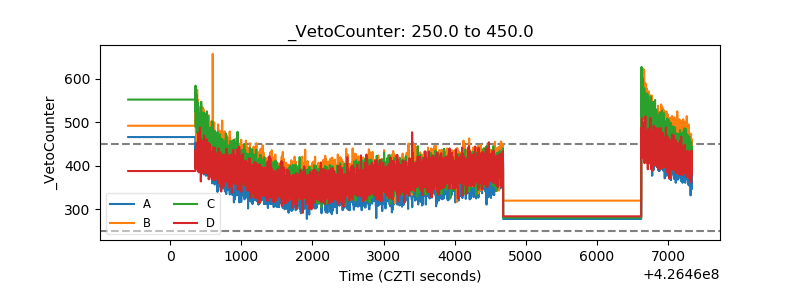 |