| Param | Original file | Final file |
|---|---|---|
| Filename | modeM0/AS1A12_037T01_9000005736_42039cztM0_level2.fits | modeM0/AS1A12_037T01_9000005736_42039cztM0_level2_quad_clean.evt |
| Size (bytes) | 322,119,360 | 93,571,200 |
| Size | 307.2 MB | 89.2 MB |
| Events in quadrant A | 3,055,977 | 638,063 |
| Events in quadrant B | 2,684,213 | 658,230 |
| Events in quadrant C | 2,706,631 | 616,216 |
| Events in quadrant D | 3,066,907 | 552,279 |
| Mode SS | |||
|---|---|---|---|
| Quadrant | BADHDUFLAG | Total packets | Discarded packets |
| A | 0 | 108 | 0 |
| B | 0 | 108 | 0 |
| C | 0 | 108 | 0 |
| D | 0 | 108 | 0 |
| Mode M0 | |||
|---|---|---|---|
| Quadrant | BADHDUFLAG | Total packets | Discarded packets |
| A | 0 | 12235 | 3 |
| B | 0 | 11230 | 2 |
| C | 0 | 11083 | 2 |
| D | 0 | 12670 | 2 |
| Mode M9 | |||
|---|---|---|---|
| Quadrant | BADHDUFLAG | Total packets | Discarded packets |
| A | 0 | 36 | 0 |
| B | 0 | 36 | 0 |
| C | 0 | 36 | 0 |
| D | 0 | 37 | 0 |
| Quadrant | Total seconds | Saturated seconds | Saturation percentage |
|---|---|---|---|
| A | 5262 | 12 | 0.228050% |
| B | 5262 | 40 | 0.760167% |
| C | 5262 | 7 | 0.133029% |
| D | 5262 | 140 | 2.660585% |
Noise dominated data is calculated using 1-second bins in cleaned event files. If a bin has >2000 counts, and if more than 50% of those come from <1% of pixels, then it is considered to be noise-dominated and hence unusable.
| Quadrant | # 1 sec bins | Bins with >0 counts | Bins with >2000 counts | High rate bins dominated by noise | Noise dominated (total time) | Noise dominated (detector-on time) | Marked lightcurve |
|---|---|---|---|---|---|---|---|
| A | 7325 | 5263 | 10 | 10 | 0.14% | 0.19% | 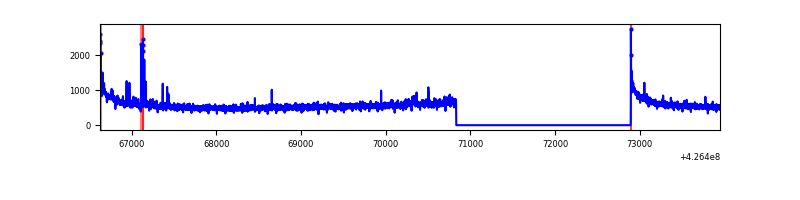 |
| B | 7325 | 5263 | 25 | 25 | 0.34% | 0.48% | 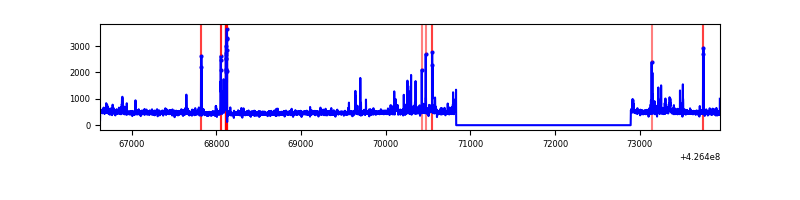 |
| C | 7325 | 5263 | 2 | 2 | 0.03% | 0.04% | 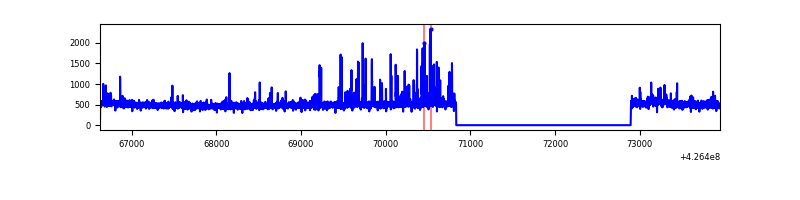 |
| D | 7325 | 5263 | 121 | 121 | 1.65% | 2.30% | 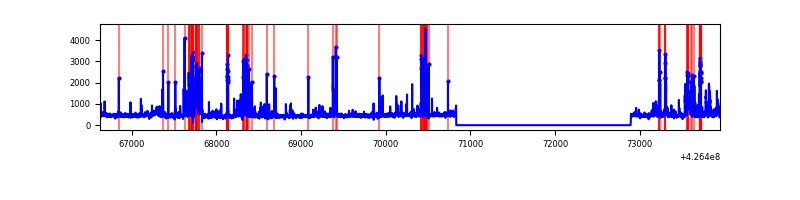 |
Top three noisy pixels from each quadrant. If the there are fewer than three noisy pixels in the level2.evt file, extra rows are filled as -1
| Pixel properties | Quadrant properties | ||||||
|---|---|---|---|---|---|---|---|
| Quadrant | DetID | PixID | Counts | Sigma | Mean | Median | Sigma |
| A | 10 | 83 | 532172 | 4193.05 | 619 | 608 | 126.8 |
| A | 12 | 189 | 61853 | 483.11 | 619 | 608 | 126.8 |
| A | 2 | 79 | 51072 | 398.07 | 619 | 608 | 126.8 |
| B | 5 | 255 | 141690 | 1181.69 | 618 | 603 | 119.4 |
| B | 5 | 32 | 48580 | 401.84 | 618 | 603 | 119.4 |
| B | 0 | 190 | 30181 | 247.73 | 618 | 603 | 119.4 |
| C | 15 | 214 | 220946 | 1569.56 | 601 | 606 | 140.4 |
| C | 8 | 79 | 108598 | 769.27 | 601 | 606 | 140.4 |
| C | 7 | 220 | 21546 | 149.16 | 601 | 606 | 140.4 |
| D | 13 | 249 | 326289 | 2289.98 | 588 | 573 | 142.2 |
| D | 12 | 6 | 261221 | 1832.51 | 588 | 573 | 142.2 |
| D | 2 | 249 | 112176 | 784.64 | 588 | 573 | 142.2 |
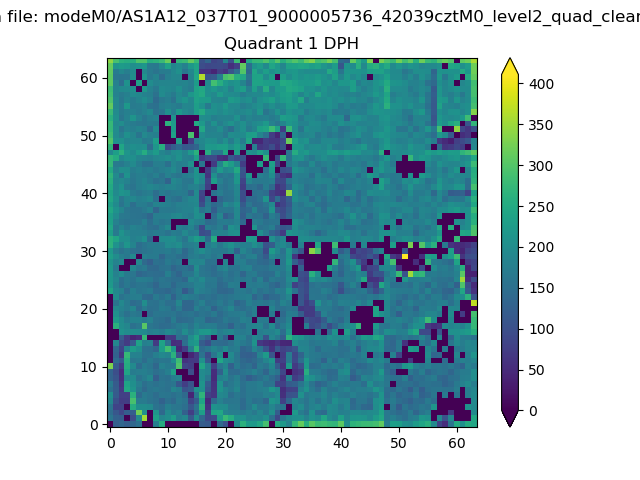
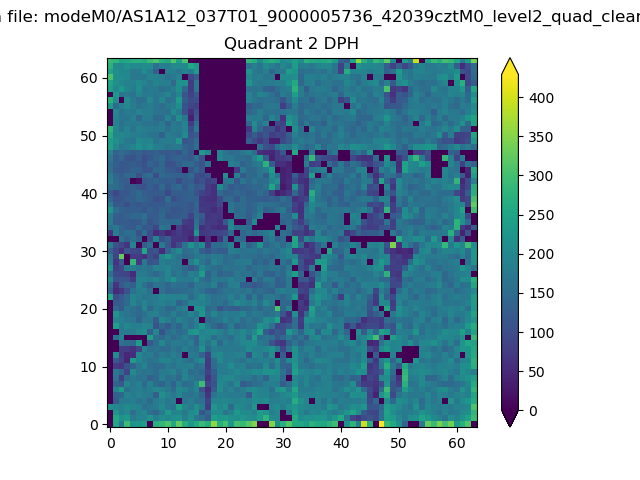
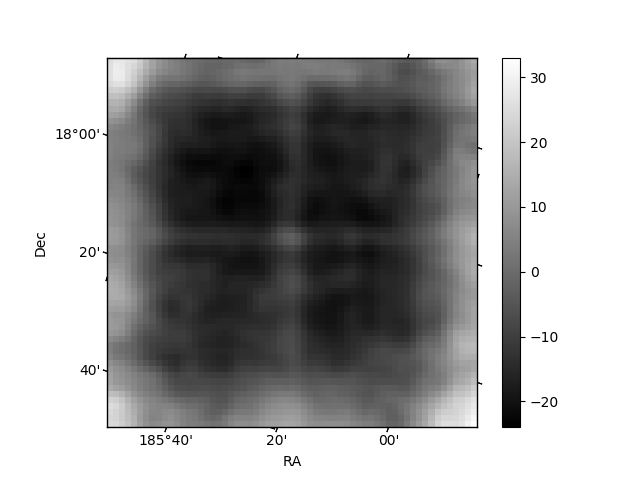
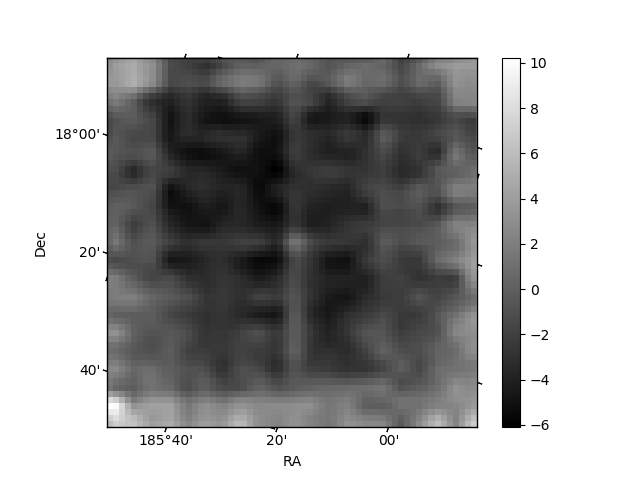
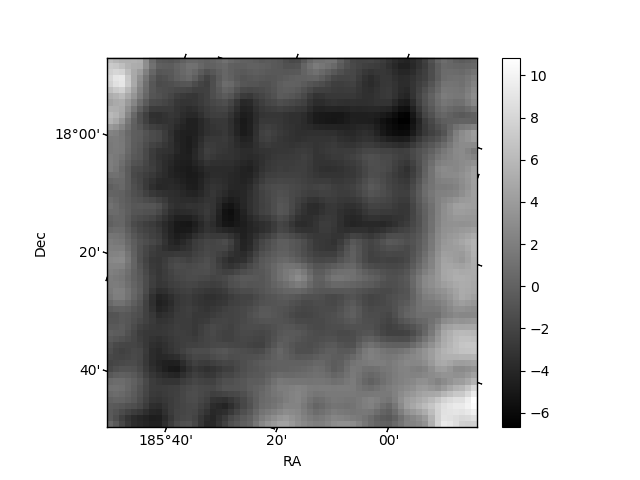
Histogram calculated using DETX and DETY for each event in the final _common_clean file
| Quadrant A |  |
 |
Quadrant B |
|---|---|---|---|
| Quadrant D | 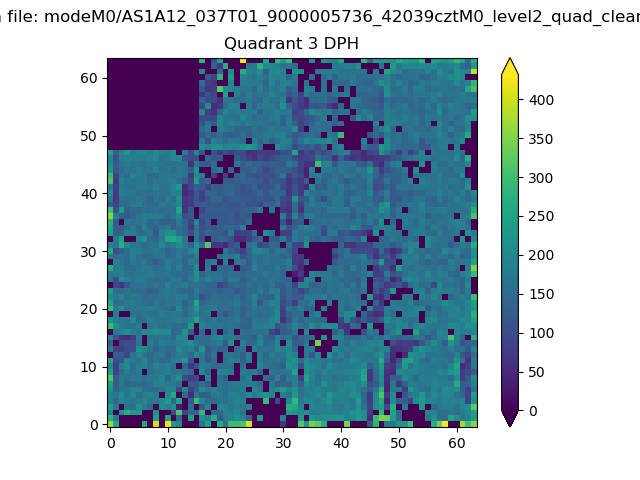 |
 |
Quadrant C |
| Plot type | Count rate plots | Images |
|---|---|---|
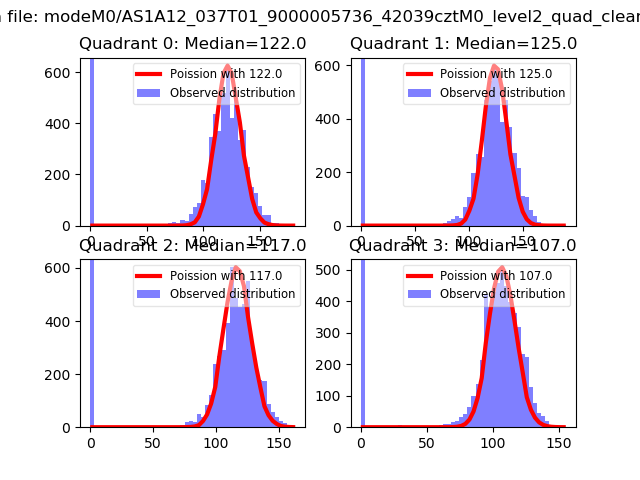
| Comparison with Poisson distribution Blue bars denote a histogram of data divided into 1 sec bins. Red curve is a Poisson curve with rate = median count rate of data. |
 |
 |
| Quadrant-wise count rates Data is divided into 100 sec bins |
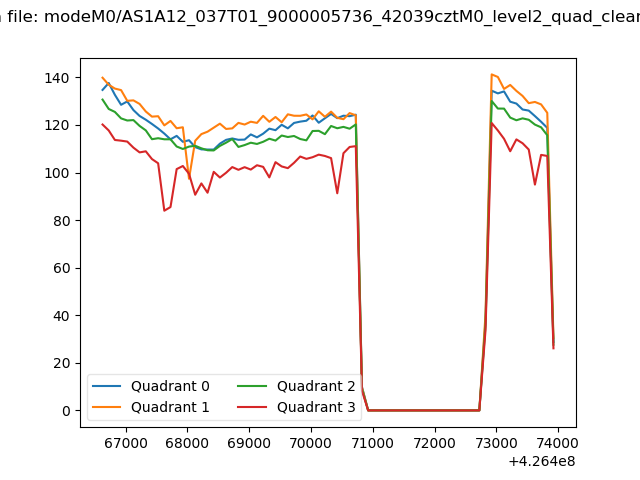 |
|
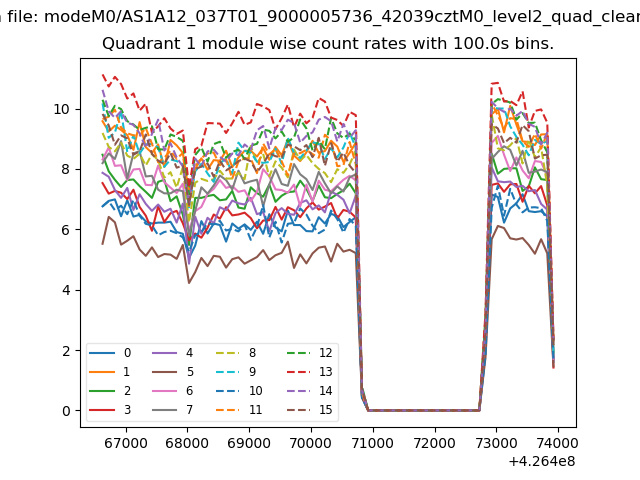
| Module-wise count rates for Quadrant A Data is divided into 100 sec bins |
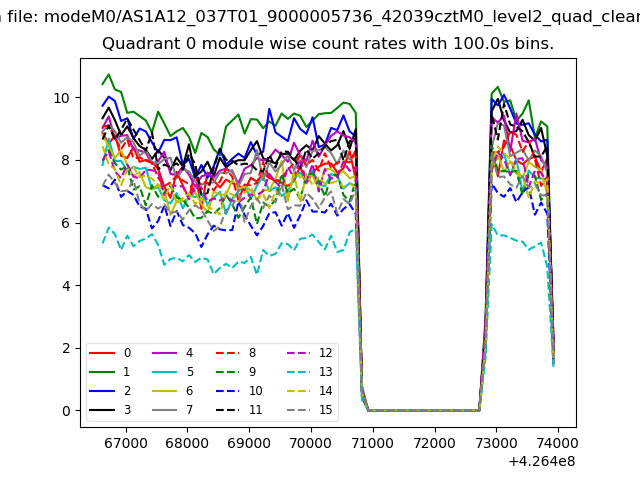 |
 |
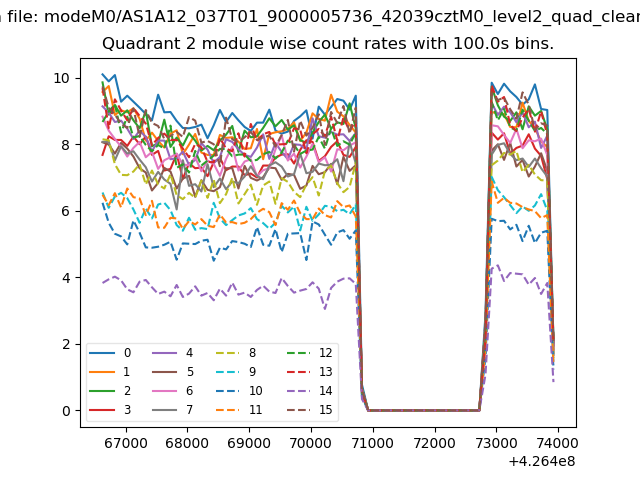
| Module-wise count rates for Quadrant B Data is divided into 100 sec bins |
 |
 |
| Module-wise count rates for Quadrant C Data is divided into 100 sec bins |
 |
 |
| Module-wise count rates for Quadrant D Data is divided into 100 sec bins |
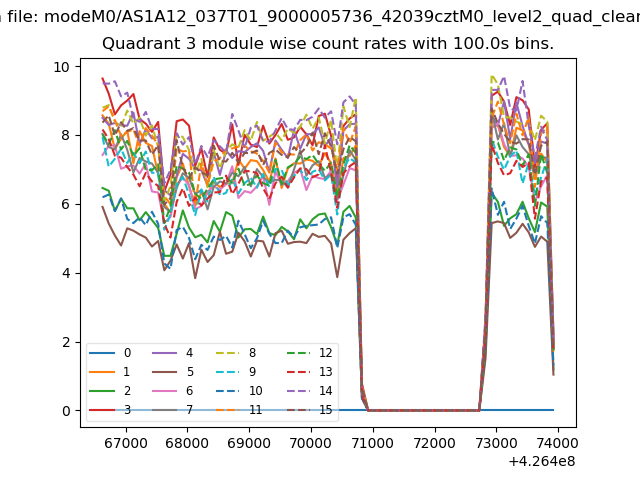 |
 |
| Parameter | Plot |
|---|---|
| CZT HV Monitor |  |
| D_VDD | 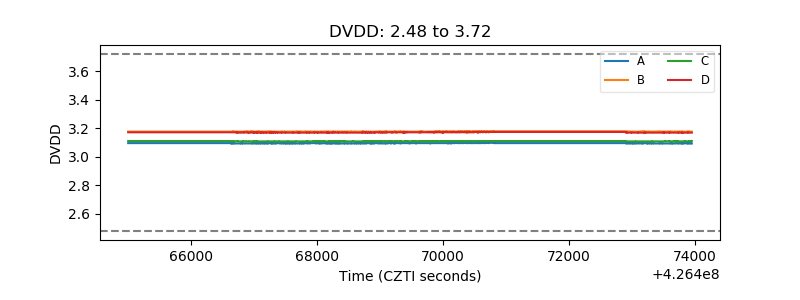 |
| Temperature 1 | 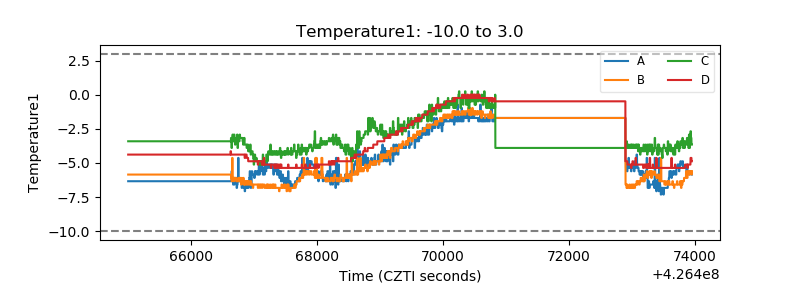 |
| Veto HV Monitor | 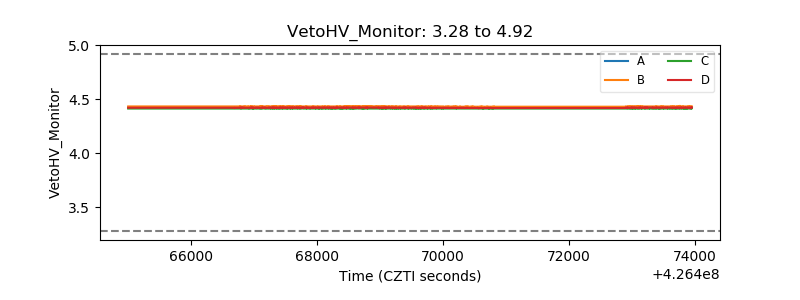 |
| Veto LLD | 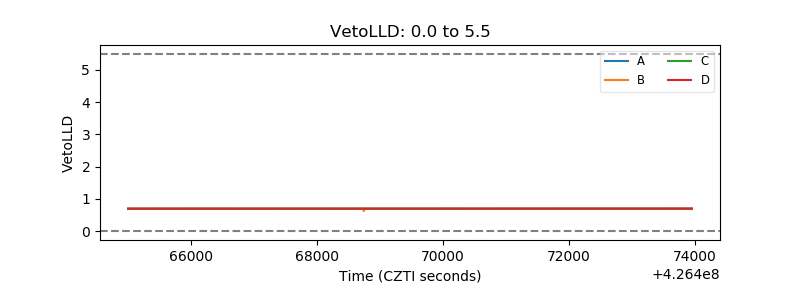 |
| Alpha Counter | 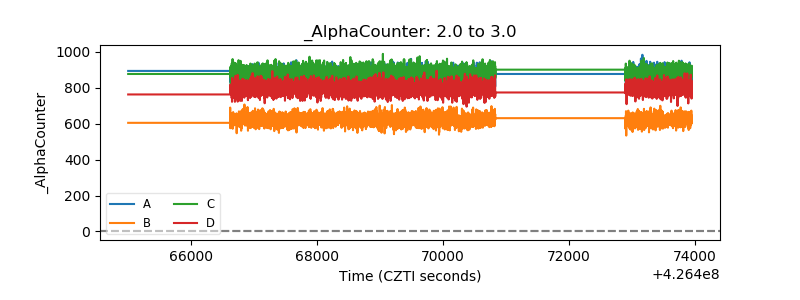 |
| _CPM_Rate | 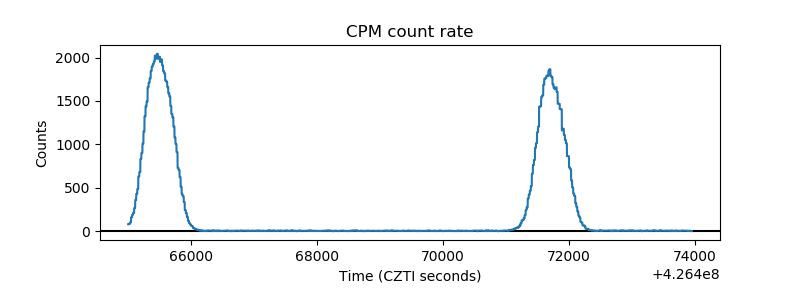 |
| CZT Counter | 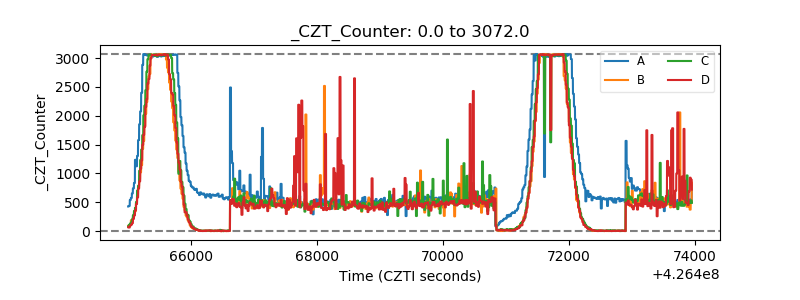 |
| +2.5 Volts monitor | 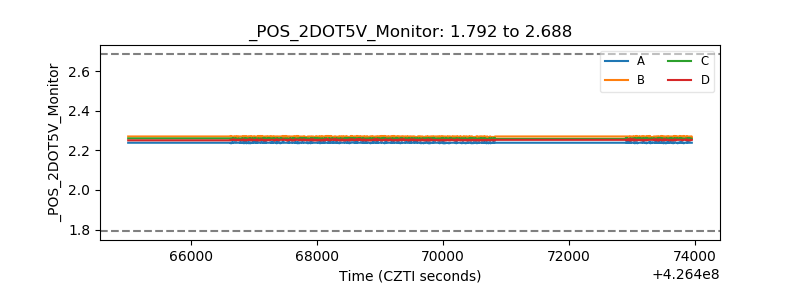 |
| +5 Volts monitor | 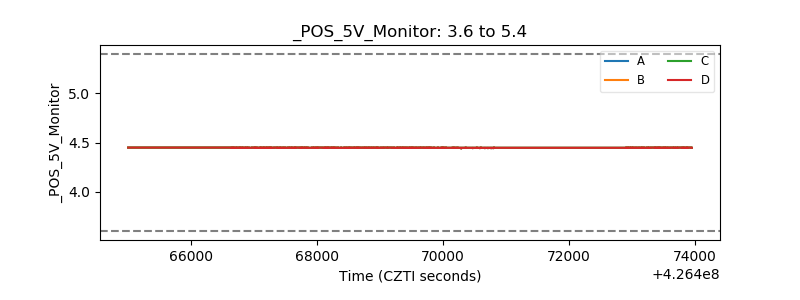 |
| _ROLL_ROT | 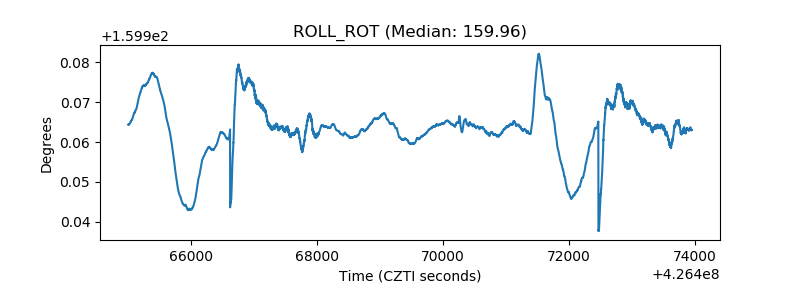 |
| _Roll_DEC | 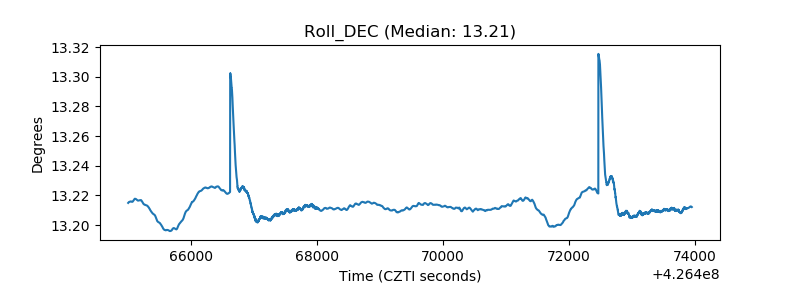 |
| _Roll_RA | 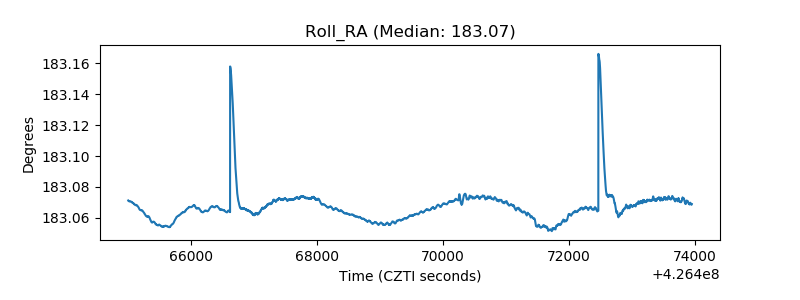 |
| Veto Counter | 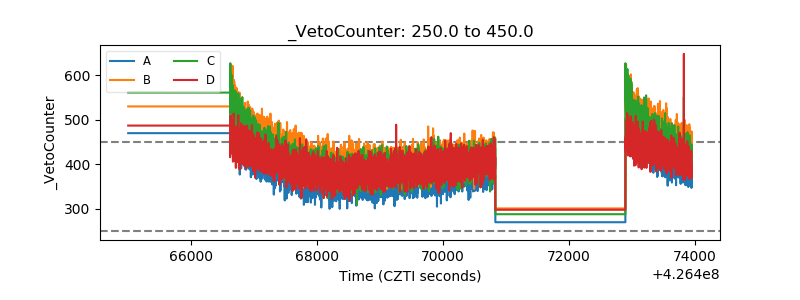 |