| Param | Original file | Final file |
|---|---|---|
| Filename | modeM0/AS1A12_037T01_9000005736_42040cztM0_level2.fits | modeM0/AS1A12_037T01_9000005736_42040cztM0_level2_quad_clean.evt |
| Size (bytes) | 311,976,000 | 89,467,200 |
| Size | 297.5 MB | 85.3 MB |
| Events in quadrant A | 3,128,076 | 607,613 |
| Events in quadrant B | 2,568,016 | 631,891 |
| Events in quadrant C | 2,632,474 | 586,269 |
| Events in quadrant D | 2,828,495 | 531,123 |
| Mode SS | |||
|---|---|---|---|
| Quadrant | BADHDUFLAG | Total packets | Discarded packets |
| A | 0 | 104 | 0 |
| B | 0 | 104 | 0 |
| C | 0 | 104 | 0 |
| D | 0 | 104 | 0 |
| Mode M0 | |||
|---|---|---|---|
| Quadrant | BADHDUFLAG | Total packets | Discarded packets |
| A | 0 | 12470 | 2 |
| B | 0 | 10697 | 1 |
| C | 0 | 10728 | 1 |
| D | 0 | 11776 | 1 |
| Mode M9 | |||
|---|---|---|---|
| Quadrant | BADHDUFLAG | Total packets | Discarded packets |
| A | 0 | 21 | 0 |
| B | 0 | 21 | 0 |
| C | 0 | 21 | 0 |
| D | 0 | 21 | 0 |
| Quadrant | Total seconds | Saturated seconds | Saturation percentage |
|---|---|---|---|
| A | 5021 | 22 | 0.438160% |
| B | 5021 | 19 | 0.378411% |
| C | 5021 | 4 | 0.079665% |
| D | 5021 | 77 | 1.533559% |
Noise dominated data is calculated using 1-second bins in cleaned event files. If a bin has >2000 counts, and if more than 50% of those come from <1% of pixels, then it is considered to be noise-dominated and hence unusable.
| Quadrant | # 1 sec bins | Bins with >0 counts | Bins with >2000 counts | High rate bins dominated by noise | Noise dominated (total time) | Noise dominated (detector-on time) | Marked lightcurve |
|---|---|---|---|---|---|---|---|
| A | 7142 | 5022 | 14 | 14 | 0.20% | 0.28% |  |
| B | 7142 | 5022 | 10 | 10 | 0.14% | 0.20% |  |
| C | 7142 | 5022 | 1 | 1 | 0.01% | 0.02% | 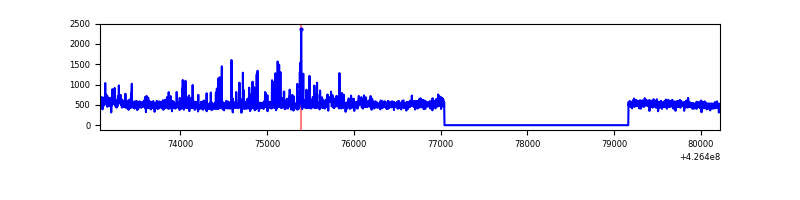 |
| D | 7142 | 5022 | 73 | 73 | 1.02% | 1.45% | 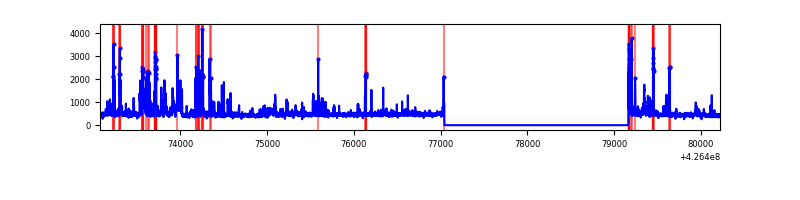 |
Top three noisy pixels from each quadrant. If the there are fewer than three noisy pixels in the level2.evt file, extra rows are filled as -1
| Pixel properties | Quadrant properties | ||||||
|---|---|---|---|---|---|---|---|
| Quadrant | DetID | PixID | Counts | Sigma | Mean | Median | Sigma |
| A | 10 | 83 | 453665 | 3712.94 | 594 | 582 | 122.0 |
| A | 15 | 222 | 170505 | 1392.49 | 594 | 582 | 122.0 |
| A | 12 | 189 | 107843 | 878.99 | 594 | 582 | 122.0 |
| B | 5 | 255 | 103242 | 906.36 | 593 | 578 | 113.3 |
| B | 5 | 32 | 67905 | 594.39 | 593 | 578 | 113.3 |
| B | 0 | 190 | 33714 | 292.54 | 593 | 578 | 113.3 |
| C | 15 | 214 | 209192 | 1563.8 | 573 | 577 | 133.4 |
| C | 7 | 220 | 124409 | 928.26 | 573 | 577 | 133.4 |
| C | 8 | 79 | 53249 | 394.84 | 573 | 577 | 133.4 |
| D | 12 | 6 | 259907 | 1874.65 | 568 | 553 | 138.3 |
| D | 13 | 249 | 237059 | 1709.5 | 568 | 553 | 138.3 |
| D | 12 | 218 | 75212 | 539.65 | 568 | 553 | 138.3 |
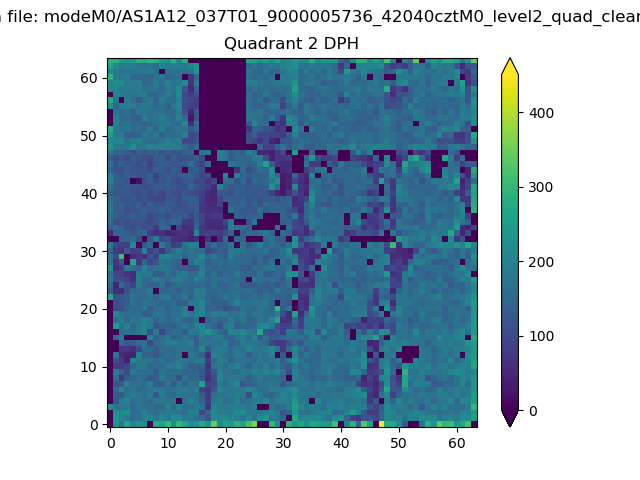
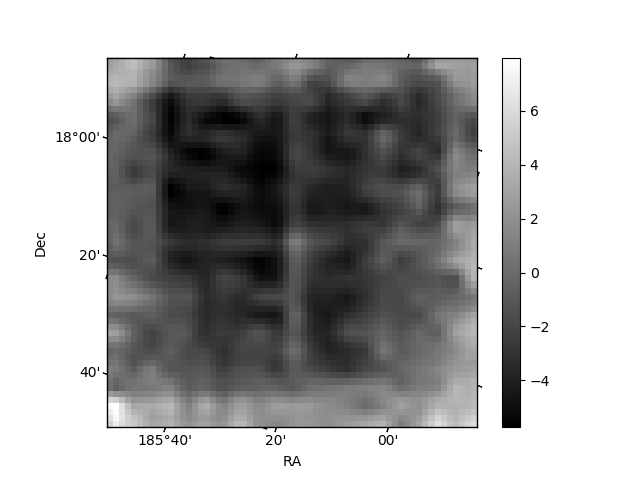
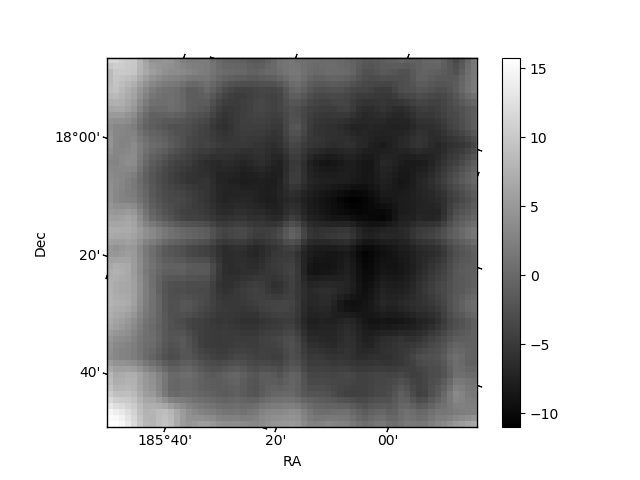
Histogram calculated using DETX and DETY for each event in the final _common_clean file
| Quadrant A | 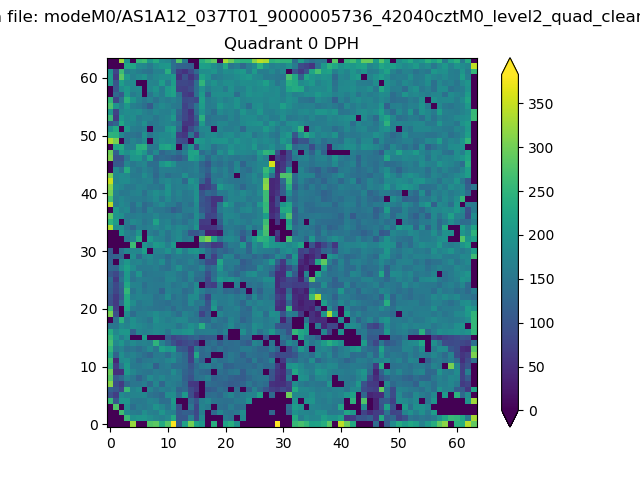 |
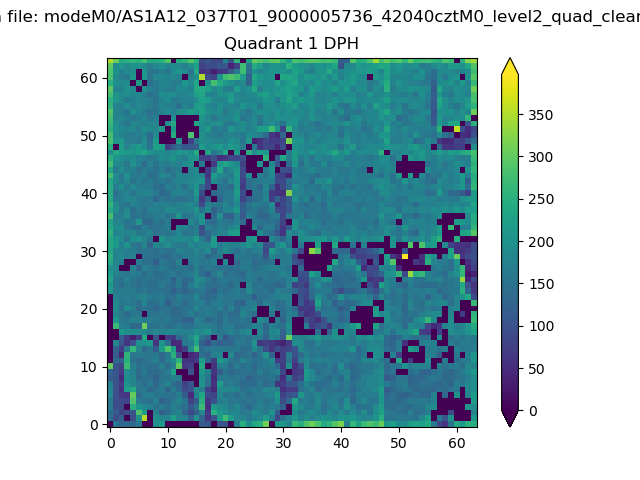 |
Quadrant B |
|---|---|---|---|
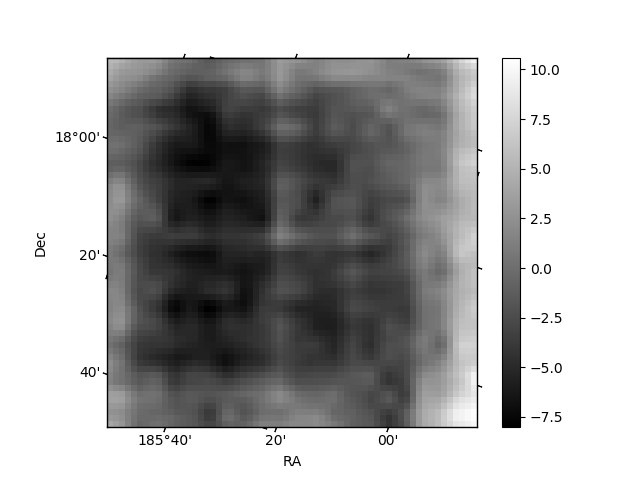
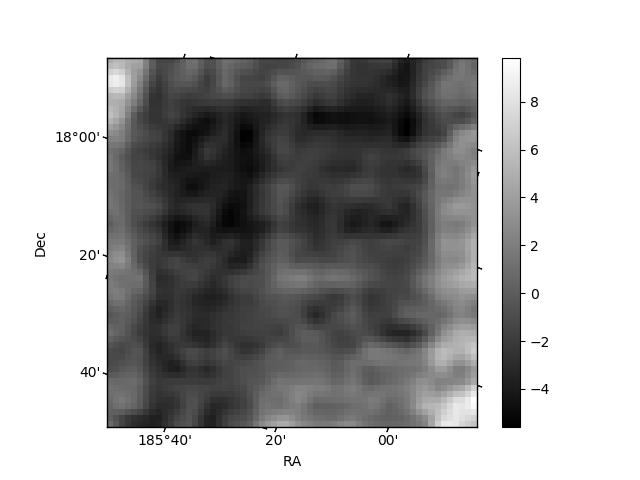
| Quadrant D | 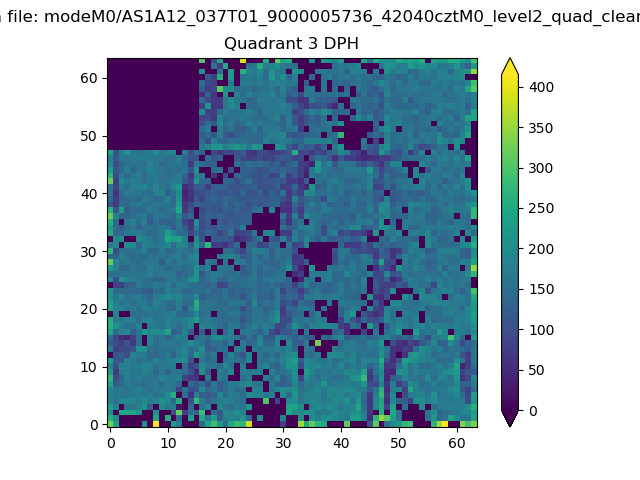 |
 |
Quadrant C |
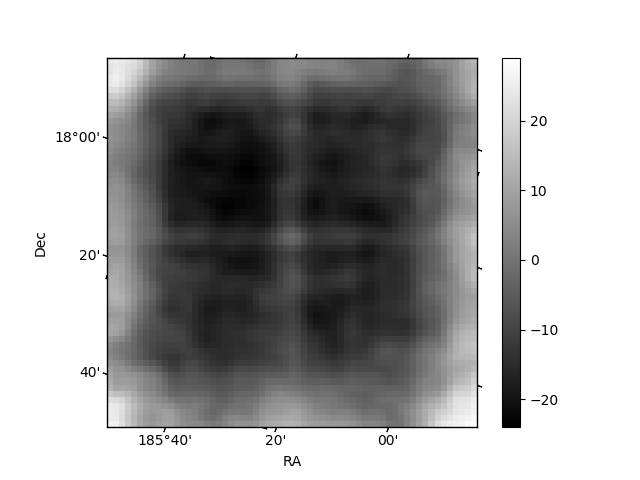
| Plot type | Count rate plots | Images |
|---|---|---|
| Comparison with Poisson distribution Blue bars denote a histogram of data divided into 1 sec bins. Red curve is a Poisson curve with rate = median count rate of data. |
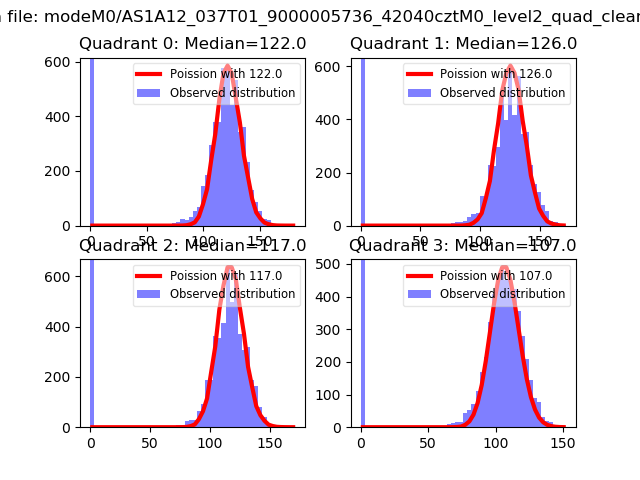 |
 |
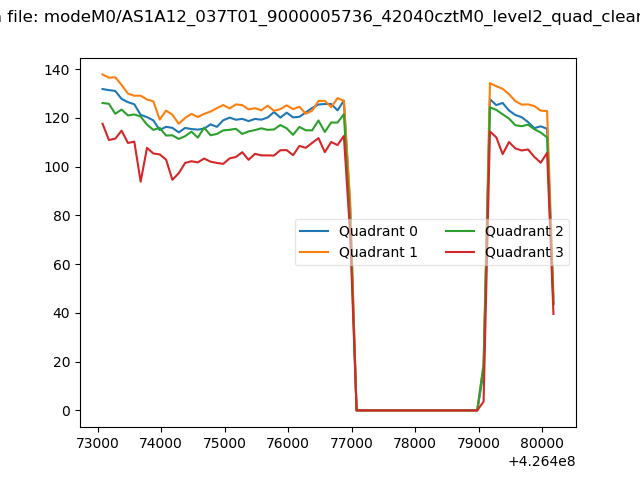
| Quadrant-wise count rates Data is divided into 100 sec bins |
 |
|
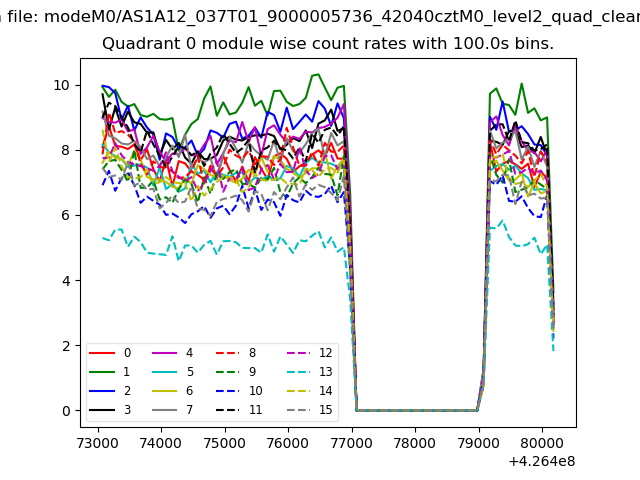
| Module-wise count rates for Quadrant A Data is divided into 100 sec bins |
 |
 |
| Module-wise count rates for Quadrant B Data is divided into 100 sec bins |
 |
 |
| Module-wise count rates for Quadrant C Data is divided into 100 sec bins |
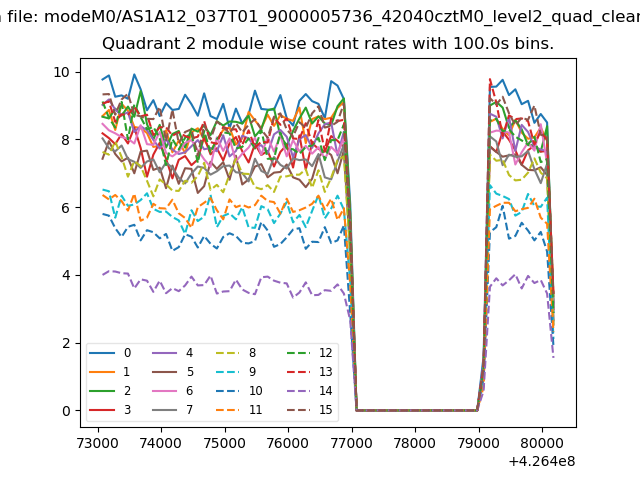 |
 |
| Module-wise count rates for Quadrant D Data is divided into 100 sec bins |
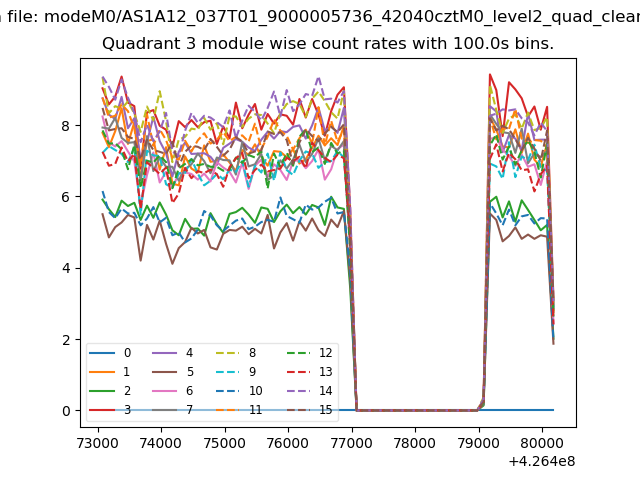 |
 |
| Parameter | Plot |
|---|---|
| CZT HV Monitor |  |
| D_VDD | 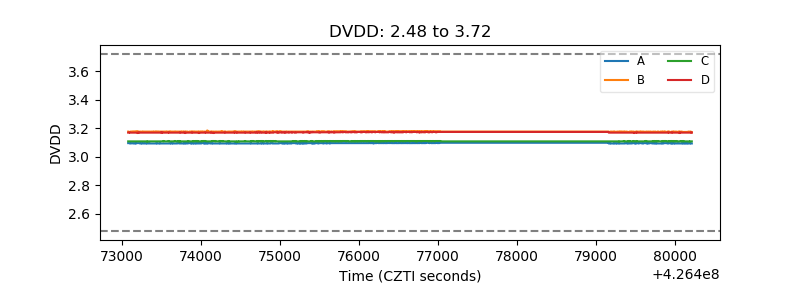 |
| Temperature 1 | 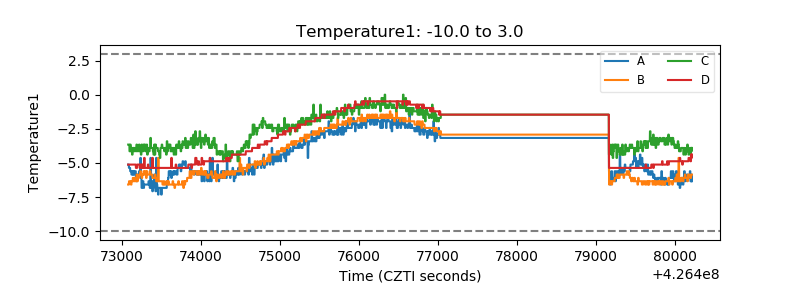 |
| Veto HV Monitor | 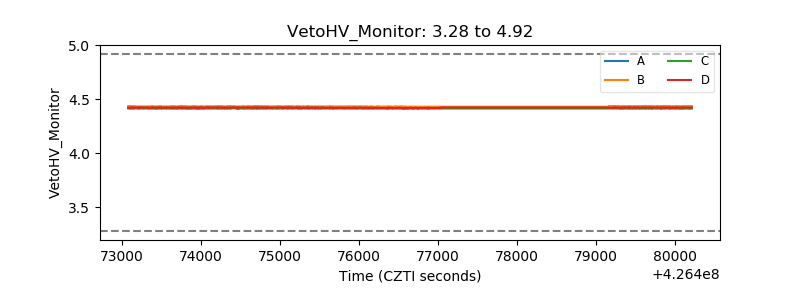 |
| Veto LLD | 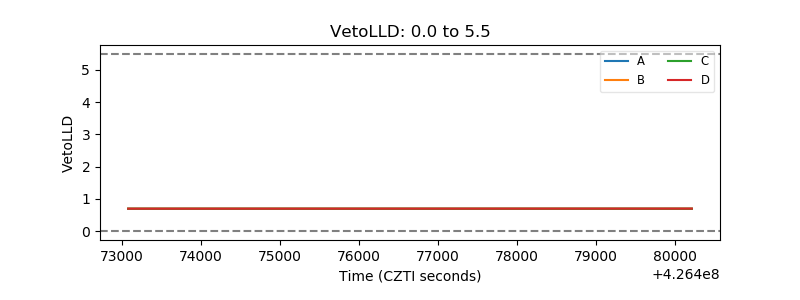 |
| Alpha Counter | 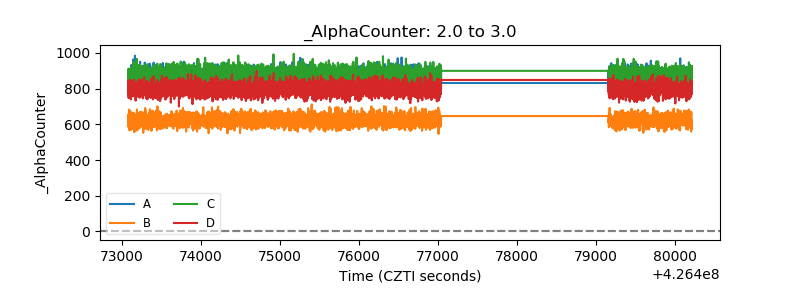 |
| _CPM_Rate |  |
| CZT Counter | 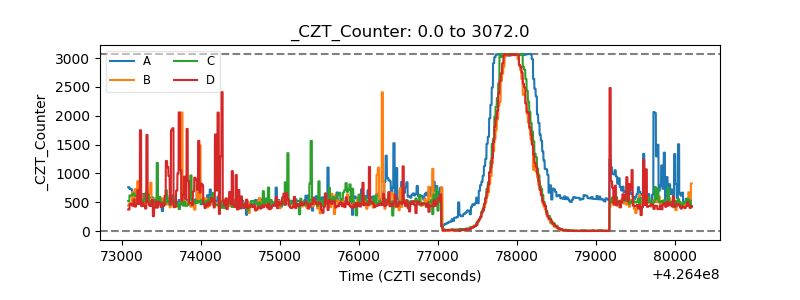 |
| +2.5 Volts monitor | 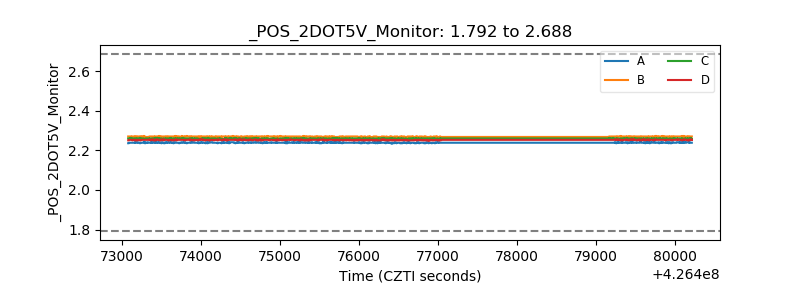 |
| +5 Volts monitor | 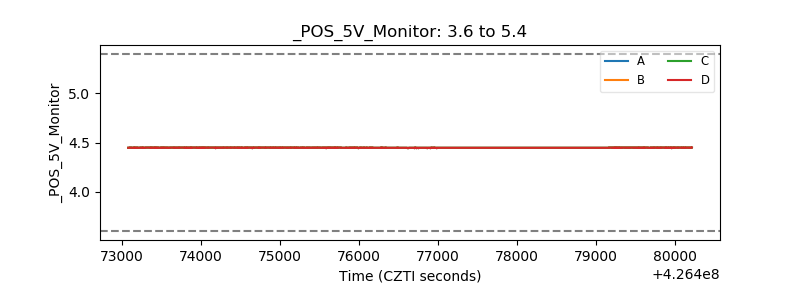 |
| _ROLL_ROT | 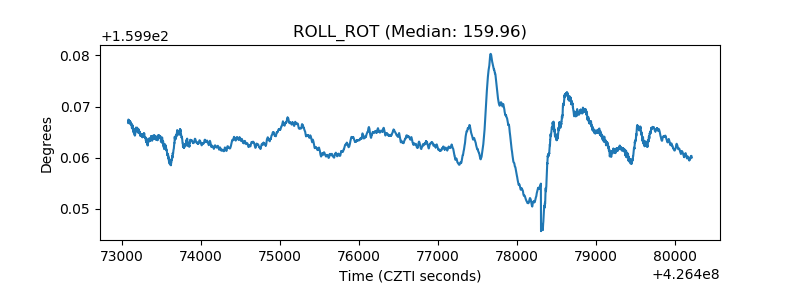 |
| _Roll_DEC | 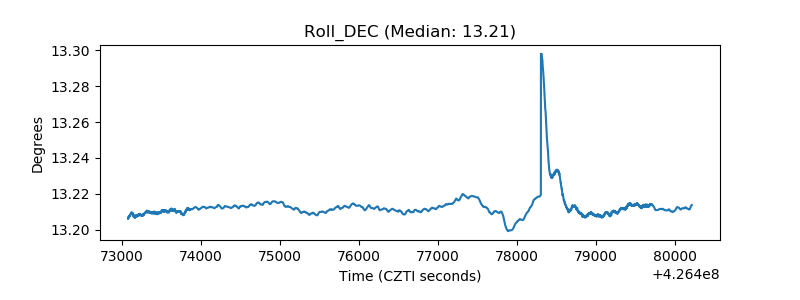 |
| _Roll_RA | 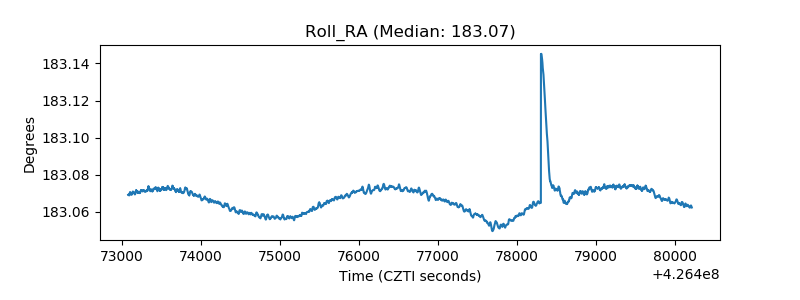 |
| Veto Counter | 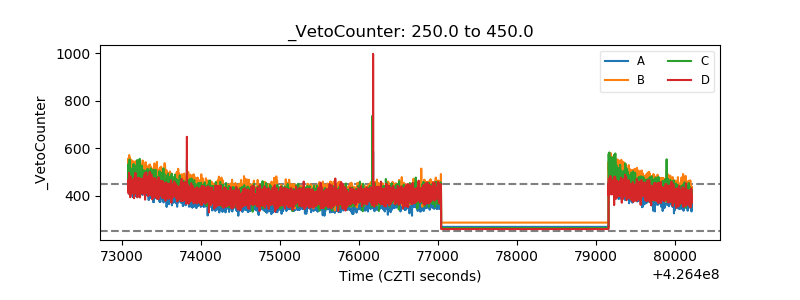 |