| Param | Original file | Final file |
|---|---|---|
| Filename | modeM0/AS1A12_037T01_9000005736_42041cztM0_level2.fits | modeM0/AS1A12_037T01_9000005736_42041cztM0_level2_quad_clean.evt |
| Size (bytes) | 305,242,560 | 87,840,000 |
| Size | 291.1 MB | 83.8 MB |
| Events in quadrant A | 3,131,450 | 592,605 |
| Events in quadrant B | 2,558,724 | 612,371 |
| Events in quadrant C | 2,516,874 | 577,621 |
| Events in quadrant D | 2,697,464 | 522,876 |
| Mode SS | |||
|---|---|---|---|
| Quadrant | BADHDUFLAG | Total packets | Discarded packets |
| A | 0 | 102 | 0 |
| B | 0 | 102 | 0 |
| C | 0 | 102 | 0 |
| D | 0 | 102 | 0 |
| Mode M0 | |||
|---|---|---|---|
| Quadrant | BADHDUFLAG | Total packets | Discarded packets |
| A | 0 | 12377 | 3 |
| B | 0 | 10789 | 2 |
| C | 0 | 10390 | 2 |
| D | 0 | 11476 | 2 |
| Mode M9 | |||
|---|---|---|---|
| Quadrant | BADHDUFLAG | Total packets | Discarded packets |
| A | 0 | 34 | 0 |
| B | 0 | 34 | 0 |
| C | 0 | 34 | 0 |
| D | 0 | 35 | 0 |
| Quadrant | Total seconds | Saturated seconds | Saturation percentage |
|---|---|---|---|
| A | 5061 | 26 | 0.513732% |
| B | 5061 | 73 | 1.442403% |
| C | 5061 | 4 | 0.079036% |
| D | 5061 | 67 | 1.323849% |
Noise dominated data is calculated using 1-second bins in cleaned event files. If a bin has >2000 counts, and if more than 50% of those come from <1% of pixels, then it is considered to be noise-dominated and hence unusable.
| Quadrant | # 1 sec bins | Bins with >0 counts | Bins with >2000 counts | High rate bins dominated by noise | Noise dominated (total time) | Noise dominated (detector-on time) | Marked lightcurve |
|---|---|---|---|---|---|---|---|
| A | 7214 | 5062 | 16 | 16 | 0.22% | 0.32% | 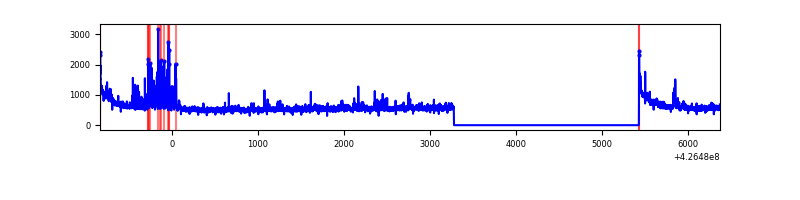 |
| B | 7214 | 5062 | 49 | 49 | 0.68% | 0.97% | 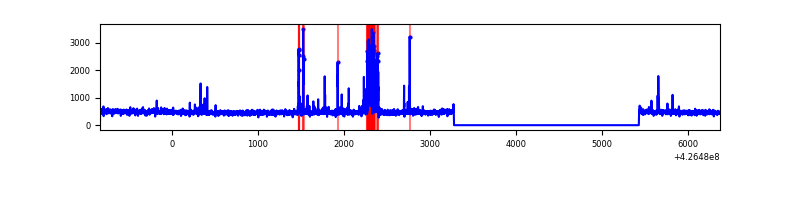 |
| C | 7214 | 5062 | 0 | 0 | 0.00% | 0.00% | 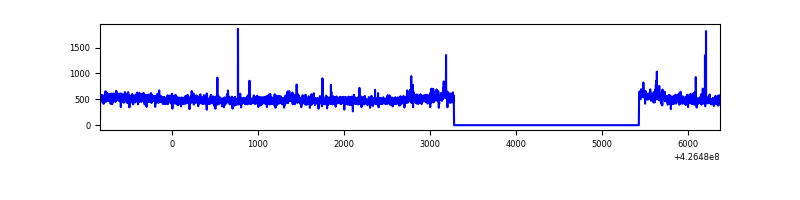 |
| D | 7214 | 5062 | 57 | 57 | 0.79% | 1.13% | 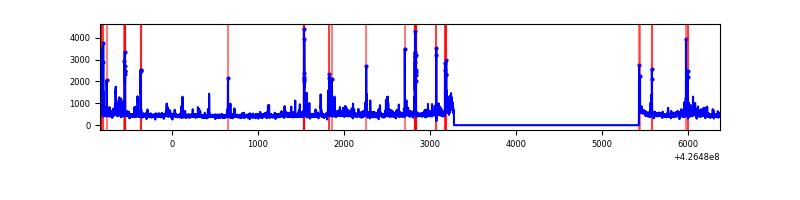 |
Top three noisy pixels from each quadrant. If the there are fewer than three noisy pixels in the level2.evt file, extra rows are filled as -1
| Pixel properties | Quadrant properties | ||||||
|---|---|---|---|---|---|---|---|
| Quadrant | DetID | PixID | Counts | Sigma | Mean | Median | Sigma |
| A | 10 | 83 | 537139 | 4436.1 | 588 | 576 | 121.0 |
| A | 15 | 222 | 180712 | 1489.3 | 588 | 576 | 121.0 |
| A | 15 | 223 | 60622 | 496.44 | 588 | 576 | 121.0 |
| B | 15 | 85 | 140590 | 1250.11 | 583 | 568 | 112.0 |
| B | 5 | 255 | 61820 | 546.86 | 583 | 568 | 112.0 |
| B | 0 | 190 | 39659 | 349.0 | 583 | 568 | 112.0 |
| C | 15 | 214 | 216176 | 1619.86 | 569 | 574 | 133.1 |
| C | 7 | 220 | 59844 | 445.3 | 569 | 574 | 133.1 |
| C | 12 | 249 | 16057 | 116.32 | 569 | 574 | 133.1 |
| D | 1 | 52 | 224594 | 1624.22 | 564 | 548 | 137.9 |
| D | 13 | 249 | 103571 | 746.87 | 564 | 548 | 137.9 |
| D | 12 | 6 | 79229 | 570.4 | 564 | 548 | 137.9 |
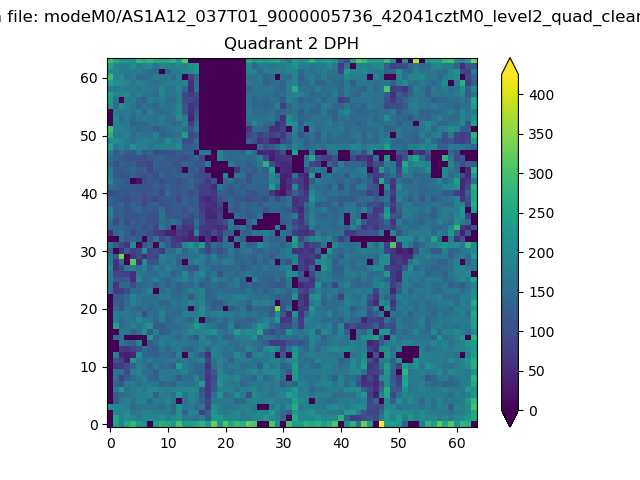
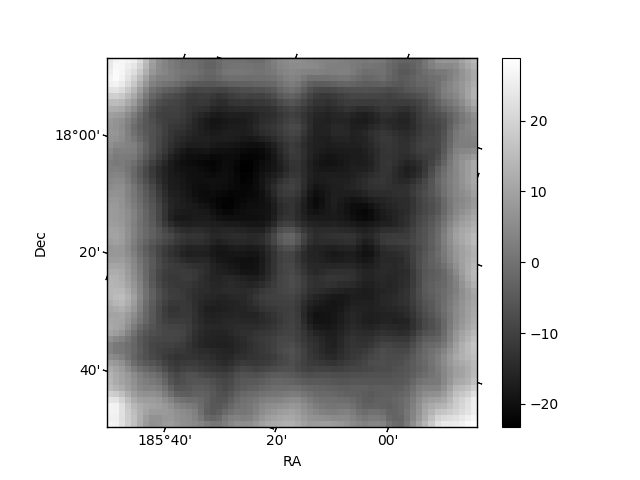
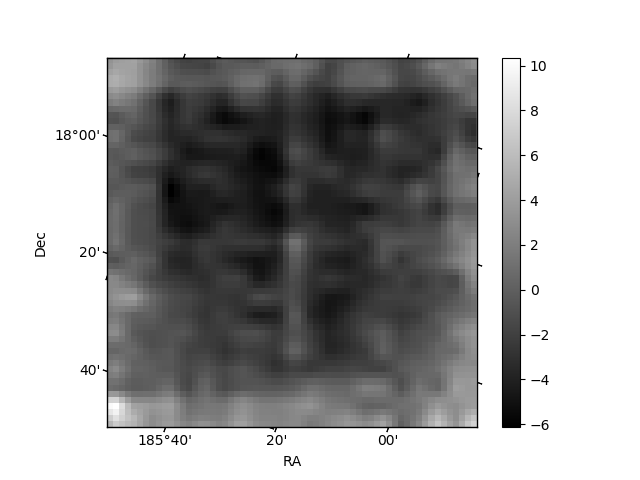
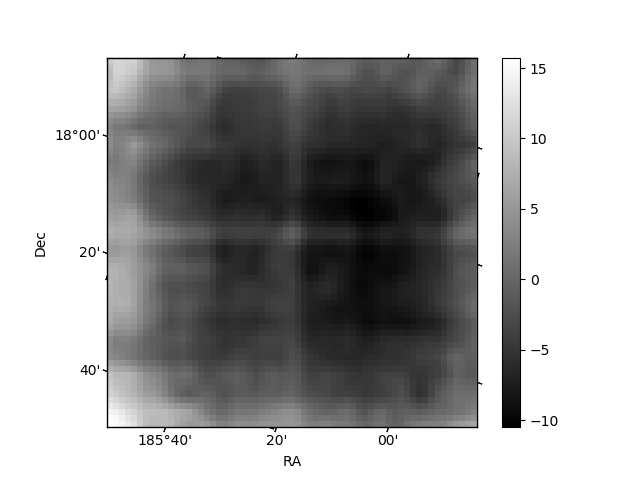
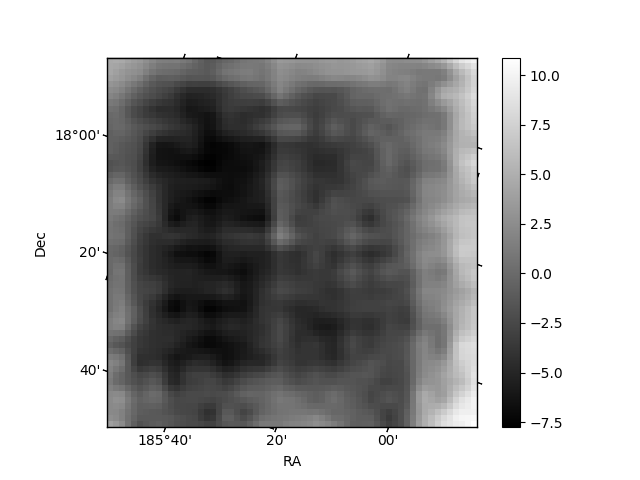
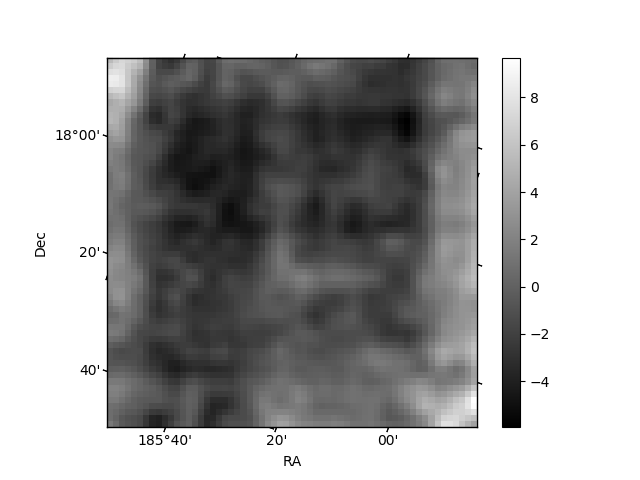
Histogram calculated using DETX and DETY for each event in the final _common_clean file
| Quadrant A | 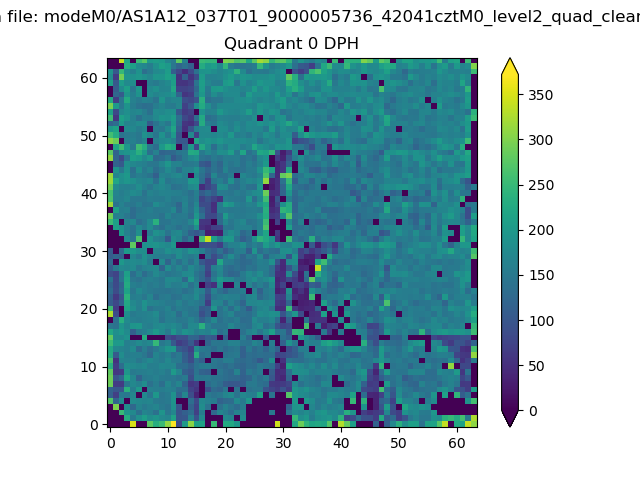 |
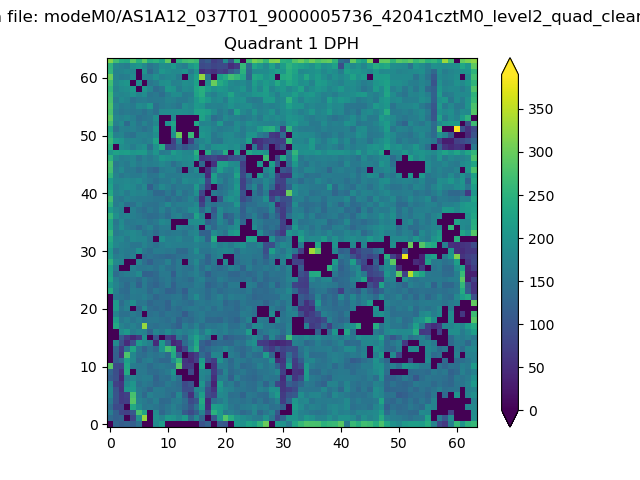 |
Quadrant B |
|---|---|---|---|
| Quadrant D | 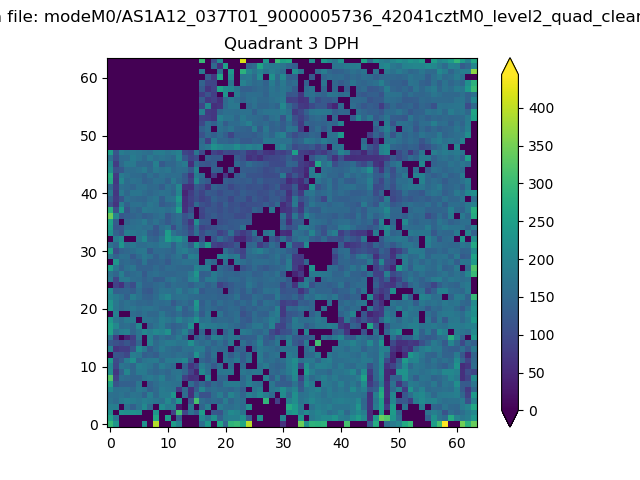 |
 |
Quadrant C |
| Plot type | Count rate plots | Images |
|---|---|---|
| Comparison with Poisson distribution Blue bars denote a histogram of data divided into 1 sec bins. Red curve is a Poisson curve with rate = median count rate of data. |
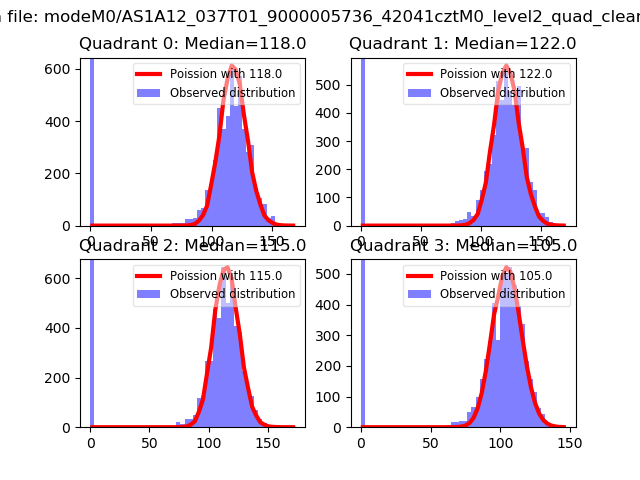 |
 |
| Quadrant-wise count rates Data is divided into 100 sec bins |
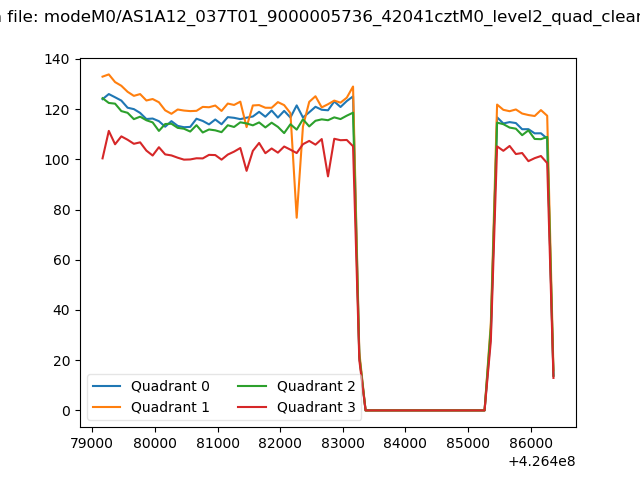 |
|
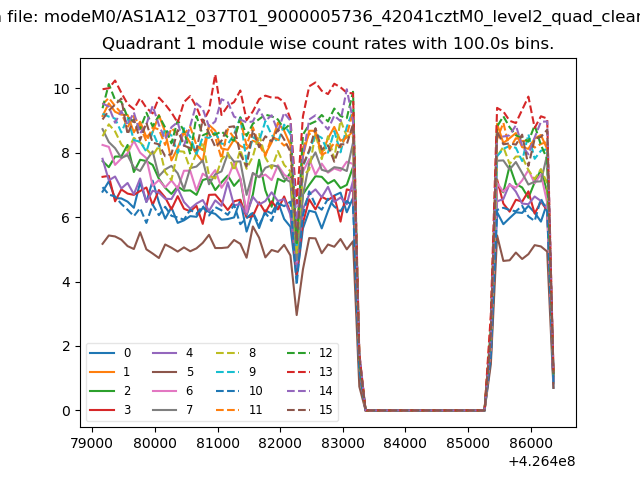
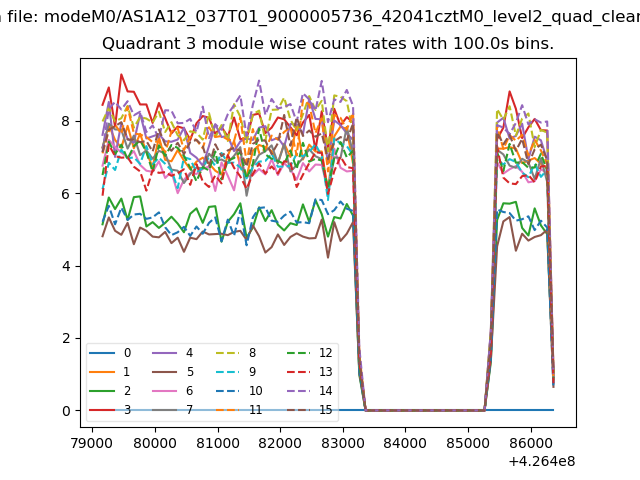
| Module-wise count rates for Quadrant A Data is divided into 100 sec bins |
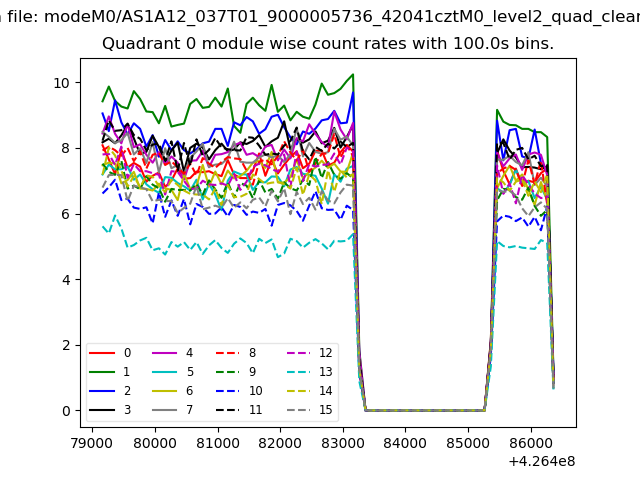 |
 |
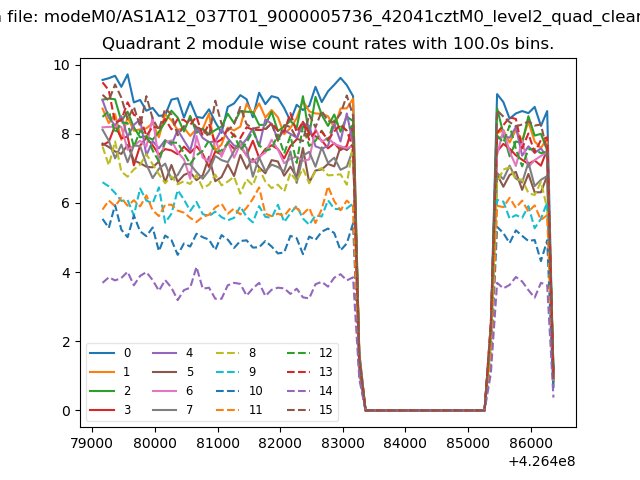
| Module-wise count rates for Quadrant B Data is divided into 100 sec bins |
 |
 |
| Module-wise count rates for Quadrant C Data is divided into 100 sec bins |
 |
 |
| Module-wise count rates for Quadrant D Data is divided into 100 sec bins |
 |
 |
| Parameter | Plot |
|---|---|
| CZT HV Monitor | 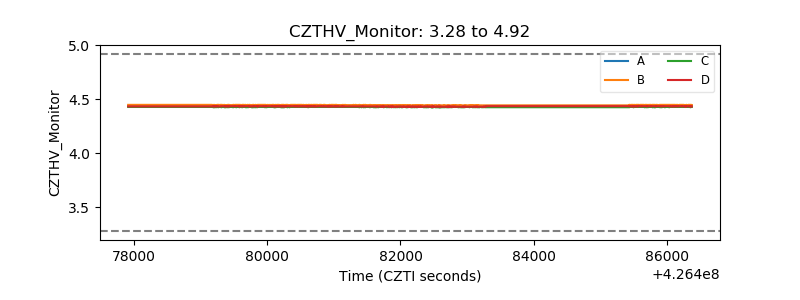 |
| D_VDD | 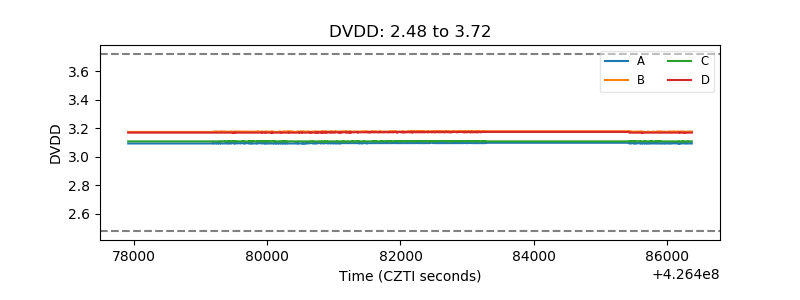 |
| Temperature 1 | 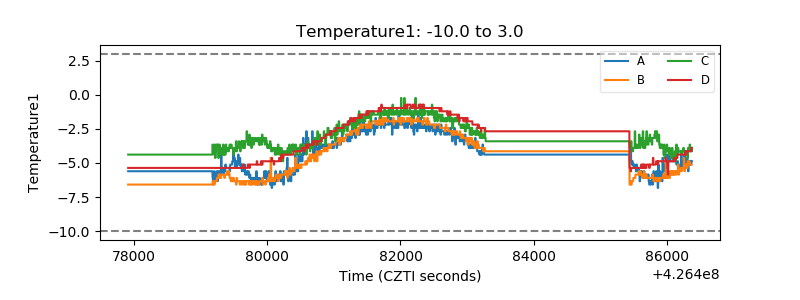 |
| Veto HV Monitor |  |
| Veto LLD | 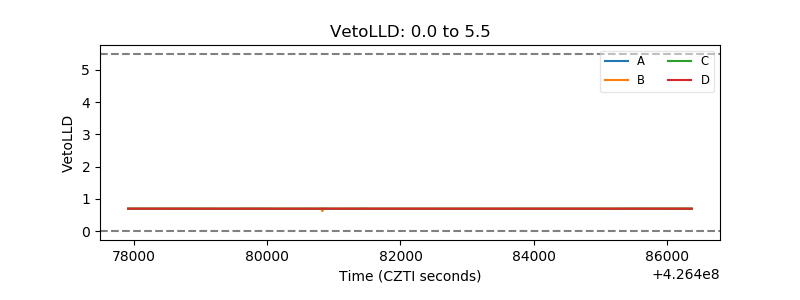 |
| Alpha Counter | 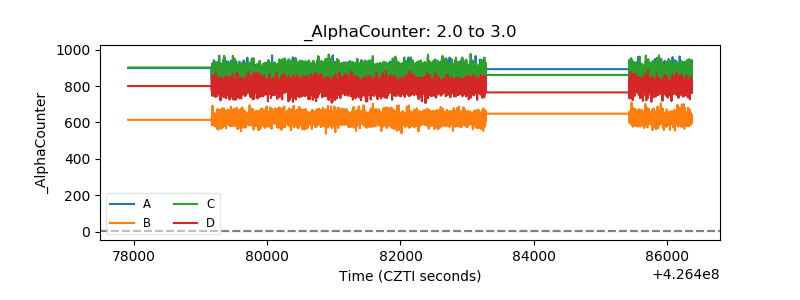 |
| _CPM_Rate | 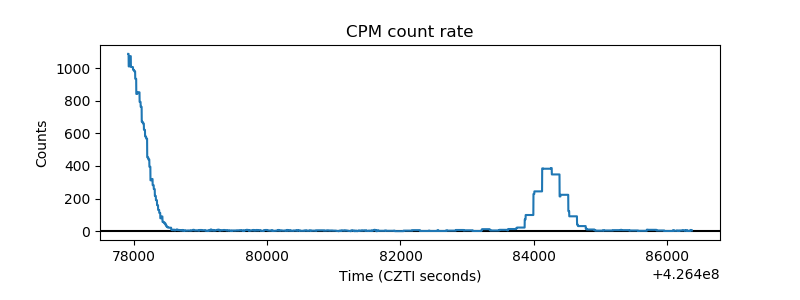 |
| CZT Counter | 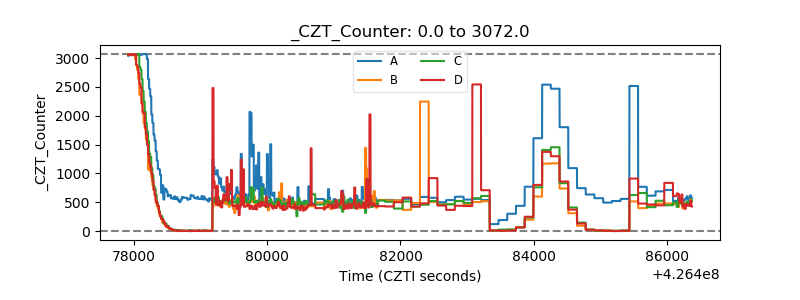 |
| +2.5 Volts monitor | 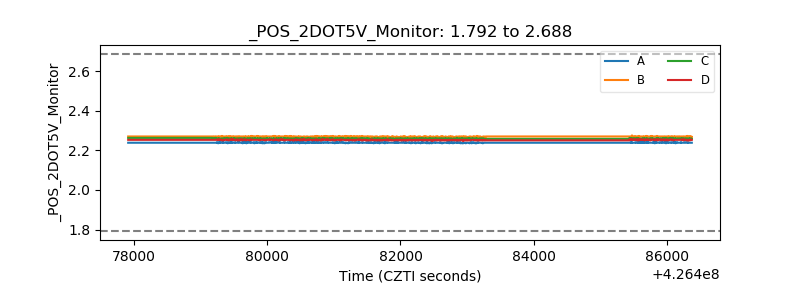 |
| +5 Volts monitor | 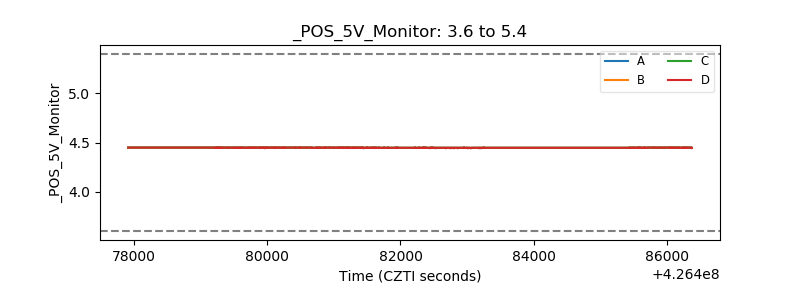 |
| _ROLL_ROT | 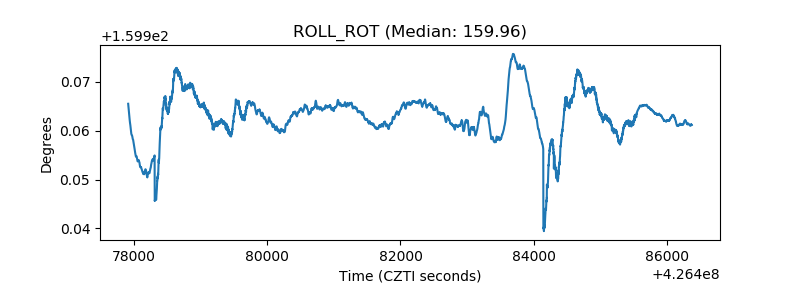 |
| _Roll_DEC | 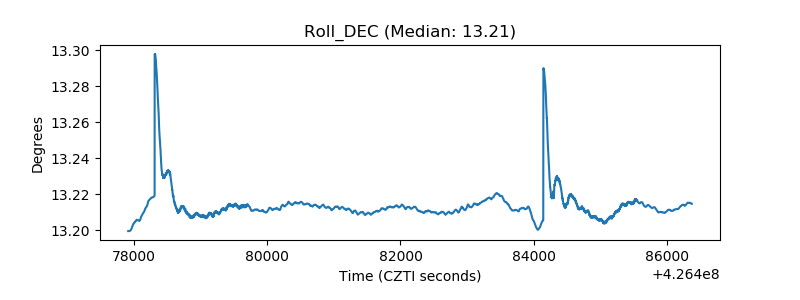 |
| _Roll_RA | 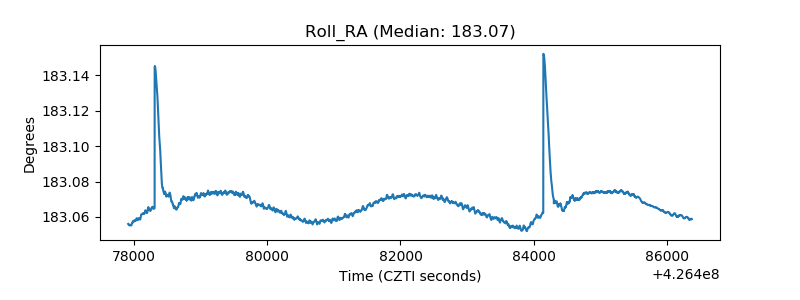 |
| Veto Counter | 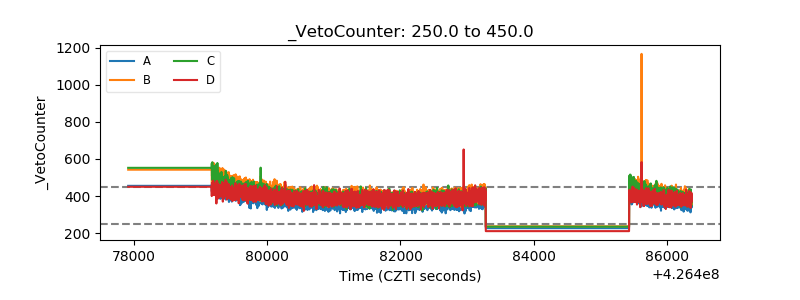 |