| Param | Original file | Final file |
|---|---|---|
| Filename | modeM0/AS1A12_037T01_9000005736_42043cztM0_level2.fits | modeM0/AS1A12_037T01_9000005736_42043cztM0_level2_quad_clean.evt |
| Size (bytes) | 311,921,280 | 89,167,680 |
| Size | 297.5 MB | 85.0 MB |
| Events in quadrant A | 3,430,778 | 593,625 |
| Events in quadrant B | 2,510,955 | 613,332 |
| Events in quadrant C | 2,550,583 | 580,496 |
| Events in quadrant D | 2,632,477 | 534,093 |
| Mode SS | |||
|---|---|---|---|
| Quadrant | BADHDUFLAG | Total packets | Discarded packets |
| A | 0 | 115 | 3 |
| B | 0 | 114 | 2 |
| C | 0 | 114 | 2 |
| D | 0 | 113 | 1 |
| Mode M0 | |||
|---|---|---|---|
| Quadrant | BADHDUFLAG | Total packets | Discarded packets |
| A | 0 | 13657 | 218 |
| B | 0 | 11269 | 151 |
| C | 0 | 11085 | 174 |
| D | 0 | 11790 | 181 |
| Mode M9 | |||
|---|---|---|---|
| Quadrant | BADHDUFLAG | Total packets | Discarded packets |
| A | 0 | 37 | 0 |
| B | 0 | 37 | 0 |
| C | 0 | 37 | 0 |
| D | 0 | 37 | 0 |
| Quadrant | Total seconds | Saturated seconds | Saturation percentage |
|---|---|---|---|
| A | 5407 | 79 | 1.461069% |
| B | 5415 | 22 | 0.406279% |
| C | 5400 | 3 | 0.055556% |
| D | 5405 | 26 | 0.481036% |
Noise dominated data is calculated using 1-second bins in cleaned event files. If a bin has >2000 counts, and if more than 50% of those come from <1% of pixels, then it is considered to be noise-dominated and hence unusable.
| Quadrant | # 1 sec bins | Bins with >0 counts | Bins with >2000 counts | High rate bins dominated by noise | Noise dominated (total time) | Noise dominated (detector-on time) | Marked lightcurve |
|---|---|---|---|---|---|---|---|
| A | 9222 | 5421 | 63 | 63 | 0.68% | 1.16% | 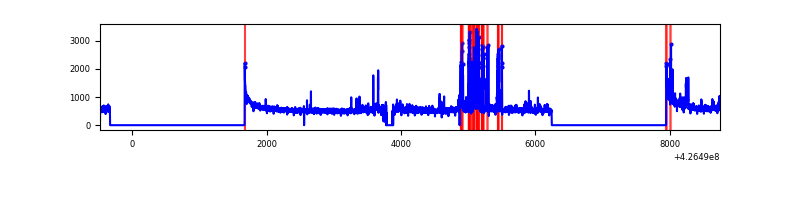 |
| B | 9222 | 5431 | 10 | 10 | 0.11% | 0.18% | 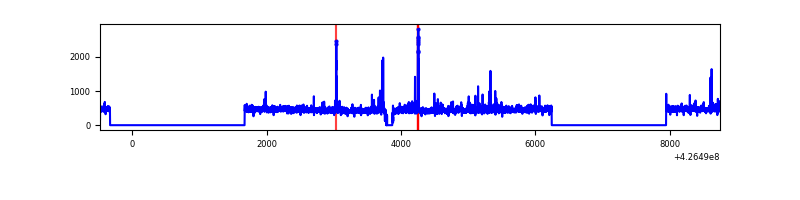 |
| C | 9223 | 5417 | 1 | 1 | 0.01% | 0.02% | 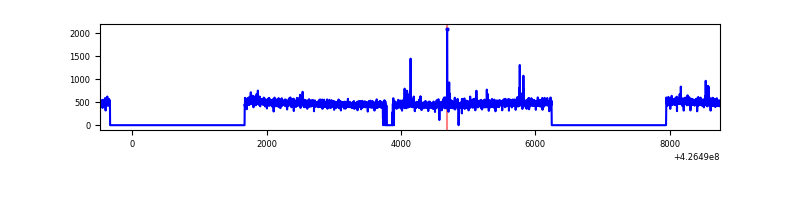 |
| D | 9223 | 5422 | 13 | 13 | 0.14% | 0.24% | 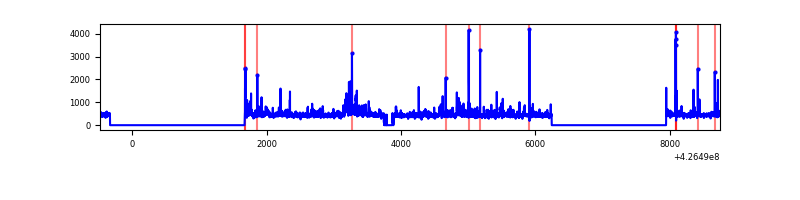 |
Top three noisy pixels from each quadrant. If the there are fewer than three noisy pixels in the level2.evt file, extra rows are filled as -1
| Pixel properties | Quadrant properties | ||||||
|---|---|---|---|---|---|---|---|
| Quadrant | DetID | PixID | Counts | Sigma | Mean | Median | Sigma |
| A | 10 | 83 | 568806 | 4531.37 | 602 | 589 | 125.4 |
| A | 15 | 222 | 332919 | 2650.24 | 602 | 589 | 125.4 |
| A | 15 | 223 | 92859 | 735.83 | 602 | 589 | 125.4 |
| B | 0 | 190 | 49166 | 413.0 | 599 | 582 | 117.6 |
| B | 5 | 255 | 39204 | 328.32 | 599 | 582 | 117.6 |
| B | 4 | 36 | 28629 | 238.42 | 599 | 582 | 117.6 |
| C | 15 | 214 | 232145 | 1690.08 | 584 | 587 | 137.0 |
| C | 12 | 249 | 21081 | 149.58 | 584 | 587 | 137.0 |
| C | 15 | 111 | 14814 | 103.84 | 584 | 587 | 137.0 |
| D | 1 | 52 | 187663 | 1305.49 | 585 | 568 | 143.3 |
| D | 12 | 233 | 53646 | 370.36 | 585 | 568 | 143.3 |
| D | 13 | 249 | 50147 | 345.95 | 585 | 568 | 143.3 |
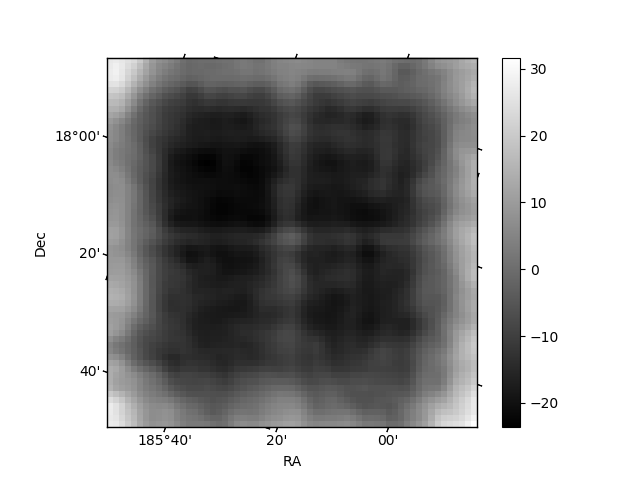
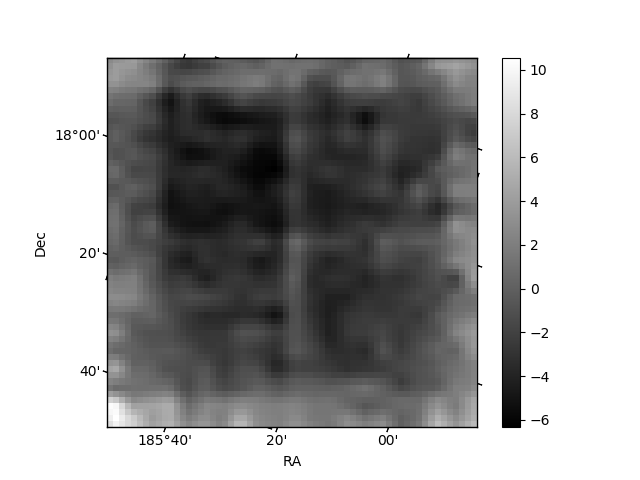
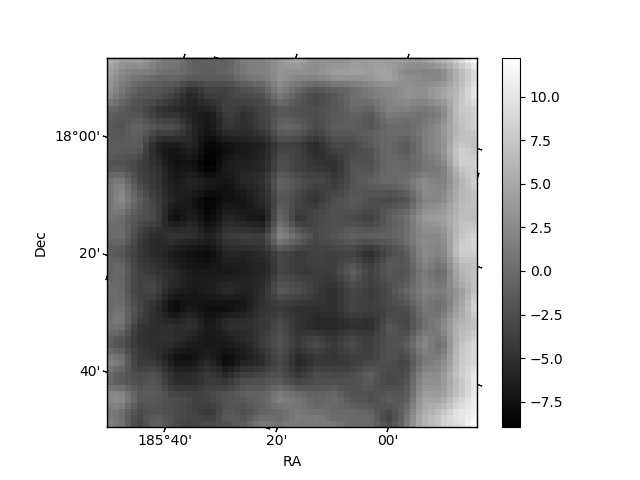
Histogram calculated using DETX and DETY for each event in the final _common_clean file
| Quadrant A | 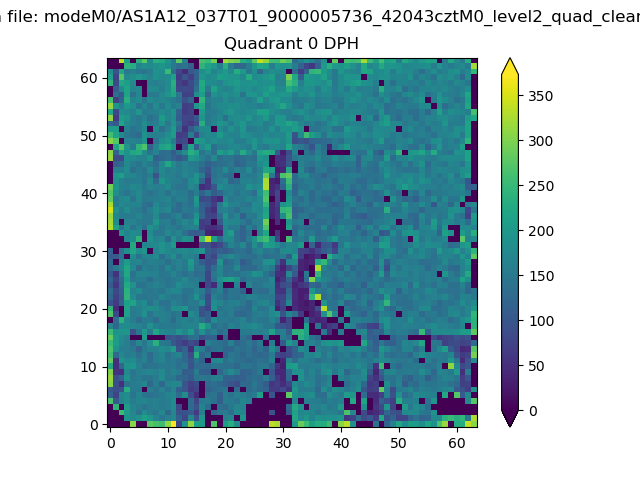 |
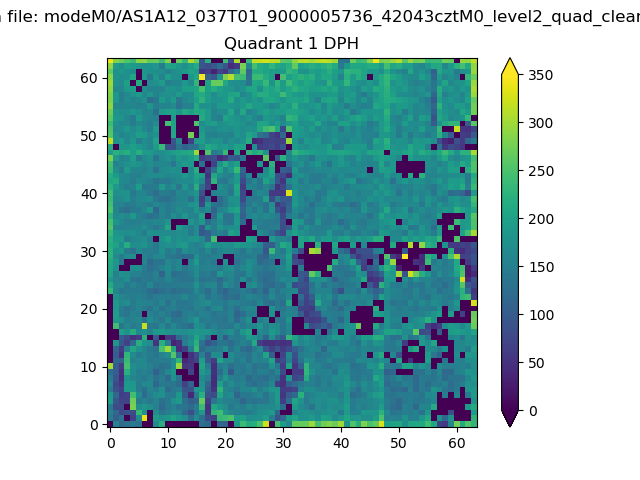 |
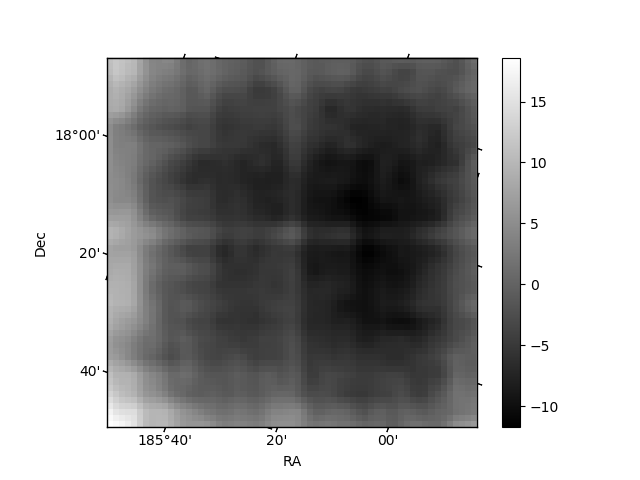
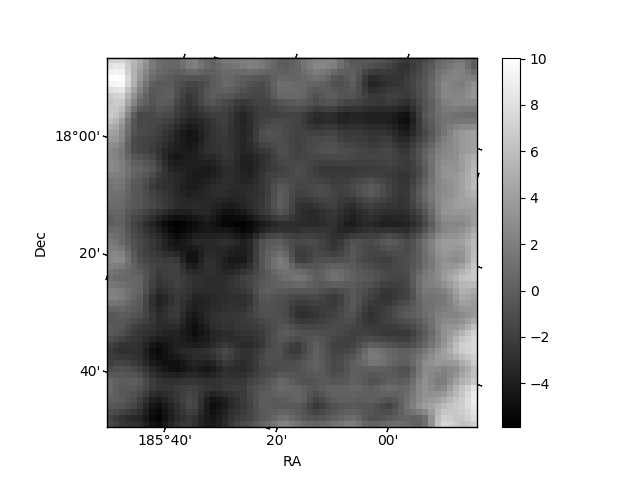
Quadrant B |
|---|---|---|---|
| Quadrant D | 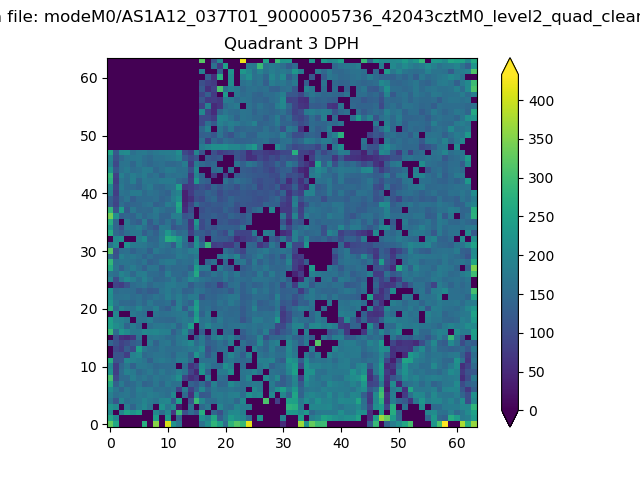 |
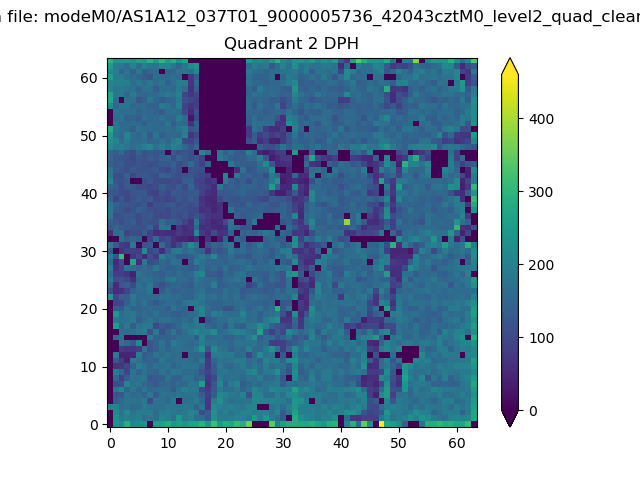 |
Quadrant C |
| Plot type | Count rate plots | Images |
|---|---|---|
| Comparison with Poisson distribution Blue bars denote a histogram of data divided into 1 sec bins. Red curve is a Poisson curve with rate = median count rate of data. |
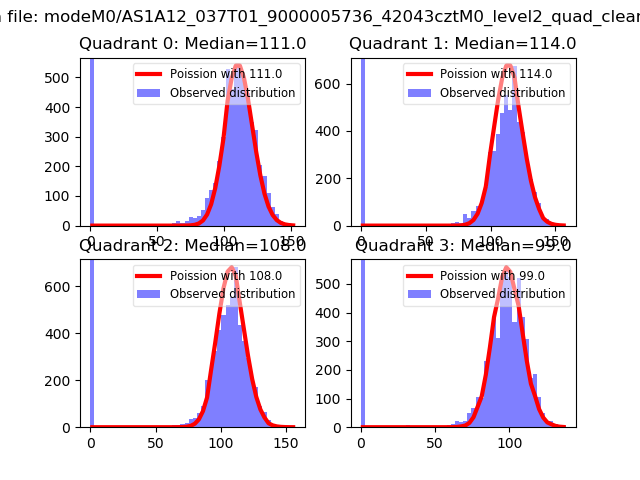 |
 |
| Quadrant-wise count rates Data is divided into 100 sec bins |
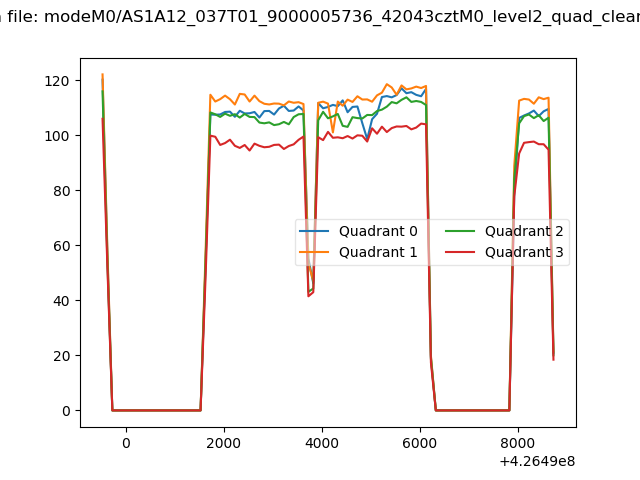 |
|
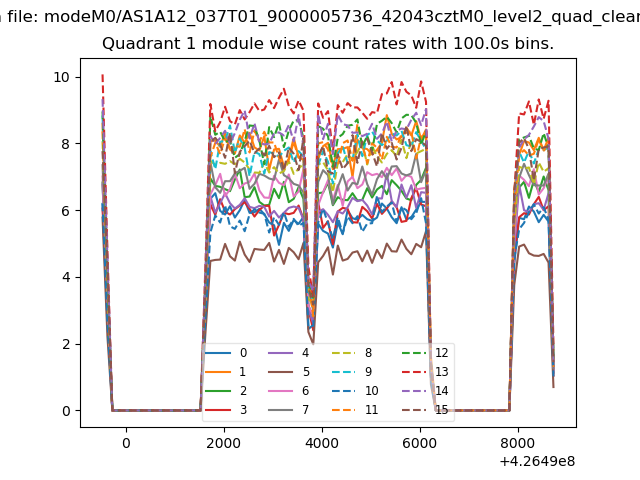
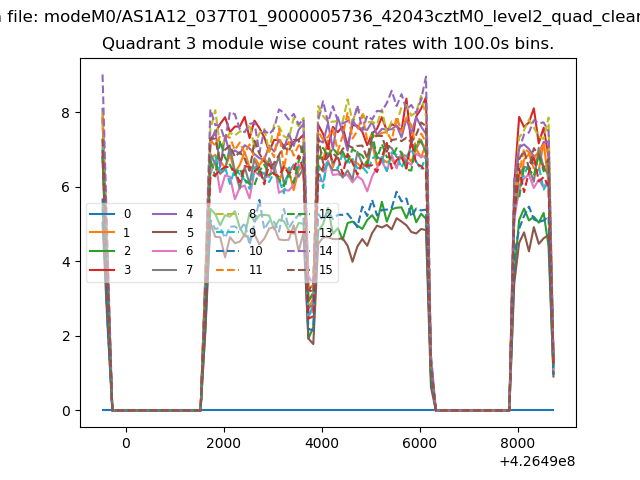
| Module-wise count rates for Quadrant A Data is divided into 100 sec bins |
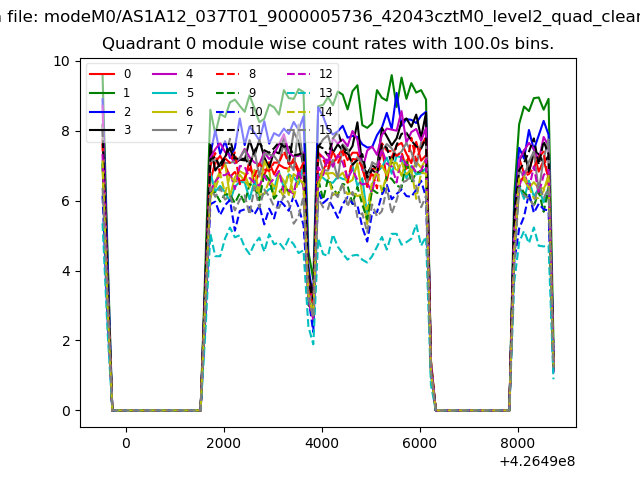 |
 |
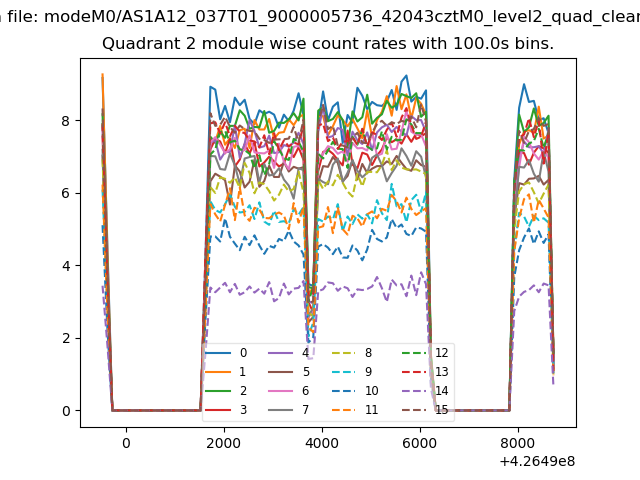
| Module-wise count rates for Quadrant B Data is divided into 100 sec bins |
 |
 |
| Module-wise count rates for Quadrant C Data is divided into 100 sec bins |
 |
 |
| Module-wise count rates for Quadrant D Data is divided into 100 sec bins |
 |
 |
| Parameter | Plot |
|---|---|
| CZT HV Monitor | 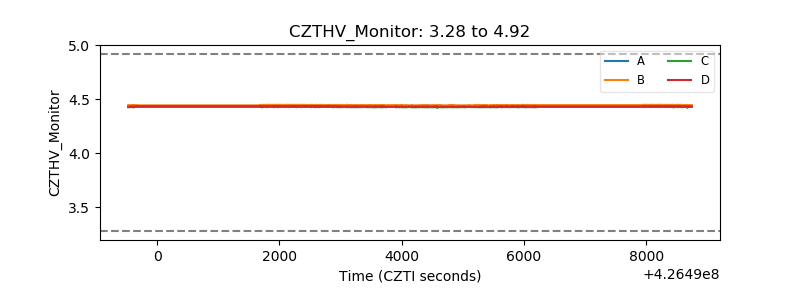 |
| D_VDD | 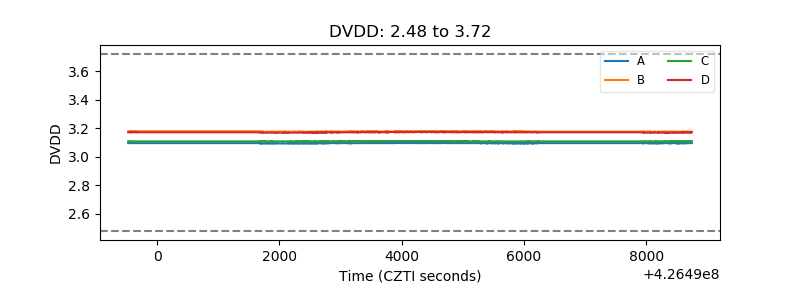 |
| Temperature 1 | 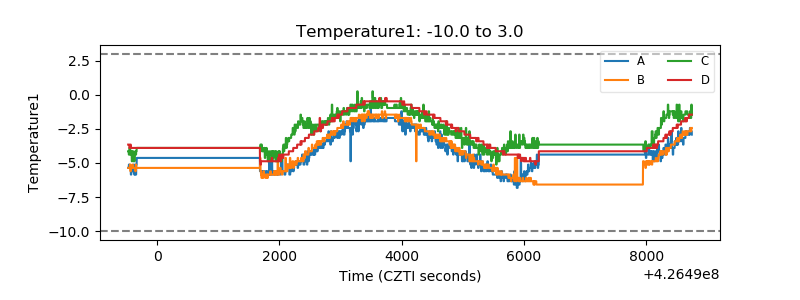 |
| Veto HV Monitor | 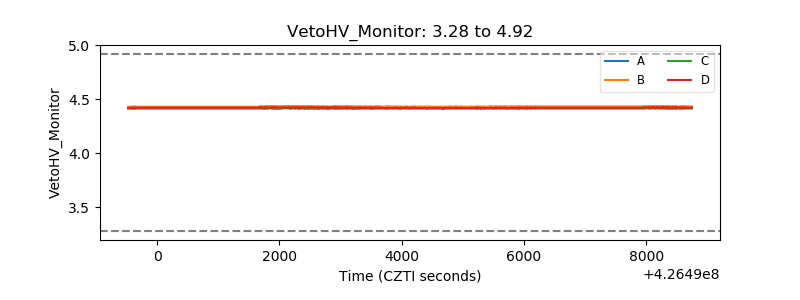 |
| Veto LLD | 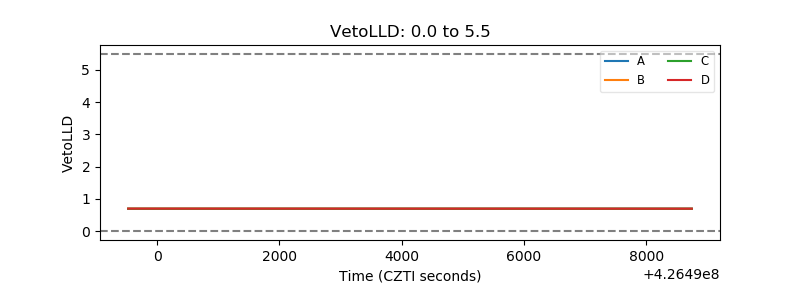 |
| Alpha Counter | 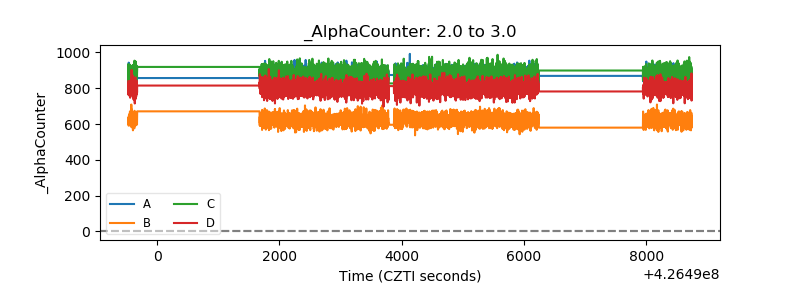 |
| _CPM_Rate | 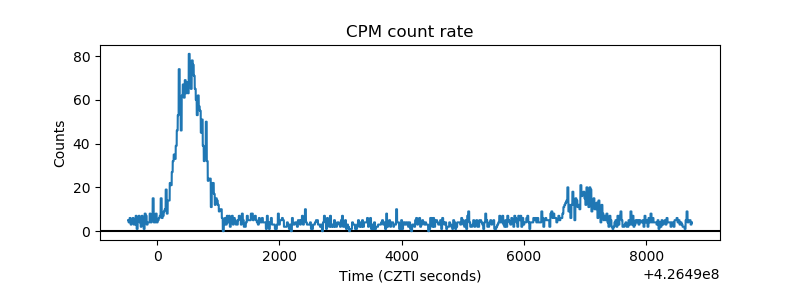 |
| CZT Counter | 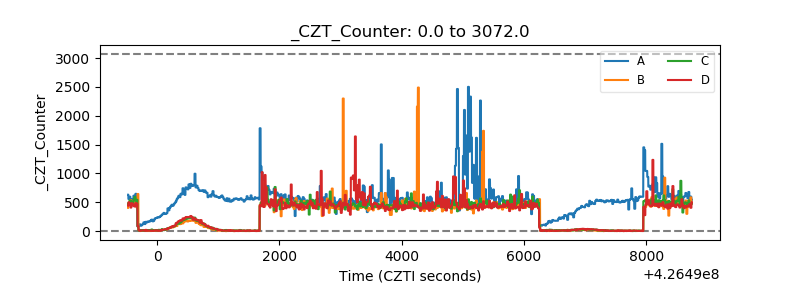 |
| +2.5 Volts monitor | 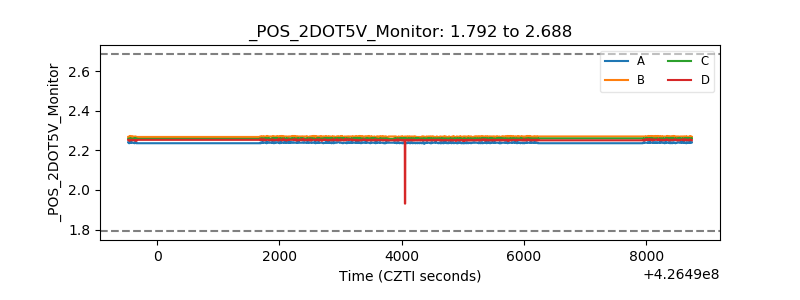 |
| +5 Volts monitor | 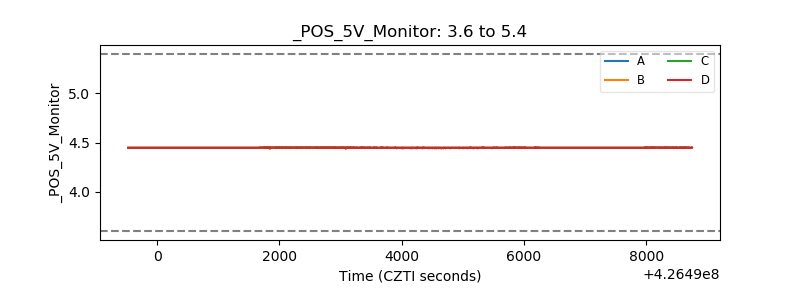 |
| _ROLL_ROT | 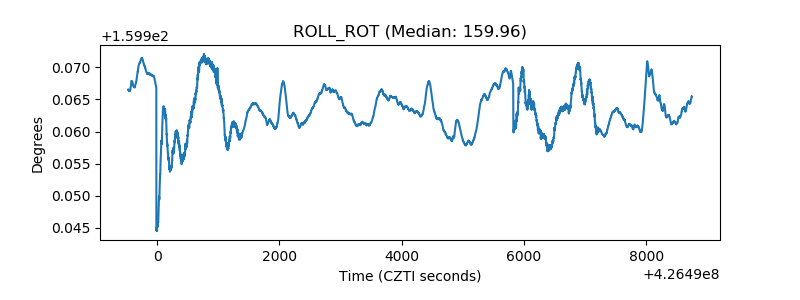 |
| _Roll_DEC | 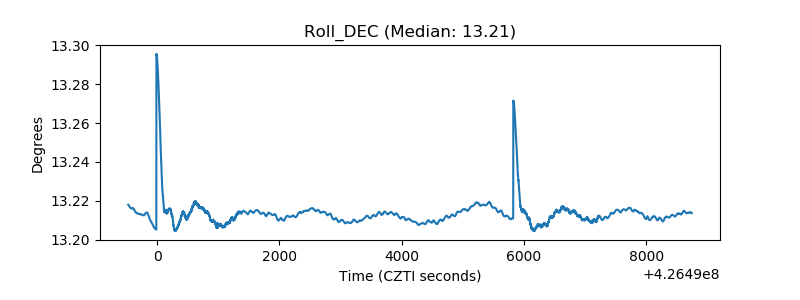 |
| _Roll_RA | 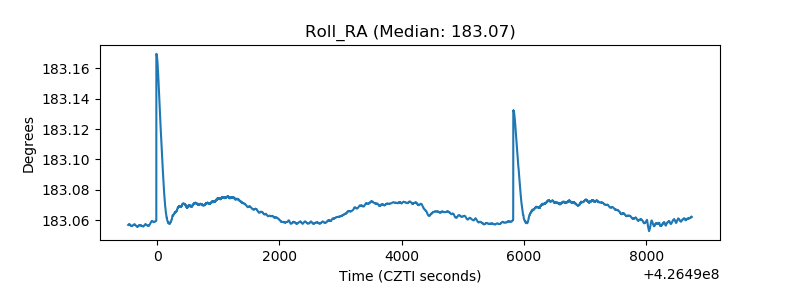 |
| Veto Counter | 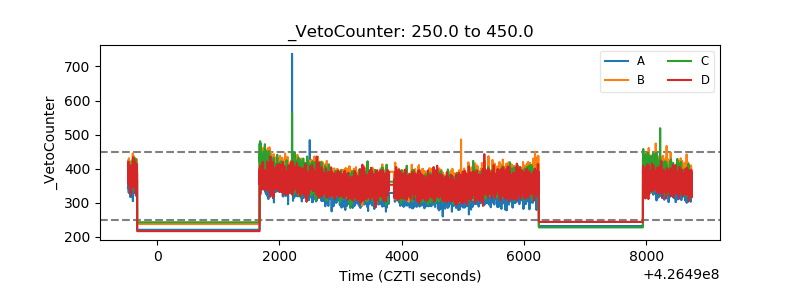 |