| Param | Original file | Final file |
|---|---|---|
| Filename | modeM0/AS1A12_037T01_9000005736_42044cztM0_level2.fits | modeM0/AS1A12_037T01_9000005736_42044cztM0_level2_quad_clean.evt |
| Size (bytes) | 411,511,680 | 95,123,520 |
| Size | 392.4 MB | 90.7 MB |
| Events in quadrant A | 4,628,117 | 623,816 |
| Events in quadrant B | 2,773,738 | 663,905 |
| Events in quadrant C | 2,777,603 | 631,026 |
| Events in quadrant D | 4,590,370 | 545,741 |
| Mode SS | |||
|---|---|---|---|
| Quadrant | BADHDUFLAG | Total packets | Discarded packets |
| A | 0 | 120 | 0 |
| B | 0 | 120 | 0 |
| C | 0 | 120 | 0 |
| D | 0 | 120 | 0 |
| Mode M0 | |||
|---|---|---|---|
| Quadrant | BADHDUFLAG | Total packets | Discarded packets |
| A | 0 | 17388 | 2 |
| B | 0 | 12350 | 2 |
| C | 0 | 11998 | 2 |
| D | 0 | 17733 | 2 |
| Mode M9 | |||
|---|---|---|---|
| Quadrant | BADHDUFLAG | Total packets | Discarded packets |
| A | 0 | 24 | 0 |
| B | 0 | 24 | 0 |
| C | 0 | 25 | 0 |
| D | 0 | 25 | 0 |
| Quadrant | Total seconds | Saturated seconds | Saturation percentage |
|---|---|---|---|
| A | 5953 | 341 | 5.728204% |
| B | 5953 | 29 | 0.487149% |
| C | 5953 | 3 | 0.050395% |
| D | 5953 | 446 | 7.492021% |
Noise dominated data is calculated using 1-second bins in cleaned event files. If a bin has >2000 counts, and if more than 50% of those come from <1% of pixels, then it is considered to be noise-dominated and hence unusable.
| Quadrant | # 1 sec bins | Bins with >0 counts | Bins with >2000 counts | High rate bins dominated by noise | Noise dominated (total time) | Noise dominated (detector-on time) | Marked lightcurve |
|---|---|---|---|---|---|---|---|
| A | 7356 | 5954 | 259 | 259 | 3.52% | 4.35% | 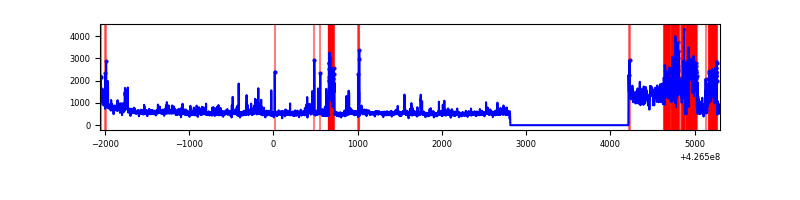 |
| B | 7356 | 5954 | 16 | 16 | 0.22% | 0.27% | 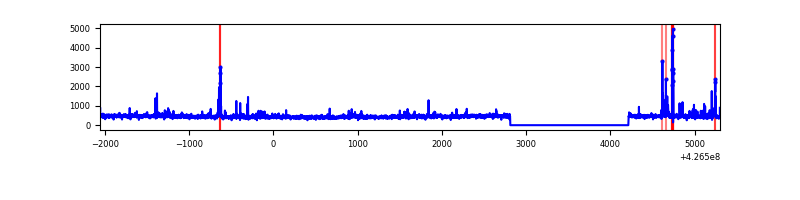 |
| C | 7356 | 5954 | 0 | 0 | 0.00% | 0.00% | 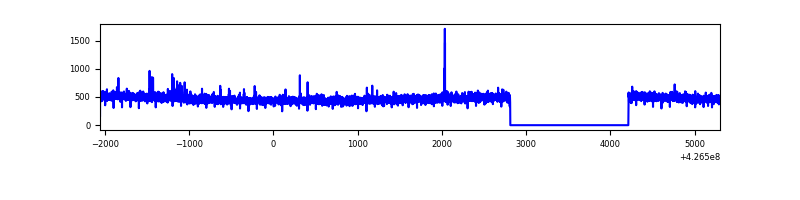 |
| D | 7356 | 5954 | 447 | 447 | 6.08% | 7.51% | 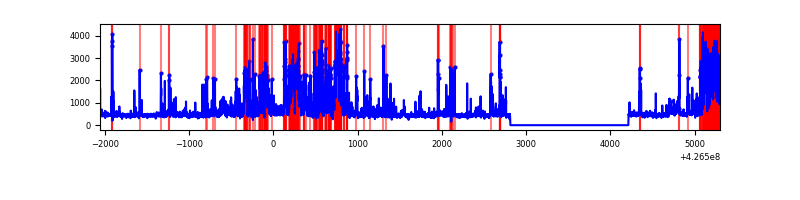 |
Top three noisy pixels from each quadrant. If the there are fewer than three noisy pixels in the level2.evt file, extra rows are filled as -1
| Pixel properties | Quadrant properties | ||||||
|---|---|---|---|---|---|---|---|
| Quadrant | DetID | PixID | Counts | Sigma | Mean | Median | Sigma |
| A | 15 | 223 | 1104303 | 8190.23 | 647 | 633 | 134.8 |
| A | 10 | 83 | 621510 | 4607.47 | 647 | 633 | 134.8 |
| A | 15 | 222 | 305865 | 2265.1 | 647 | 633 | 134.8 |
| B | 5 | 255 | 68869 | 536.29 | 651 | 632 | 127.2 |
| B | 15 | 85 | 45697 | 354.18 | 651 | 632 | 127.2 |
| B | 0 | 190 | 44708 | 346.4 | 651 | 632 | 127.2 |
| C | 15 | 214 | 254951 | 1689.75 | 639 | 643 | 150.5 |
| C | 15 | 111 | 21833 | 140.8 | 639 | 643 | 150.5 |
| C | 12 | 249 | 8157 | 49.93 | 639 | 643 | 150.5 |
| D | 12 | 233 | 1272364 | 8321.18 | 620 | 602 | 152.8 |
| D | 5 | 32 | 288986 | 1886.91 | 620 | 602 | 152.8 |
| D | 1 | 52 | 273941 | 1788.47 | 620 | 602 | 152.8 |
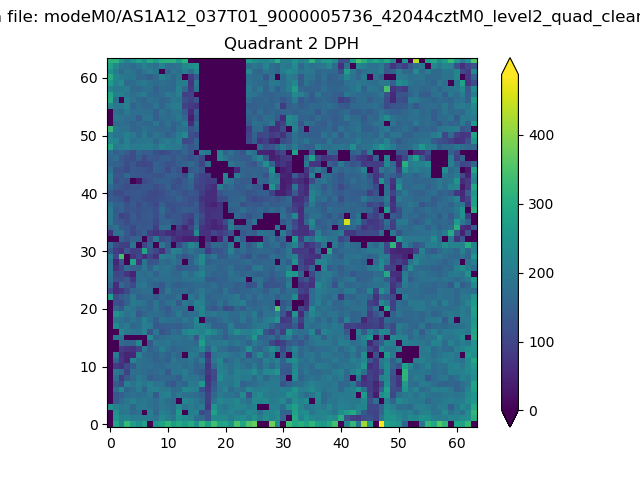
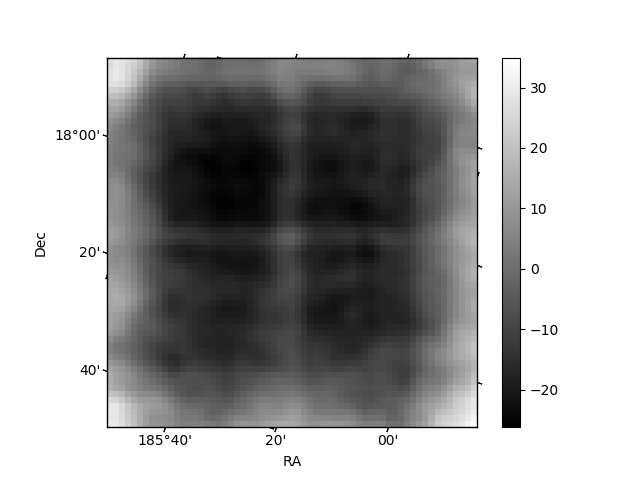
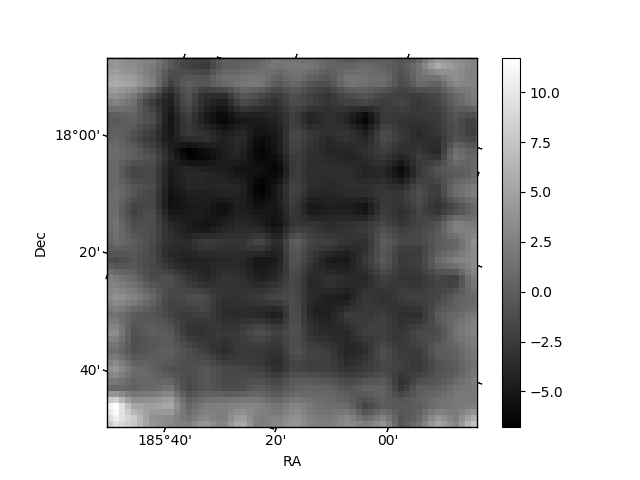
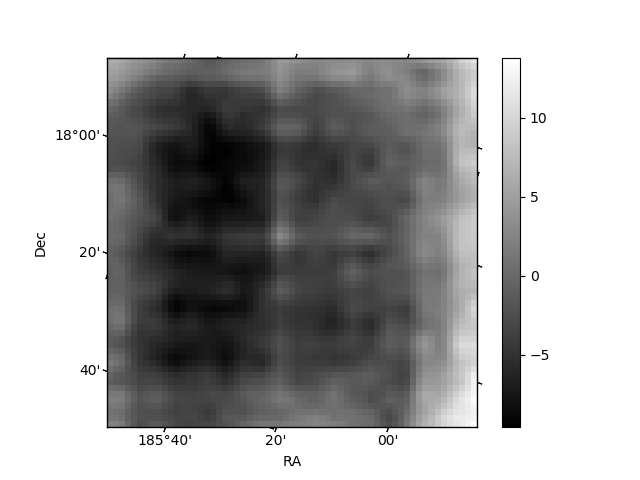
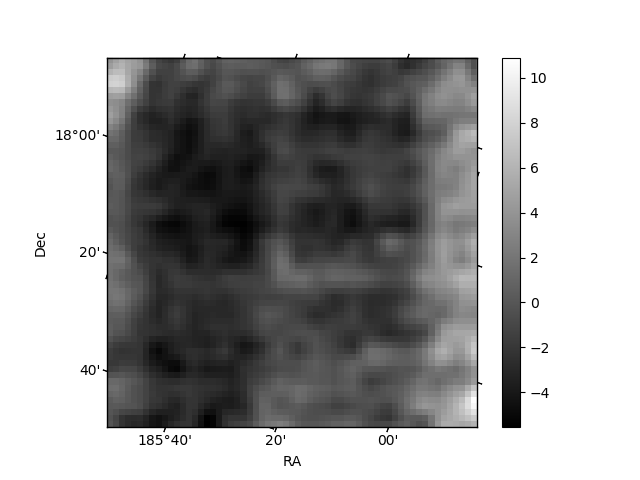
Histogram calculated using DETX and DETY for each event in the final _common_clean file
| Quadrant A | 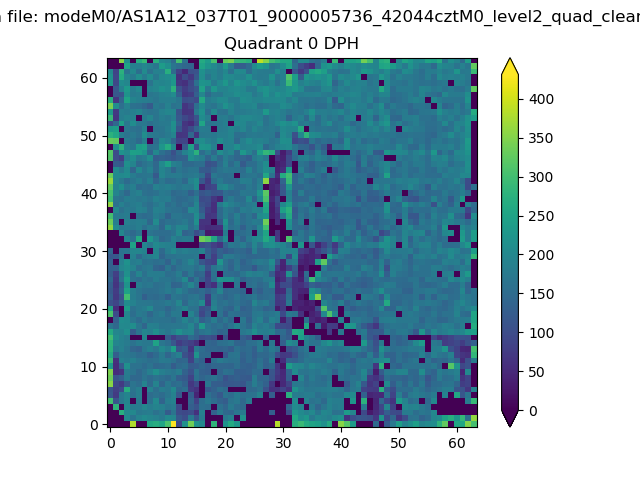 |
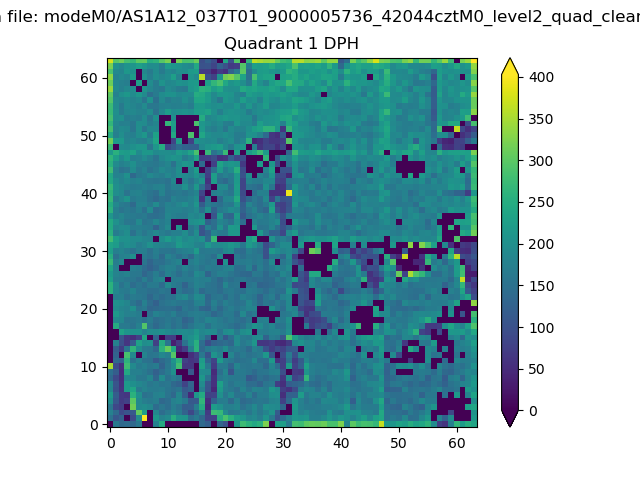 |
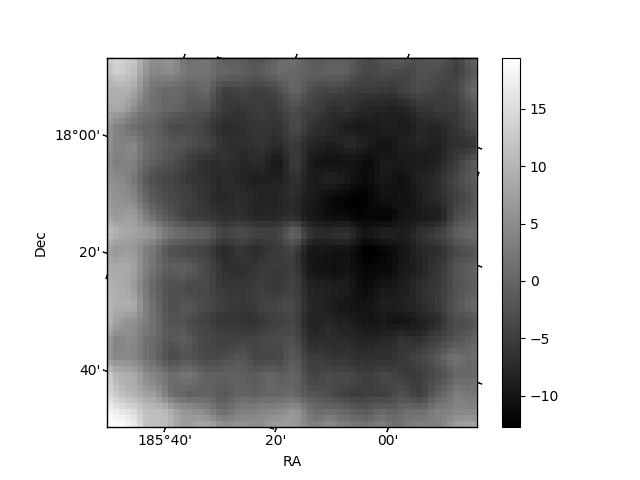
Quadrant B |
|---|---|---|---|
| Quadrant D | 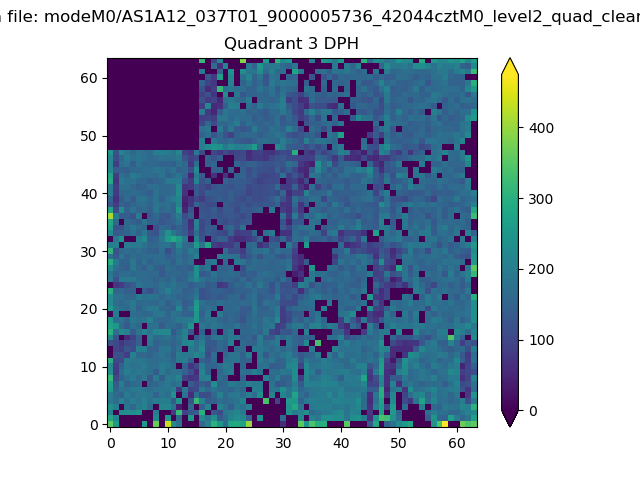 |
 |
Quadrant C |
| Plot type | Count rate plots | Images |
|---|---|---|
| Comparison with Poisson distribution Blue bars denote a histogram of data divided into 1 sec bins. Red curve is a Poisson curve with rate = median count rate of data. |
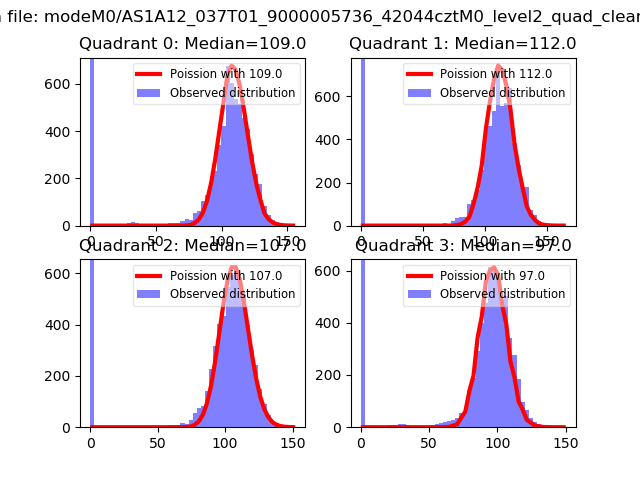 |
 |
| Quadrant-wise count rates Data is divided into 100 sec bins |
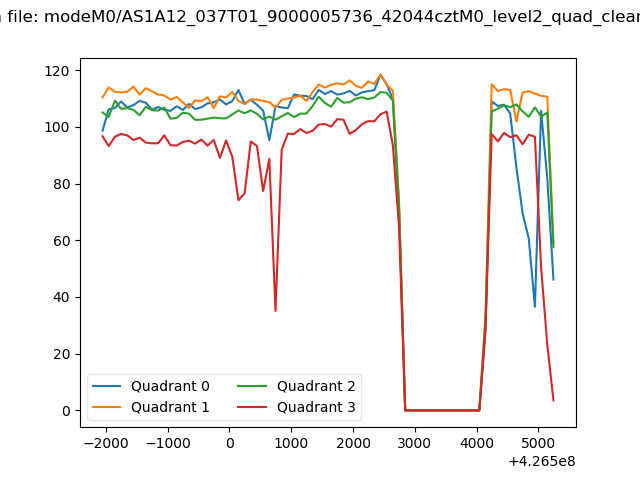 |
|
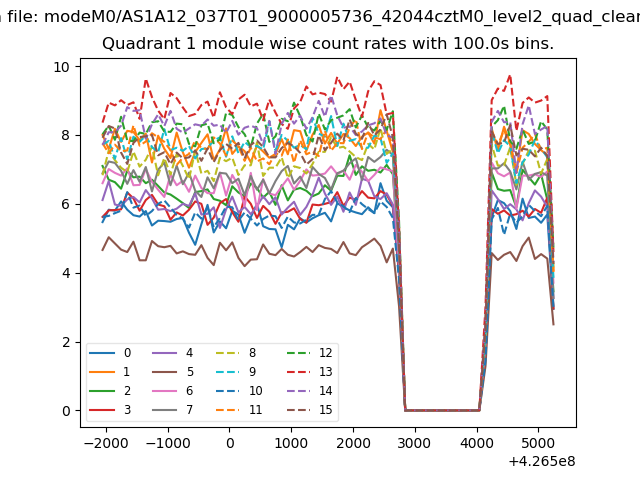
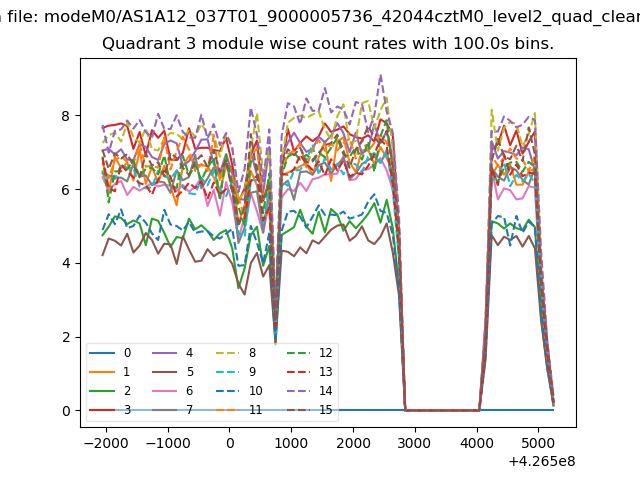
| Module-wise count rates for Quadrant A Data is divided into 100 sec bins |
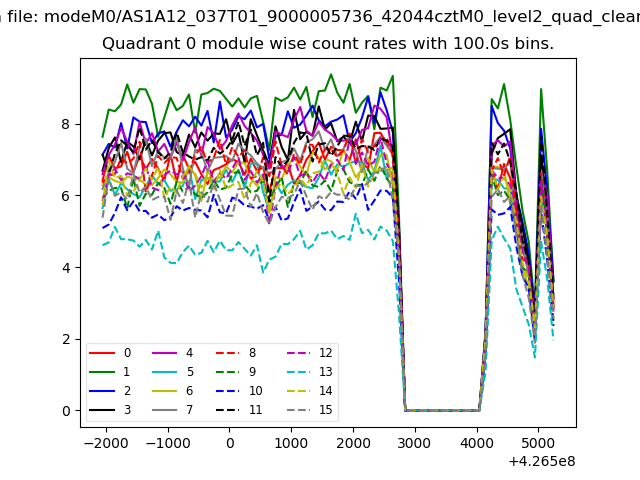 |
 |
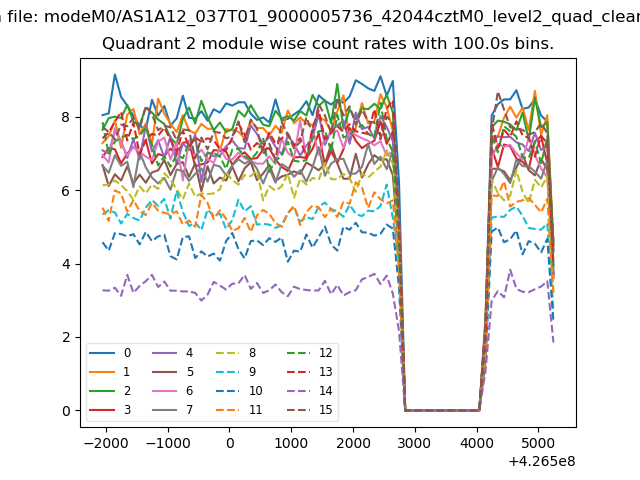
| Module-wise count rates for Quadrant B Data is divided into 100 sec bins |
 |
 |
| Module-wise count rates for Quadrant C Data is divided into 100 sec bins |
 |
 |
| Module-wise count rates for Quadrant D Data is divided into 100 sec bins |
 |
 |
| Parameter | Plot |
|---|---|
| CZT HV Monitor | 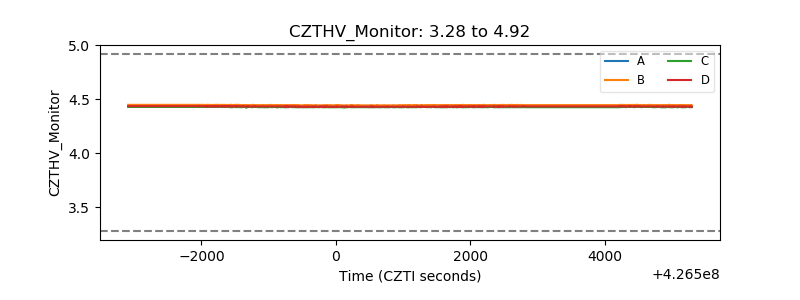 |
| D_VDD | 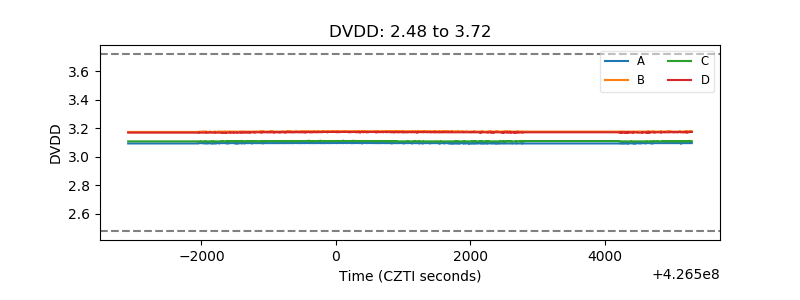 |
| Temperature 1 | 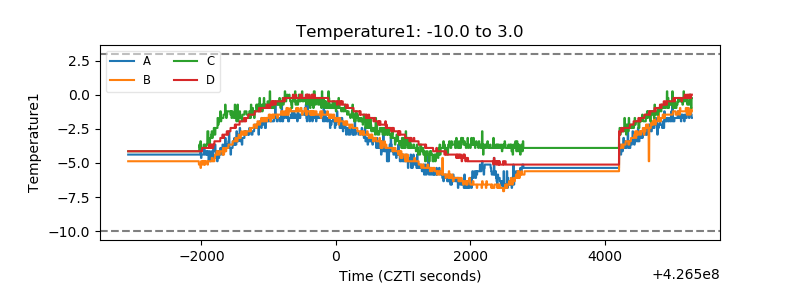 |
| Veto HV Monitor | 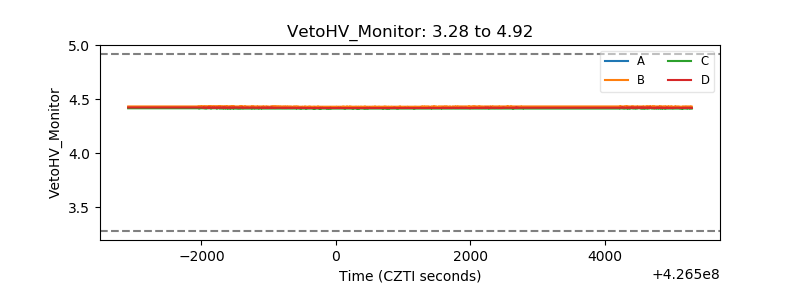 |
| Veto LLD | 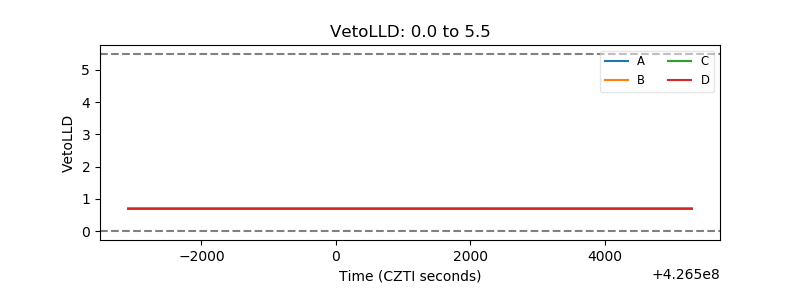 |
| Alpha Counter | 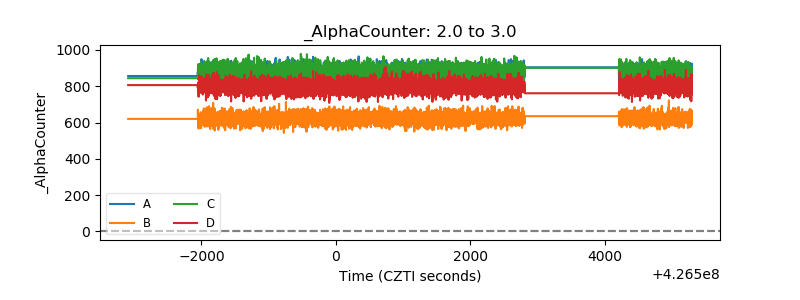 |
| _CPM_Rate | 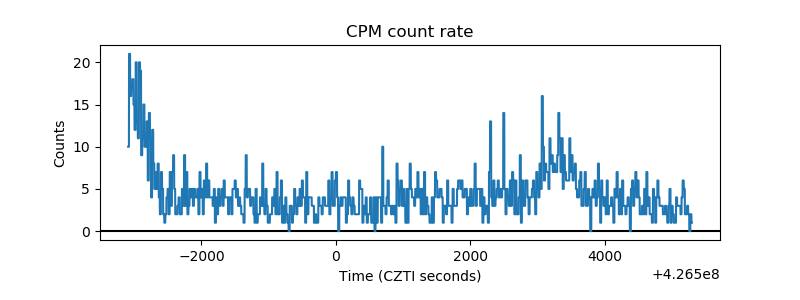 |
| CZT Counter | 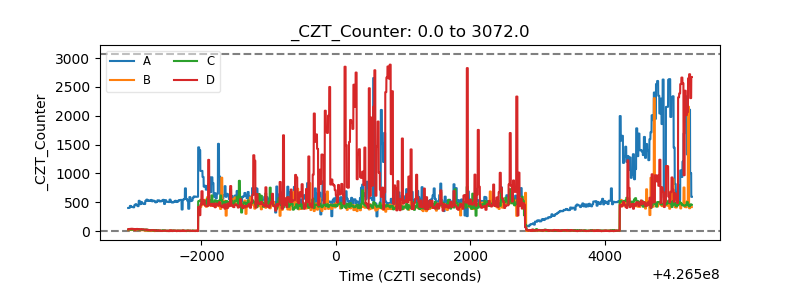 |
| +2.5 Volts monitor | 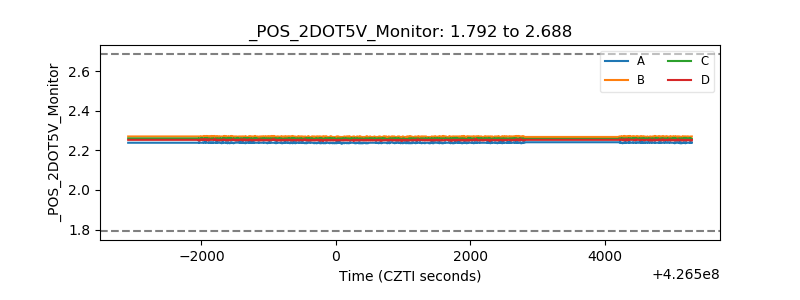 |
| +5 Volts monitor | 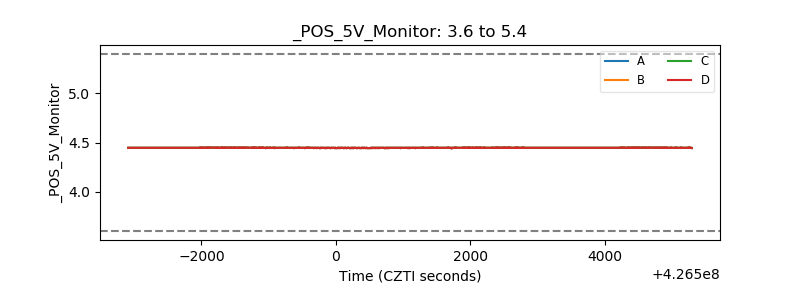 |
| _ROLL_ROT | 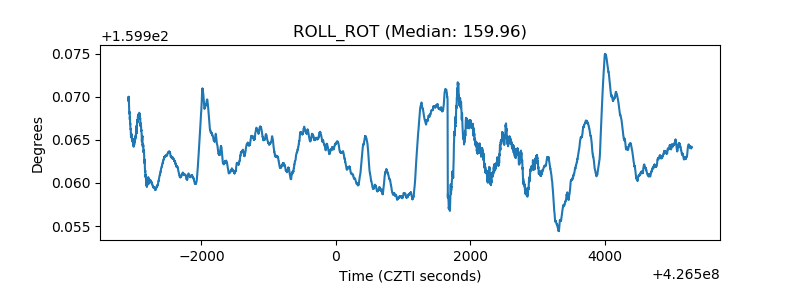 |
| _Roll_DEC | 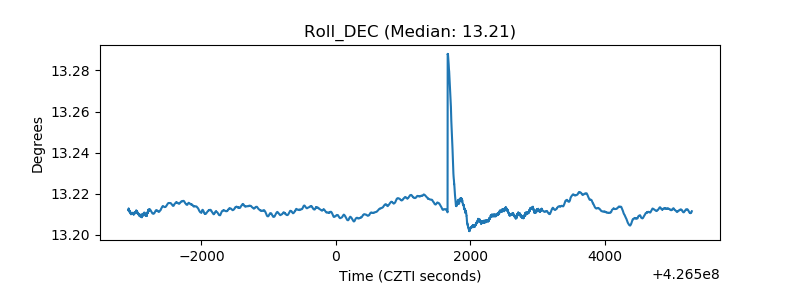 |
| _Roll_RA |  |
| Veto Counter | 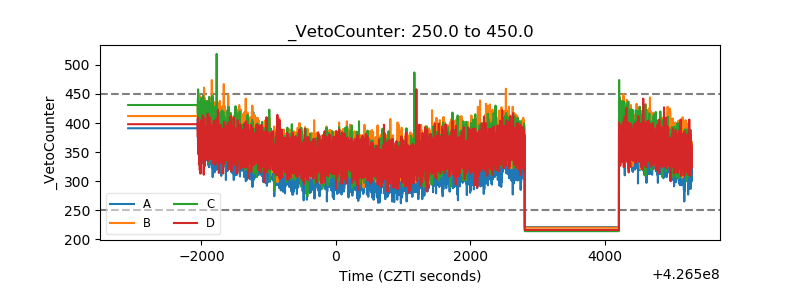 |